Abstract
Rapamycin is useful in the treatment of certain cancers by inhibiting mTOR(mammalian target of rapamycin) pathway. Here, anticancer activity and its acting mechanisms of rapamycin were investigated in human retinoblastoma Y79 cells. CCK-8 assay showed that the IC50 value of rapamycin against human retinoblastoma Y79 cells was 0.122 ± 0.026 μmol/L. Flow cytometry analysis indicated that rapamycin induced G1 cell cycle arrest. Western blot assay demonstrated that the mTOR pathway in Y79 cells was blocked by rapamycin. Western blot and RT-PCR assay showed that Bmi-1 was downregulated in protein and mRNA level by rapamycin treatment. Further Western blot and RNA interference assays showed that rapamycin-mediated downregulation of Bmi-1 induced decreases of cyclin E1, which accounted for rapamycin-mediated G1 cell cycle arrest in human retinoblastoma cells. Together, all these results illustrated that rapamycin induced growth inhibition of human retinoblastoma cells, and inactive of mTOR pathway and downregulation of Bmi-1 was involved in its action mechanism.
Keywords: Retinoblastoma, rapamycin, cell cycle, mTOR pathway, Bmi-1, cyclin E1
Introduction
Retinoblastoma is the most common primary intracellular malignancy in childhood with an incidence of 1/15,000 to 1/20,000 births [1]. Untreatment of retinoblastoma is always fatal and the patients die of intracranial extension and disseminated disease within 2 years [2]. Primary management of retinoblastoma consists of chemoreduction with local consolidation, although newer techniques include local delivery via intra-arterial chemotherapy, periocular, or intravitreal injection [3,4]. In developing countries, treatment is limited. Long-term survival rates are low and current chemotherapy causes significant morbidity to pediatric patients and significantly limits dosing [5]. Therefore there is an urgent need to identify new therapeutic strategies to improve the clinical outcome of patients with retinoblastoma [6].
Rapamycin is a macrolide produced by the bacteria Streptomyces hygroscopicus [7]. Which was originally developed as an antifungal agent [8]. However, this use was abandoned when it was found to have potent immunosuppressive and antiproliferative properties [9,10]. Now rapamycin is useful in the treatment of certain cancers by inhibiting mTOR (mammalian target of rapamycin) pathway [11,12]. In this study, we reported the anticancer activity of rapamycin in human retinoblastoma Y79 cells and its acting mechanisms.
Materials and methods
Chemicals and reagents
RPMI 1640 media was obtained from Gibco BRL. Fetal bovine serum (FBS) was purchased from Life Technologies Corporation. Cell Counting Kit-8 (CCK-8) was a product from Beyotime Corporation. Rapamycin, penicillin, streptomycin, propidium iodide(PI) and other chemicals were purchased from Sigma Chemical Co. mTOR, p-mTOR, Bmi-1, Cyclin E1, and β-actin antibodies were purchased from Cell Signaling Technology Inc. Primer sequences, specific siRNA sequences of Bmi-1 and nonspecific control siRNA sequences were designed and synthesized by GenePharma Co. TRIzol and Ltd. Lipofectamine® 2000 was a product from Invitrogen Corporation. AMV Reverse Transcriptase System was purchased from Promega Company.
Cell lines and cell culture
The human retinoblastoma cell line Y79 was obtained from ATCC. Y79 cells were cultured in RPMI 1640 medium supplemented with 10% FBS, 1% penicillin, and streptomycin. Cells were cultured at 37°C in a humidified atmosphere incubator of 5% CO2 and 95% air.
Cell proliferation assays
CCK-8 assay was used to detect cells viability. Briefly, cells were seeded in 96-well plates with an average of 3,000 cells/well for 24 h. 10 μl rapamycin diluted with medium at full range concentrations were added to the wells for another 48 hours. 10 μl CCK-8 solutions were added to each well and incubated at 37°C for an additional 2 h. Optical Density (OD) value was measured at 450 nm by Thermo Scientific Fluoroskan Ascent FL (Thermo Fisher Scientific Inc.). Finally, IC50 values were calculated from survival curves as Tao, et al described [13]. All experiments were replicated at least three times.
Cell cycle analyses
Y79 cells were treated with rapamycin as indicated concentration for 48 h, and then trypsinized, washed in PBS, and fixed in ice-cold 75% ethanol/PBS. 1×10⁶ cells were stained in 50 μg/ml PI for 30 min. Cells were classified by flow cytometry analysis (Beckman Coulter, Inc), and cell cycle profiles were determined using MultiCycle AV software. All experiments were replicated at least three times.
Western blot analyses
Y79 cells were treated with rapamycin as indicated concentration for 48 h, and then lysed for 5 minutes in cold lysis buffer. Cell lysates were centrifuged at 10,000 g for 20 min, and the supernatant was collected. Protein lysate of 50 μg was separated on 8-12% SDS-PAGE gel and electrotransferred onto a PVDF membrane (Millipore, USA). The PVDF membrane was blocked with 5% nonfat milk powder (w/v) in TBST (10 mm Tris, 100 mm NaCl, 0.1% Tween 20) for 2 h, and then incubated with primary antibody described above at 4°C overnight. Thereafter, the appropriate HRP-linked secondary antibodies were added for an additional 1 h incubation. Finally, the bands of specific proteins on the membranes were detected with Western Blotting Luminal Reagent (Millipore, USA). β-actin was used as an endogenous control. All experiments were replicated at least three times.
Reverse transcription-PCR
Y79 cells were treated with rapamycin as indicated concentration for 48 h, and then total RNA was extracted using TRIzol. The single-stranded cDNA was reversely transcribed by AMV Reverse Transcriptase System. PCR reactions were performed by ABI Prism 9700 PCR System (Applied Biosystems). For all of cDNA, 35 cycles (94°C 30 s, 60°C 30 s, and 72°C 1 min) were used. PCR primers were 5’-GTA TTC CCT CCA CCT CTT CTT G-3’ (forward) and 5’-TGC TGA TGA CCC ATT TAC TGA T-3’ (reverse) for Bmi-1, and 5’-GGG ACC TGA CTG ACT ACC TCA-3’ (forward) and 5’-GAC TCG TCA TAC TCC TGC TTG-3’ (reverse) for β-actin, respectively. β-actin was used as an endogenous control. All PCR reactions were replicated at least three times.
Bmi-1 siRNA studies
The siRNA were transfected using Lipofectamine 2000 following the manufacturer’s instructions. Briefly, 5×10⁵ cells were plated in 6-well plates. Y79 cells were transfected with 50 nmol/L Bmi-1 or negative control siRNA duplex components using 5 μL Lipofectamine 2000 per well. After 48 hours of incubation, the total protein extracted from the harvested cells was subjected to Western blot analysis for Bmi-1. All experiments were replicated at least three times.
Statistical analyses
Data were statistically analyzed by SPSS Statisics 16.0 software. Independent t-test was used between two groups, and the comparisons among multiple groups were performed with a one-way analysis of variance (ANOVA) followed by Dunnett’s test. The significance was determined at P<0.05.
Results
Effects of rapamycin on human retinoblastoma Y79 cells proliferation
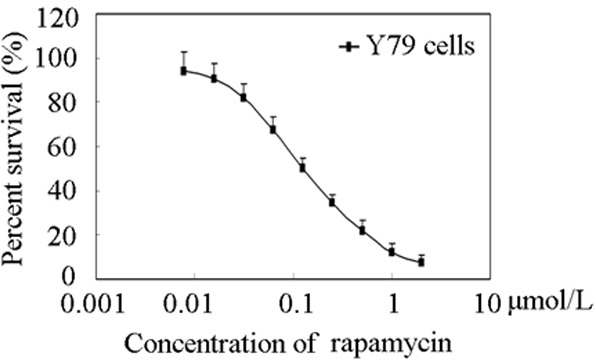
To determine the effect of rapamycin on human retinoblastoma Y79 cells viability, we treated cells with indicated concentrations (0.1, 0.2, and 0.4 μmol/L) of rapamycin at time points (48 h). Cell viability was measured by CCK-8 assay. The proliferation of Y79 cells was inhibited by rapamycin in a dose-dependent manner as showed in Figure 1. The IC50 value was 0.122 ± 0.026 μmol/L. CCK-8 assay indicated that rapamycin was more effective in inhibiting the growth of human retinoblastoma Y79 cells.
Figure 1.

Effects of rapamycin on Y79 cells proliferation. Cell viability assays were performed using CCK-8 assay as described under “Materials and methods”. The cells were exposed to the indicated concentrations of rapamycin for 72 h. Each point displayed the mean ± S.E. of three independent experiments.
Rapamycin induced G1 cell cycle arrest in human retinoblastoma Y79 cells
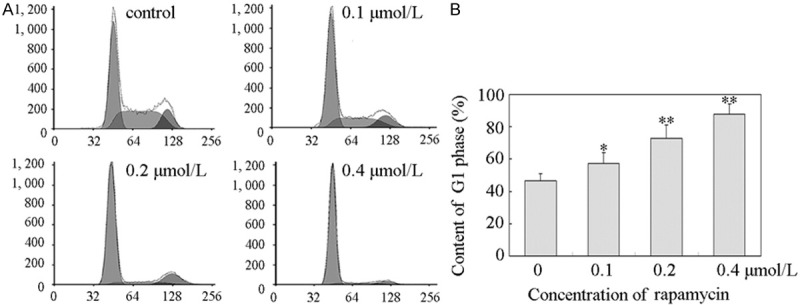
To initially examine the cell cycle effects of rapamycin in human retinoblastoma cells, Y79 cells were treated with 0.1, 0.2, and 0.4 μmol/L or without rapamycin for 48 h. The cells were then fixed, nuclear DNA was stained with PI, and cell cycle populations were quantified by flow cytometry. As showed in Figure 2A, the cell population exhibited increases in the percentage of cells in G1 phase and decreases in the percentage of cells in S phase. G1 phase distribution was increased from 46.4 ± 4.5% to 57.2 ± 6.8%, 72.7 ± 8.2%, and 87.9 ± 6.2% (Figure 2B). The results showed that rapamycin induced G1 arrest in a time-dependent manner.
Figure 2.

Rapamycin induced a G1 cell cycle arrest in Y79 cells. A. Rapamycin induced a G1 cell cycle arrest in Y79 cells. Y79 cells were plated in six-well culture plates and treated for 48 h with vehicle control or 0.1, 0.2, and 0.4 μmol/L rapamycin for 48 h, respectively. Cell were harvested and stained with propidium iodide as described in “Materials and methods”. Nuclei were tested for DNA content by flow cytometry. All these experiments were replicated at least thrice, and a representative example of the DNA content frequency histograms was shown. B. Cell cycle distribution. Cell cycle distribution was assessed by MultiCycle AV software. The percentage of cells at G1 phase was 46.4 ± 4.5%, 57.2 ± 6.8%, 72.7 ± 8.2%, and 87.9 ± 6.2% in 0, 0.1, 0.2, and 0.4 μmol/L rapamycin treatment, respectively. Columns, means of triplicate determinations; bars, SDs; *, P<0.05; **, P<0.01 as compared with respective controls.
Rapamycin caused a decrease in phosphorylation of mTOR in human retinoblastoma Y79 cells
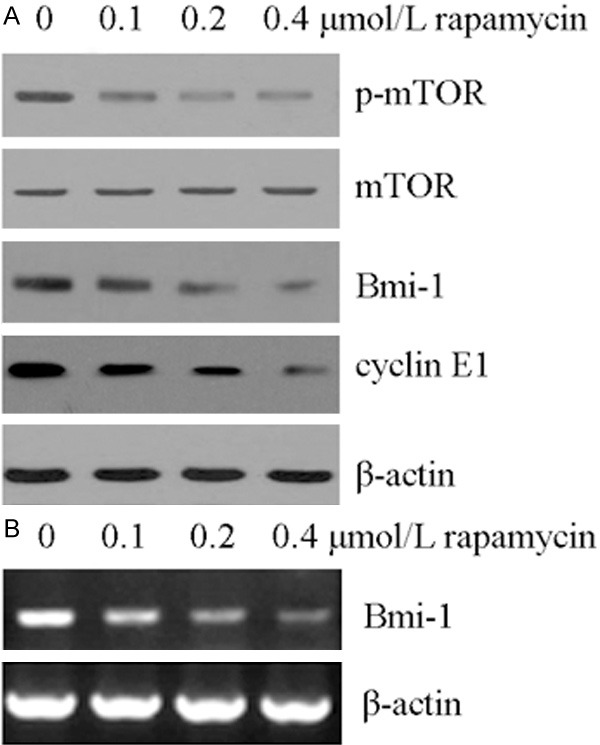
Rapamycin was known as an inhibitor of mTOR pathway [14]. So, we detected the effect of rapamycin on mTOR protein in human retinoblastoma Y79 cells by Western blot analysis. As showed in Figure 3A, the expression level of the phosphorylated mTOR (p- mTOR) was decreased in the rapamycin -treated cells, without any changes in the total mTOR protein level. The results showed that the mTOR pathway in Y79 cells was blocked by rapamycin.
Figure 3.

Rapamycin inhibited mTOR activity and reduced BMI-1 and cyclin E1. A. Rapamycin inhibited mTOR pathway and reduced BMI-1 and cyclin E1 protein. Y79 cells were treated with the indicated concentration of rapamycin for 48 h. The indicated protein levels were determined by Western blot analysis as described in “Materials and methods”. β-Actin protein levels were used as a loading control. All these experiments were replicated at least thrice, and a representative experiment was shown in each panel. B. Rapamycin decreased the mRNA expression of Bmi-1. Y79 cells were treated with the indicated concentration of rapamycin for 48 h. The indicated mRNA levels were determined by semi-quantitative RT-PCR analysis as described in “Materials and methods”. β-Actin mRNA levels were used as a loading control. All these experiments were replicated at least thrice, and a representative experiment was presented in each panel.
Rapamycin decreased the amount of Bmi-1 and cyclin E1 protein through mTOR pathway
Cyclin E1 was a key factor that elicits G1/S progression. Numerous data had demonstrated that cyclin E1 was downregulated by inhibition of mTOR pathway [15,16]. We next explored the effect of rapamycin on cyclin E1 protein by Western blot analysis. The result showed that rapamycin induced down-regulation of cyclin E1 (Figure 3A). Cyclin E1 was a common target of Bmi1 [17], and Bmi1 could be regulated by rapamycin [18]. As showed in Figure 3A and 3B, the amount of Bmi-1 was reduced in protein and mRNA level after rapamycin treated for 48 h. We presumed that the inhibition of mTOR pathway by rapamycin might correspond to an inactivation of Bmi-1 to downregulation of cyclin E1.
Bmi-1 siRNA reduced cyclin E1 and corresponding increased the percentage of cells at G1 phase
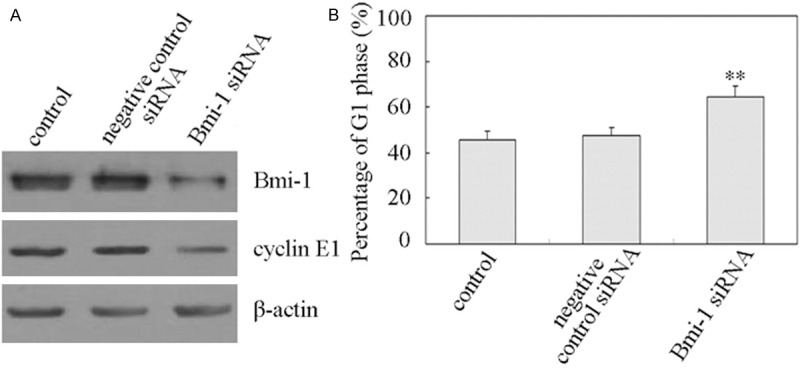
We next examined the effect of the inhibition of Bmi-1 expression on cell proliferation in human retinoblastoma Y79 cells. Y79 cells were transfected with specific Bmi-1 siRNA and negative control siRNA. Results in Figure 4A showed that suppression of Bmi-1 by Bmi-1 siRNA resulted in the decrease of cyclin E1. These data indicated that down-regulation of cyclin E1 was related to Bmi-1. In addition, the suppression of Bmi-1 induced a G1 cell cycle arrest (Figure 4B). Flow cytometry analysis showed that G1 distribution of the Y79 cells was 45.6 ± 3.9% and 64.2 ± 5.2% in control and Bmi-1 siRNA group (Figure 4B).
Figure 4.

Depletion of Bmi-1 caused decreases of cyclin E1 and increases of G1 phase. A. Depletion of Bmi-1 caused decreases of cyclin E1. Y79 cells were transfected with specific Bmi-1 siRNA as well as with the negative control siRNA as described in “Materials and methods”. After transfection for 48 h, the protein expression of Bmi-1 and cyclin E1 was detected by Western blot analysis. β-Actin protein levels were used as a loading control. All these experiments were repeated at least thrice, and a representative experiment was presented in each panel. B. Depletion of Bmi-1 caused increases of G1 phase. Y79 cells were transfected with specific Bmi-1 siRNA as well as with the negative control siRNA. After transfection for 48 h, cells were subjected to subsequent flow cytometric analysis as described in “Materials and methods”. The percentage of cells at G1 phase was estimated by MultiCycle AV software. Columns, means of triplicate determinations; bars, SDs; **, P<0.01 as compared with respective controls.
Discussion
Retinoblastoma (Rb) is the most frequent pediatric eye cancer [19]. Though chemotherapy with adjuvant local treatments is adequate for early tumors, enucleation still plays a major role in the treatment of retinoblastoma [20]. However, present chemotherapy treatments result in noteworthy complications including second malignancies (e.g., acute myeloid leukemia) [5]. Now, novel targeted therapeutic strategies are intended to effectively control cancer [21]. Serine-threonine kinase, mTOR, plays a key role in cell growth and angiogenesis and may be dysregulated in tumors [22,23]. For these reasons, mTOR has recently been promoted as a potential target for anti-cancer therapy [24]. In this study, we found that rapamycin, a mTOR inhibitor, showed potent anticancer activity against human retinoblastoma Y79 cell (Figure 1). Moreover, our further investigation elucidated that down-regulation of Bmi-1 and subsequent degradation of cyclin E1 was involved in its action mechanisms.
Cyclins are the key regulators of cell cycle progression. There are 2 major classes of G1 cyclins: cyclin D and cyclin E. E type cyclins (E1 and E2) is believed to drive cell entry into the S phase [25]. Cyclin E forms a complex and functions as a regulatory subunit of CDK2, whose activity is required for cell cycle G1/S transition [26]. Many data supported the premise that cyclin E is a critical target of signals activated during tumorigenesis. A recent study also showed that cyclin E expression could be regulated by PI3K/Akt/mTOR signal pathways [27]. In this study, down-regulated cyclin E1 was showed in rapamycin (mTOR inhibitor)-treated human retinoblastoma Y79 cells (Figure 3A). Which inhibited progression through G1 phase of the cell cycle in Y79 cells (Figure 2).
Bmi-1 is consisting of 326 amino acids and a key component of the Polycomb gene family, which was originally identified as a MYC cooperating oncogene in murine lymphomas, and played a role in cell cycle, cell immortalization, and senescence [28]. Numerous studies demonstrated that Bmi-1 was upregulated in a variety of cancers [29], and had a positive correlation with clinical grade/stage and poor prognosis [30]. Recently, Bmi-1 had been identified as a target gene for induction of cell cycle arrest [31]. It was believed that cyclin E1 was regulated by Bmi-1 [17]. In our study, the degradation of cyclin E1 protein levels was demonstrated after transfected with specific Bmi-1 siRNA in Y79 cells (Figure 4A). The results showed that downregulation of Bmi-1 were associated with G1/S phase cell cycle arrest (Figure 4B).
mTOR assumes a key regulatory role in cell growth and homeostasis. Inhibition of mTOR now uses as a novel treatment strategy for several malignancies, either alone or in combination with strategies. In this study, we concisely evaluate the best known ability of mTOR to control the G1-phase progression in human retinoblastoma Y79 cells. The data documented that rapamycin (a mTOR inhibitor) induced cells death and growth inhibition of human retinoblastoma Y79 cells by downregulation of Bmi-1 protein and mRNA expression, and which was mediated through the mTOR pathway. Although further studies are needed, data have delineated the anticancer activity of rapamycin and its involved action mechanisms in human retinoblastoma cells.
Acknowledgements
This work was supported by grants from Guangdong Province special science and technology (new drug discovery) project (2012-A080201002), Guangdong Province Foshan City industry-university-research special project of Gaoming District in 2012 (201211).
Disclosure of conflict of interest
None.
References
- 1.Villegas VM, Hess DJ, Wildner A, Gold AS, Murray TG. Retinoblastoma. Curr Opin Ophthalmol. 2013;24:581–588. doi: 10.1097/ICU.0000000000000002. [DOI] [PubMed] [Google Scholar]
- 2.Chintagumpala M, Chevez-Barrios P, Paysse EA, Plon SE, Hurwitz R. Retinoblastoma: review of current management. Oncologist. 2007;12:1237–1246. doi: 10.1634/theoncologist.12-10-1237. [DOI] [PubMed] [Google Scholar]
- 3.Houston SK, Lampidis TJ, Murray TG. Models and discovery strategies for new therapies of retinoblastoma. Expert Opin Drug Discov. 2013;8:383–394. doi: 10.1517/17460441.2013.772975. [DOI] [PubMed] [Google Scholar]
- 4.Okimoto S, Nomura K. Clinical Manifestations and Treatment of Retinoblastoma in Kobe Children’s Hospital for 16 Years. J Pediatr Ophthalmol Strabismus. 2014;51:222–9. doi: 10.3928/01913913-20140513-01. [DOI] [PubMed] [Google Scholar]
- 5.Zheng Q, Zhang Y, Ren Y, Wu Y, Yang S, Zhang Y, Chen H, Li W, Zhu Y. Antiproliferative and apoptotic effects of indomethacin on human retinoblastoma cell line Y79 and the involvement of beta-catenin, nuclear factor-kappaB and Akt signaling pathways. Ophthalmic Res. 2014;51:109–115. doi: 10.1159/000355844. [DOI] [PubMed] [Google Scholar]
- 6.Suesskind D, Schrader M, Foerster MH, Ernemann U, Aisenbrey S. Cataract formation: a possible complication of intra-arterial chemotherapy for retinoblastoma. Eur J Ophthalmol. 2013;24:449–453. doi: 10.5301/ejo.5000393. [DOI] [PubMed] [Google Scholar]
- 7.Vezina C, Kudelski A, Sehgal SN. Rapamycin (AY-22,989), a new antifungal antibiotic. I. Taxonomy of the producing streptomycete and isolation of the active principle. J Antibiot (Tokyo) 1975;28:721–726. doi: 10.7164/antibiotics.28.721. [DOI] [PubMed] [Google Scholar]
- 8.Singh K, Sun S, Vezina C. Rapamycin (AY-22,989), a new antifungal antibiotic. IV. Mechanism of action. J Antibiot (Tokyo) 1979;32:630–645. doi: 10.7164/antibiotics.32.630. [DOI] [PubMed] [Google Scholar]
- 9.Chen S, Liu D, Wu J, Xu B, Lu K, Zhu W, Chen M. Effect of inhibiting the signal of Mammalian target of rapamycin on memory T cells. Transplant Proc. 2014;46:1642–1648. doi: 10.1016/j.transproceed.2013.10.063. [DOI] [PubMed] [Google Scholar]
- 10.Milani BY, Milani FY, Park DW, Namavari A, Shah J, Amirjamshidi H, Ying H, Djalilian AR. Rapamycin inhibits the production of myofibroblasts and reduces corneal scarring after photorefractive keratectomy. Invest Ophthalmol Vis Sci. 2013;54:7424–7430. doi: 10.1167/iovs.13-12674. [DOI] [PMC free article] [PubMed] [Google Scholar]
- 11.Gibbons JJ, Abraham RT, Yu K. Mammalian target of rapamycin: discovery of rapamycin reveals a signaling pathway important for normal and cancer cell growth. Semin Oncol. 2009;36(Suppl 3):S3–S17. doi: 10.1053/j.seminoncol.2009.10.011. [DOI] [PubMed] [Google Scholar]
- 12.Ocana A, Vera-Badillo F, Al-Mubarak M, Templeton AJ, Corrales-Sanchez V, Diez-Gonzalez L, Cuenca-Lopez MD, Seruga B, Pandiella A, Amir E. Activation of the PI3K/mTOR/AKT pathway and survival in solid tumors: systematic review and meta-analysis. PLoS One. 2014;9:e95219. doi: 10.1371/journal.pone.0095219. [DOI] [PMC free article] [PubMed] [Google Scholar]
- 13.Tao LY, Li JY, Zhang JY. Brazilein, a compound isolated from Caesalpinia sappan Linn. , induced growth inhibition in breast cancer cells via involvement of GSK-3beta/beta-Catenin/cyclin D1 pathway. Chem Biol Interact. 2013;206:1–5. doi: 10.1016/j.cbi.2013.07.015. [DOI] [PubMed] [Google Scholar]
- 14.Ng VC, Johnson JJ, Cuellar S. Targeting the mammalian target of rapamycin pathway with everolimus: Implications for the management of metastatic breast cancer. J Oncol Pharm Pract. 2014 doi: 10.1177/1078155214540732. [Epub ahead of print] [DOI] [PubMed] [Google Scholar]
- 15.Oka K, Ohya-Shimada W, Mizuno S, Nakamura T. Up-regulation of cyclin-E (1) via proline-mTOR pathway is responsible for HGF-mediated G (1)/S progression in the primary culture of rat hepatocytes. Biochem Biophys Res Commun. 2013;435:120–125. doi: 10.1016/j.bbrc.2013.04.052. [DOI] [PubMed] [Google Scholar]
- 16.Zou ZQ, Zhang XH, Wang F, Shen QJ, Xu J, Zhang LN, Xing WH, Zhuo RJ, Li D. A novel dual PI3Kalpha/mTOR inhibitor PI-103 with high antitumor activity in non-small cell lung cancer cells. Int J Mol Med. 2009;24:97–101. doi: 10.3892/ijmm_00000212. [DOI] [PubMed] [Google Scholar]
- 17.Mao L, Ding J, Perdue A, Yang L, Zha Y, Ren M, Huang S, Cui H, Ding HF. Cyclin E1 is a common target of BMI1 and MYCN and a prognostic marker for neuroblastoma progression. Oncogene. 2012;31:3785–3795. doi: 10.1038/onc.2011.536. [DOI] [PMC free article] [PubMed] [Google Scholar]
- 18.Luo Y, Li L, Zou P, Wang J, Shao L, Zhou D, Liu L. Rapamycin enhances long-term hematopoietic reconstitution of ex vivo expanded mouse hematopoietic stem cells by inhibiting senescence. Transplantation. 2014;97:20–29. doi: 10.1097/TP.0b013e3182a7fcf8. [DOI] [PMC free article] [PubMed] [Google Scholar]
- 19.Jabbour P, Chalouhi N, Tjoumakaris S, Gonzalez LF, Dumont AS, Chitale R, Rosenwasser R, Bianciotto CG, Shields C. Pearls and pitfalls of intraarterial chemotherapy for retinoblastoma. J Neurosurg Pediatr. 2012;10:175–181. doi: 10.3171/2012.5.PEDS1277. [DOI] [PubMed] [Google Scholar]
- 20.Shields CL, Mashayekhi A, Au AK, Czyz C, Leahey A, Meadows AT, Shields JA. The International Classification of Retinoblastoma predicts chemoreduction success. Ophthalmology. 2006;113:2276–2280. doi: 10.1016/j.ophtha.2006.06.018. [DOI] [PubMed] [Google Scholar]
- 21.Wang J, Wang X, Li Z, Liu H, Teng Y. MicroRNA-183 suppresses retinoblastoma cell growth, invasion and migration by targeting LRP6. Febs J. 2014;281:1355–1365. doi: 10.1111/febs.12659. [DOI] [PubMed] [Google Scholar]
- 22.Cornu M, Albert V, Hall MN. mTOR in aging, metabolism, and cancer. Curr Opin Genet Dev. 2013;23:53–62. doi: 10.1016/j.gde.2012.12.005. [DOI] [PubMed] [Google Scholar]
- 23.Brown EJ, Albers MW, Shin TB, Ichikawa K, Keith CT, Lane WS, Schreiber SL. A mammalian protein targeted by G1-arresting rapamycin-receptor complex. Nature. 1994;369:756–758. doi: 10.1038/369756a0. [DOI] [PubMed] [Google Scholar]
- 24.Laplante M, Sabatini DM. mTOR signaling in growth control and disease. Cell. 2012;149:274–293. doi: 10.1016/j.cell.2012.03.017. [DOI] [PMC free article] [PubMed] [Google Scholar]
- 25.Koff A, Cross F, Fisher A, Schumacher J, Leguellec K, Philippe M, Roberts JM. Human cyclin E, a new cyclin that interacts with two members of the CDC2 gene family. Cell. 1991;66:1217–1228. doi: 10.1016/0092-8674(91)90044-y. [DOI] [PubMed] [Google Scholar]
- 26.Hu W, Nevzorova YA, Haas U, Moro N, Sicinski P, Geng Y, Barbacid M, Trautwein C, Liedtke C. Concurrent deletion of cyclin E1 and cyclin-dependent kinase 2 in hepatocytes inhibits DNA replication and liver regeneration in mice. Hepatology. 2014;59:651–660. doi: 10.1002/hep.26584. [DOI] [PMC free article] [PubMed] [Google Scholar]
- 27.Ryu JM, Lee MY, Yun SP, Han HJ. High glucose regulates cyclin D1/E of human mesenchymal stem cells through TGF-beta1 expression via Ca2+/PKC/MAPKs and PI3K/Akt/mTOR signal pathways. J Cell Physiol. 2010;224:59–70. doi: 10.1002/jcp.22091. [DOI] [PubMed] [Google Scholar]
- 28.Benetatos L, Vartholomatos G, Hatzimichael E. Polycomb group proteins and MYC: the cancer connection. Cell Mol Life Sci. 2014;71:257–269. doi: 10.1007/s00018-013-1426-x. [DOI] [PMC free article] [PubMed] [Google Scholar]
- 29.Huang R, Cheung NK, Vider J, Cheung IY, Gerald WL, Tickoo SK, Holland EC, Blasberg RG. MYCN and MYC regulate tumor proliferation and tumorigenesis directly through BMI1 in human neuroblastomas. Faseb J. 2011;25:4138–4149. doi: 10.1096/fj.11-185033. [DOI] [PMC free article] [PubMed] [Google Scholar]
- 30.Siddique HR, Saleem M. Role of BMI1, a stem cell factor, in cancer recurrence and chemoresistance: preclinical and clinical evidences. Stem Cells. 2012;30:372–378. doi: 10.1002/stem.1035. [DOI] [PubMed] [Google Scholar]
- 31.Wu J, Hu D, Yang G, Zhou J, Yang C, Gao Y, Zhu Z. Down-regulation of BMI-1 cooperates with artemisinin on growth inhibition of nasopharyngeal carcinoma cells. J Cell Biochem. 2011;112:1938–1948. doi: 10.1002/jcb.23114. [DOI] [PubMed] [Google Scholar]


