

Abstract
Objective: This study was designed to investigate the effects of metformin on bile acid in type 2 diabetes mellitus (T2DM). Methods: In this study, we constructed a model of T2DM by a combination of high-fat diet (HFD) and low dose of streptozotocin (STZ) intraperitoneal injection. Blood samples by tail vein and eye angular vein were withdrawn before (time 0) and 30, 60, and 120 minutes after administration of glucose before STZ injection and once a week after diabetes induction, and were analyzed to evaluate the level of the fasting blood glucose and fasting insulin using glucometer. Triglyceride, low density lipoprotein cholesterin, high density lipoprotein cholesterin were detected by automatic biochemical analyzers. Total cholesterol and total bile acid (TBA) were analyzed using ELISA kits. Results: Before STZ injection, the TBA level in HFD group was significantly higher relative to that in standard diet (SD) group and there was a moderate reduction of the TBA level in early intervention (EI) group 6 week after metformin administration comparing with that in HFD group but was still higher than that of SD group. However, after STZ injection, the TBA level was significantly higher in DM rats relative to that in normal control (NC) rats and the TBA level in late intervention (LI) (19.92 μmol/L) and EI rats (42.97 μmol/L) with metformin administration was significantly higher comparing with that in DM rats. Conclusion: The effects of metformin in plasma glucose and lipid metabolism might be associated with bile acid metabolism.
Keywords: Type 2 diabetes mellitus, streptozotocin, metformin, total bile acid
Introduction
Type 2 diabetes mellitus (T2DM) is a heterogeneous disease characterized by varying degrees of impaired insulin secretion and insulin resistance, and both features are progressive [1]. The incidence of T2DM and the cost to the care continue to rise [2]. In addition, poor management can cause some systemic complications, such as diabetic neuropathy, diabetic retinopathy, and diabetic nephropathy [3,4]. The diagnosis is often delayed till complications are exhibited [5]. Despite more extensive effort in T2DM, the mechanisms are not completely illuminated. Thus, it is particularly relevant to the clinical and research communities today.
To study T2DM, animal models are very important. Despite there are many animal models (spontaneous and induced) for the study of T2DM, in most of them, the pattern of disease initiation and progression do not appear to be highly analogous to the clinical manifestation in humans. Moreover, the animals require relatively high dose of streptozotocin (STZ; > 50 mg/kg) to induce diabetic models, but the development of hyperglycemia following STZ injection is primarily due to the direct pancreatic B cell destruction, and resulting in insulin deficiency rather than insulin resistance [6]. Thus, we developed a suitable T2DM model that would closely mimic the history of the disease (from insulin resistance to B cell dysfunction) as well as metabolic characteristics of human T2DM. The model of T2DM was established by a combination of high-fat diet (HFD) which induced insulin resistance and low dose of STZ intraperitoneal injection which caused the initial B cell dysfunction as well as subsequently the hyperglycemia in Wistar rats.
DM is a multifactorial disease and thus various strategies have been applied to affect its progression. Multiple pathways are targeted by therapeutic interventions currently [7]. One pathway is associated with bile acid metabolism [8]. Several studies exhibits that manipulating the bile acid metabolism with bile acid sequestrants (BSA) might improve glucose control in patients with T2DM [9,10]. Recent years, metformin is regarded as an ideal first medication for management of T2DM [11,12] by enhancing tissue sensitivity to insulin but suppressing hepatic glucose production, reducing insulin levels, and improving peripheral glucose uptake [13,14]. Additionally, it has been demonstrated to prevent or delay the onset of T2DM in patients with pre-diabetes [15,16]. Moreover, the UK prospective Diabetes Study has demonstrated that metformin monotherapy results in the reduction in DM-related mortality rate and the overall mortality rate relative to insulin therapy, sulfonylurea treatment, or diet control alone [17]. However, small studies have demonstrated whether hypoglycemic effect of metformin is associated with bile acid metabolism.
Therefore, we initiated to establish a model of T2DM by a combination of HFD and low dose of STZ intraperitoneal injection. Metformin was applied at the beginning and after model successfully established to explore the role and the mechanism of metformin and the parameters such as bile acid and lipid metabolism.
Materials and methods
Materials and reagents
STZ was purchased from Sigma-Aldrich (Art. No. SO-130). ELISA kit was purchased from Mercodia (Art. No. 10-1250-01). Hitachi 7180 automatic biochemical analyzers (Hitachi, Tokyo, Japan), glucometer and test strips (Roche, Switzerland), metformin (Bristol-Myers Squibb, Shanghai).
Animals
A total of 100 adult male Wistar rats, weighing 200-250 g, were provided by Experiment Animal Center of Shandong University. They were housed in a room with a 12/12-hour light/dark cycle, an ambient temperature of 22 ± 2°C and relative humidity of 55 ± 5%. All procedures in this study were carried out under the guide for the care and use of laboratory animals. Animal ethical license for this study was granted by the Ethical Committee of the School of Medicine, Shandong University. Moreover, all efforts were made to minimize the rats’ suffering in the experiments.
Animal model induction
One hundred Wistar rats were randomly divided into three groups: standard diet (SD) group (n = 20), high-fat diet (HFD) group (n = 20) and early intervention (EI) group (n = 60). For SD group, rats were fed with a standard diet (6% fat, 23% protein and 64% carbohydrate). For HFD group, rats were fed with a HFD (25% fat, 20% protein and 48% carbohydrate). For EI group, rats were fed with a HFD and received 500 mg/kg body weight metformin by gavage once a day. Two rats died in HFD group and EI group, respectively. After 6 weeks on either diet, 20 rats in SD group and 20 rats in HFD group were intraperitoneally injected with sodium citrate buffer (0.1 mmol/L) to be as insulin resistance (IR) group and normal control (NC), respectively. Simultaneously, the remaining 18 rats in EI group and 38 rats in HFD group were fasted overnight and streptozotocin (STZ) dissolved in 0.1 mmol/L sodium citrate buffer was injected (35 mg/kg) intraperitoneally to induce DM. Three days after sodium citrate buffer or STZ injection, the fasting blood glucose (FBG) level was measured by a glucometer, and mental condition, fur color, food intake and water intake were measured. The FBG ≥ 11.1 mmol/L was regarded as successful induction of diabetes and selected for further pharmacological studies.
Then, the rats in EI group after STZ injection received 500 mg/kg body weight metformin by gavage once a day. Sixteen rats selected randomly from HFD group after STZ injection received 500 mg/kg body weight metformin by gavage once a day as late intervention (LI) group. The rest 16 rats in HFD group after STZ injection received no treatment as DM control group.
Sample processing
To assess glucose tolerance, animals were fasted 12 h and their serum glucose response to the administration (by gavage) a solution of 50% glucose (2.5 g/kg) was determined 6 weeks after the early intervention of metformin and 4 weeks after the late intervention of metformin, respectively. Blood samples by tail vein and eye angular vein were withdrawn before (time 0) and 30, 60, and 120 minutes after administration of glucose before STZ injection and once a week after the induction of diabetes. Animals were anesthetized with diethyl ether for this procedure.
Glucose tolerance test (OGTT)
FBG was detected with glucometer. Tail blood samples were analyzed to evaluate the level of the FBG and fasting insulin (FINS). The area under the curve (AUC) of glucose and insulin concentrations was determined respectively.
The detection of blood lipid and bile acid
Blood samples by eye angular vein (2 ml) were analyzed to evaluate the levels of parameters of blood lipid such as triglyceride (TG), total cholesterol (TC), low density lipoprotein cholesterin (LDL-C), high density lipoprotein cholesterin (HDL-C) and total bile acid (TBA). TG, LDL-C and HDL-C were detected using Hitachi 7180 automatic biochemical analyzers. TC and TBA were detected with ELISA kits. Insulin resistance index was calculated by the following formula:
The steady - state model of insulin resistance index (HOMA IR) = FINS × FBG/22.5
Statistical analysis
All data were obtained from at least three independent experiments and were expressed as means ± standard deviation (SD). The comparisons between two groups were analyzed by independent sample t-test. Multiple comparisons were analyzed by one-way ANOVA. P < 0.05 was considered statistically significant. All statistical analyses were performed with SPSS18.0.
Results
Characteristic s of HFD-fed insulin-resistant rats
Table 1 shows that the feeding of HFD for 6 weeks resulted in a significant increase in body weight, TC, LDL-C and FINS (P < 0.05) as well as in FBG, AUC of glucose (P < 0.01) but a reduction in the ratio of AUC of insulin and AUC of glucose along with a significant increase in TBA (P < 0.05) relative to SD group. In addition, the rats in EI group showed a significant increase in FBG (P < 0.05), AUC of glucose (P < 0.01) compared to SD group. Moreover, comparing to HFD group, the rats in EI group exhibited a significant decrease in body weight, AUC of insulin (P < 0.01) and AUC of glucose (P < 0.05) but a small but statistically significant increase in LDL-C (P < 0.05), a moderate increase the ratio of AUC of insulin and AUC of glucose along with a moderate reduction in TBA (higher than that of SD group) (Table 1). Figures 1 and 2 demonstrated the AUC of the glucose and insulin respectively.
Table 1.
Effect of HFD and metformin on body weight and biochemical parameters in rats
| Parameters | SD group | HFD group | EI group |
|---|---|---|---|
| Body Weight (g) | 367.13±20.41 | 430.92±31.49a | 358.09±18.97b |
| FBG (mmol/L) | 4.29±0.77 | 5.48±0.95aa | 5.12±0.97a |
| TG (mmol/L) | 0.63±0.10 | 0.97±0.51 | 0.75±0.24 |
| TC (mmol/L) | 1.52±0.13 | 2.08±0.16a | 1.95±0.09 |
| HDLC (mmol/L) | 1.19±0.14 | 1.26±0.12 | 1.35±0.16 |
| LDLC (mmol/L) | 0.20±0.07 | 0.51±0.07a | 0.37±0.05b |
| TBA (μmol/L) | 8.31±1.24 | 11.78±1.36a | 10.12±1.19 |
| FINS (mIU/L) | 9.38±1.86 | 13.84±3.20a | 8.38±2.09 |
| AUC (glucose) | 24.18±3.45 | 47.92±6.93aa | 33.85±2.02aa,bb |
| AUC (insulin) | 54.32±6.06 | 58.39±9.10 | 45.16±12.75b |
| AUC (insulin)/AUC (glucose) | 2.25±0.03 | 1.22±0.01 | 1.34±0.01 |
Values are means ± SD; the abbreviations denote FBG: fasting blood glucose, TG: triglyceride; TC: total cholesterol; LDL-C: low density lipoprotein cholesterin; HDL-C: high density lipoprotein cholesterin; TBA: total bile acid; FINS: fasting insulin; AUC (glucose): the area under the curve of glucose; AUC (insulin): the area under the curve of insulin, and AUC (insulin)/AUC; (glucose): the ratio of AUC of insulin and AUC of glucose.
P < 0.05 vs. SD group;
P < 0.01 vs. SD group;
P < 0.05 vs. HFD group;
P < 0.01 vs. HFD group.
Figure 1.
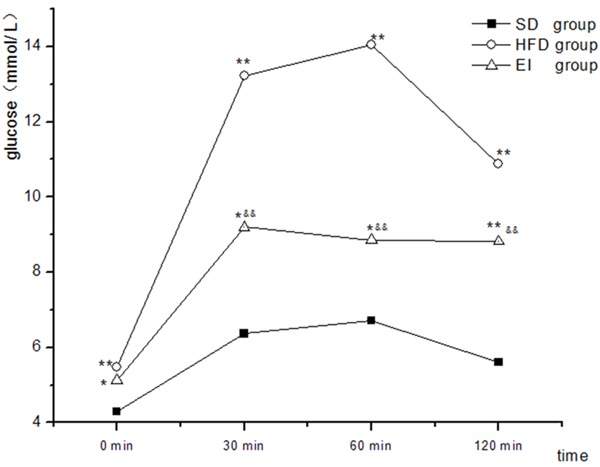
Changes in glucose levels during oral glucose tolerance test. *P < 0.05 vs. SD group, **P < 0.01 vs. SD group, &&P < 0.01 vs. HFD group.
Figure 2.
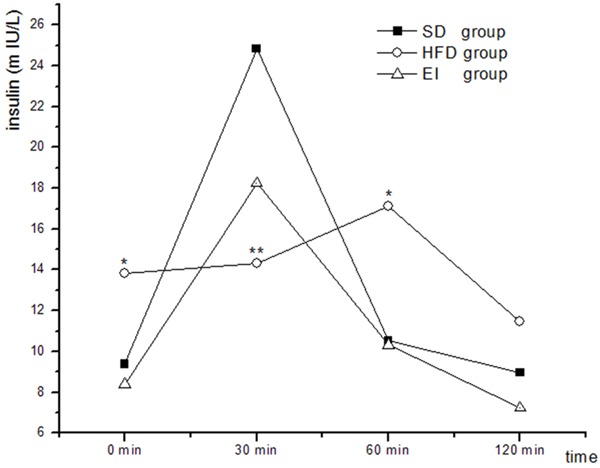
Changes in insulin levels during oral glucose tolerance test. *P < 0.05 vs. SD group, **P < 0.01 vs. SD group.
The stability of the DM model
Three days after the injection of STZ or sodium citrate buffer, The FBG level ≥ 11.1 mmol/L in each group was regarded as the standard of the blood glucose of diabetes. During the experiment, the FBG fluctuated in NC and IR groups in the level of 5 mmol/L. The FBG level in DM group remained a tendency of 11.1 mmol/L. The FBG in EI and LI groups declined steadily. At the end of the experiment, the FBG in EI and NC groups were close, but the level was slightly higher in LI group than that of EI group.
General features of rats in each group
The general features of rats in each group were shown in Figure 3. The rats in NC group were in good condition. The volume of drinking water and urine had no obvious change. Fur color and gloss were good. Moreover, dietary intake and body weight were increased steadily within a narrow range. In addition, dietary intake and weight of rats in IR group increased quickly and the fur color and gloss were slightly less. However, the rats in DM group were depressed and sluggish generally, and there appeared some symptoms such as polyphagia, polydipsia, urorrhagia loose stools, and weight loss coupled with the mixed and disorderly fur. Mental condition, fur color, food intake, drinking water intake and body weight of rats in EI and LI groups were improved to a certain extent.
Figure 3.
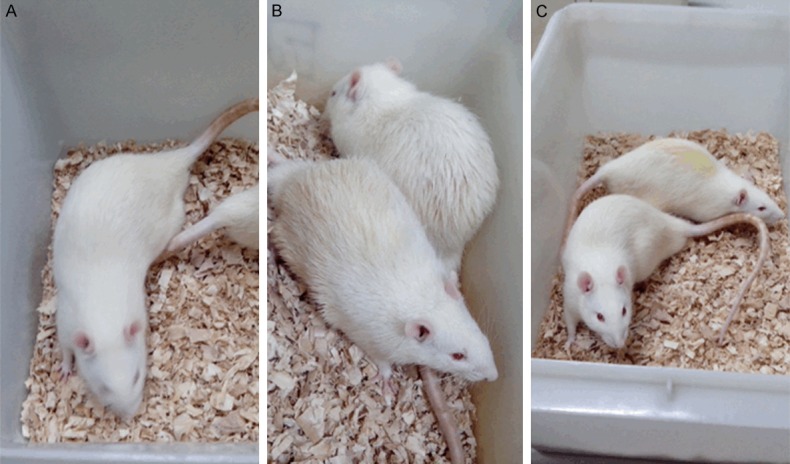
The general features of rats in each group. The mental condition, fur color and gloss of rats in normal control group (A) were good. The rats in diabetes mellitus group (B) were depressed and sluggish generally, and there appeared the mixed and disorderly fur. Mental condition and fur color of rats in metformin treated group (C) were improved to a certain extent.
Changes in metabolic parameters of fat-fed/STZ-diabetic rats treated with metformin
Table 2 exhibited the changes of biochemical parameters in different experimental groups. Comparing to NC group, the rats in DM group showed apparent metabolic disorders. There was a marked increase in FBG, TC, LDL-C, TBA and TG but a reduction of body weight (P < 0.05). The symbols of metabolic disorders of rats in EI and LI groups were improved relative to that of DM group. There was a reduction in FBG (57.8%, 20.3%), TC (58.2%, 20.3%), LDL-C (71.4%, 20.5%), TG (27.4%, 17.9%), and weight loss was improved. It is noted that there was a significant difference of TBA in each group. The mean TBA values in NC, DM, EI and LI groups were 9.83, 14.81, 42.97, 19.92 μmol/L respectively (Table 2).
Table 2.
Effect of metformin on body weight and biochemical parameters in rats
| parameters | NC group | IR group | DM group | EI group | LI group |
|---|---|---|---|---|---|
| Body Weight (g) | 482.53±35.74 | 565.12±42.31*,# | 412.85±37.71* | 489.1±42.35# | 463.61±66.40 |
| FBG (mmol/L) | 3.66±1.10 | 4.57±2.01# | 12.78±4.64* | 5.41±1.82# | 10.19±2.75*,# |
| TG (mmol/L) | 0.75±0.44 | 0.81±0.35 | 2.12±1.07* | 1.54±0.98*,# | 1.74±1.09* |
| TC (mmol/L) | 1.12±0.45 | 1.64±0.82 | 6.48±2.93* | 2.71±0.93*,# | 5.39±1.61* |
| HDL-C (mmol/L) | 0.75±0.29 | 0.71±0.34 | 1.19±0.23* | 0.99±0.17 | 1.05±0.41* |
| LDL-C (mmol/L) | 0.31±0.17 | 0.64±0.23 | 3.96±1.18* | 1.13±0.56*,# | 3.15±0.63* |
| TBA (μmol/L) | 9.83±1.96 | 10.46±2.35 | 14.81±3.51* | 42.97±11.23*,# | 19.92±5.18*,# |
Values are means ± SD.
P < 0.05 vs. NC group;
P < 0.05 vs. DM group.
Discussion
DM is a chronic and progressive metabolic disease and its incidence is increasing around the world. This study was aimed to investigate the effects of metformin on bile acid and explore the mechanisms of metformin for the glucose-lowering effect. We have demonstrated that metformin has effects on bile acid metabolism, FBG, TC, LDL-C, FINS and TAB in T2DM rats.
Compensatory hyperinsulinemia and insulin resistance are indicators to predict the development of T2DM [18,19]. Accumulating evidence has demonstrated that the rats fed with HFD develop obesity, hyperinsulinemia, and insulin resistance [6,20]. Our results were in accordance with previous studies. In the current study, the levels of FINS, FBG, AUC (glucose) in HFD-fed rats was significantly higher than that in SD-fed rats as shown in Table 1. In addition to the insulin resistance, a decline in the secretory ability of the pancreatic B cell plays a crucial role in the conversion of pre-diabetes to diabetes [18,19]. STZ injection can induce the pancreatic B cell destruction directly [21]. However, the dose of STZ is pivotal to the model of T2DM. Several researches have demonstrated that low dose of STZ (35 mg/kg) was considered to represent the pathophysiological state of T2DM [22]. The results in Table 2 showed that HFD-fed rats had an almost 3.5-fold higher of hyperglycemic after STZ-injection (35 mg/kg) than that in NC animals in this study. Therefore, these results indicate that we are successful in the establishment of T2DM model.
Bile acid is the end-product of the degradation of cholesterol and is the main way of cholesterol clearance [23]. Moreover, Bile acids are able to activate specific receptors such as pregnane X receptor (PXR), farnesoid X receptor (FXR), Vitamin D, and Gαs-protein-coupled surface receptor (TGR-5), and cell signaling pathways including JNK1/2, ERK1/2 and AKT to regulate the glucose metabolism, bile salt and lip id levels [24-26]. In addition, some studies have demonstrated the alteration of the bile acid in T2DM patients and animal models [27,28]. In the current study, before STZ injection, the TBA level in HFD group was significantly higher relative to that in SD group and there was a moderate reduction of the TBA level in EI group 6 week after metformin administration comparing with that in HFD group but was still higher than that of SD group. Our data are in accordance with the previous reports. Carter et al. [29] have exhibited that metformin may inhibit the reabsorption of bile acids through altering the function of bile acid transporter. However, after STZ injection, the TBA level was significantly higher in DM rats relative to that in NC rats and the TBA level in LI (19.92 μmol/L) and EI rats (42.97 μmol/L) with metformin administration was significantly higher comparing with that in DM rats. These results suggested that long-time application of metformin might increase the level of bile acid. This was not in consistent with the results of the comparison between EI and HFD before STZ injection. This difference in the effect of metformin on bile acid before and after STZ injection might be associated with the initiation and duration of metformin application.
In sum, the model of T2DM, initiation and progression closely analogous to the clinical manifestation in humans, is established by a combination of HFD and low dose of STZ intraperitoneal injection. Moreover, we exhibit the pleotropic effects of metformin including alteration of bile acids, modulation of glucose and changes in lipid level. These results suggest that regulatory role of metformin in plasma glucose and lipid metabolism might be associated with bile acid metabolism. However, further studies about the effects of metformin in FXR and signaling pathways will be done in the future work.
Acknowledgements
This work was supported by National Natural Science Foundation of China Grants 81170771, 81101183, 30970989 and 81270175, Science and Technology Development Programme of Shandong Grants 2012GSF11803, International Cooperation Programme of Jinan City Grants 201011008.
Disclosure of conflict of interest
None.
References
- 1.DeFronzo RA, Bonadonna RC, Ferrannini E. Pathogenesis of NIDDM: a balanced overview. Diabetes Care. 1992;15:318–368. doi: 10.2337/diacare.15.3.318. [DOI] [PubMed] [Google Scholar]
- 2.Pawlyk AC, Giacomini KM, McKeon C, Shuldiner AR, Florez JC. Metformin Pharmacogenomics: Current Status and Future Directions. Diabetes. 2014;63:2590–2599. doi: 10.2337/db13-1367. [DOI] [PMC free article] [PubMed] [Google Scholar]
- 3.Gray SP, Cooper ME. Diabetic nephropathy in 2010: Alleviating the burden of diabetic nephropathy. Nat Rev Nephrol. 2011;7:71–73. doi: 10.1038/nrneph.2010.176. [DOI] [PubMed] [Google Scholar]
- 4.Liu HF, Zhang HJ, Hu QX, Liu XY, Wang ZQ, Fan JY, Zhan M, Chen FL. Altered polarization, morphology, and impaired innate immunity germane to resident peritoneal macrophages in mice with long-term type 2 diabetes. Biomed Res Int. 2012;2012:867023. doi: 10.1155/2012/867023. [DOI] [PMC free article] [PubMed] [Google Scholar]
- 5.Harris MI, Eastman RC. Early detection of undiagnosed diabetes mellitus: a US perspective. Diabetes Metab Res Rev. 2000;16:230–236. doi: 10.1002/1520-7560(2000)9999:9999<::aid-dmrr122>3.0.co;2-w. [DOI] [PubMed] [Google Scholar]
- 6.RERUP CC. Drugs producing diabetes through damage of the insulin secreting cells. Pharmacol Rev. 1970;22:485–518. [PubMed] [Google Scholar]
- 7.Krentz AJ, Bailey CJ. Oral antidiabetic agents. Drugs. 2005;65:385–411. doi: 10.2165/00003495-200565030-00005. [DOI] [PubMed] [Google Scholar]
- 8.Houten SM, Watanabe M, Auwerx J. Endocrine functions of bile acids. EMBO J. 2006;25:1419–1425. doi: 10.1038/sj.emboj.7601049. [DOI] [PMC free article] [PubMed] [Google Scholar]
- 9.Kondo K, Kadowaki T. Colestilan monotherapy significantly improves glycaemic control and LDL cholesterol levels in patients with type 2 diabetes: a randomized double-blind placebo-controlled study. Diabetes Obes Metab. 2010;12:246–251. doi: 10.1111/j.1463-1326.2009.01159.x. [DOI] [PubMed] [Google Scholar]
- 10.Zieve FJ, Kalin MF, Schwartz SL, Jones MR, Bailey WL. Results of the glucose-lowering effect of WelChol study (GLOWS): a randomized, double-blind, placebo-controlled pilot study evaluating the effect of colesevelam hydrochloride on glycemic control in subjects with type 2 diabetes. Clin Ther. 2007;29:74–83. doi: 10.1016/j.clinthera.2007.01.003. [DOI] [PubMed] [Google Scholar]
- 11.Association AD. Standards of medical care in diabetes-2014. Diabetes Care. 2014;37:S14–S80. doi: 10.2337/dc14-S014. [DOI] [PubMed] [Google Scholar]
- 12.Holman R. Metformin as first choice in oral diabetes treatment: the UKPDS experience. Journées annuelles de diabétologie de l’Hôtel-Dieu. 2007:13–20. [PubMed] [Google Scholar]
- 13.Hundal RS, Krssak M, Dufour S, Laurent D, Lebon V, Chandramouli V, Inzucchi SE, Sch umann WC, Petersen KF, Landau BR. Mechanism by which metformin reduces glucose production in type 2 diabetes. Diabetes. 2000;49:2063–2069. doi: 10.2337/diabetes.49.12.2063. [DOI] [PMC free article] [PubMed] [Google Scholar]
- 14.Raptis S, Dimitriadis G. Oral hypoglycemic agents: insulin secretagogues, α-glucosidase inhibitors and insulin sensitizers. Exp Clin Endocrinol Diabetes. 2001;109:S265–S287. doi: 10.1055/s-2001-18588. [DOI] [PubMed] [Google Scholar]
- 15.Group DP. Long-term safety, tolerability, and weight loss associated with metformin in the Diabetes Prevention Program Outcomes Study. Diabetes Care. 2012;35:731–737. doi: 10.2337/dc11-1299. [DOI] [PMC free article] [PubMed] [Google Scholar]
- 16.Group DP. 10-year follow-up of diabetes incidence and weight loss in the Diabetes Prevention Program Outcomes Study. Lancet. 2009;374:1677–1686. doi: 10.1016/S0140-6736(09)61457-4. [DOI] [PMC free article] [PubMed] [Google Scholar]
- 17.Effect of intensive blood-glucose control with metformin on complications in overweight patients with type 2 diabetes (UKPDS-34) Lancet. 1998;352:854–865. [PubMed] [Google Scholar]
- 18.Warram JH, Martin BC, Krolewski AS, Soeldner JS, Kahn CR. Slow glucose removal rate and hyperinsulinemia precede the development of type II diabetes in the offspring of diabetic parents. Ann Intern Med. 1990;113:909–915. doi: 10.7326/0003-4819-113-12-909. [DOI] [PubMed] [Google Scholar]
- 19.Lillioja S, Mott DM, Spraul M, Ferraro R, Foley JE, Ravussin E, Knowler WC, Bennett PH, Bogardus C. Insulin resistance and insulin secretory dysfunction as precursors of non-insulin-dependent diabetes mellitus: prospective studies of Pima Indians. N Engl J Med. 1993;329:1988–1992. doi: 10.1056/NEJM199312303292703. [DOI] [PubMed] [Google Scholar]
- 20.Kraegen E. Fat feeding causes widespread in vivo insulin resistance, decreased energy expenditure, and obesity in rats. Am J Physiol. 1986;251:E576–83. doi: 10.1152/ajpendo.1986.251.5.E576. [DOI] [PubMed] [Google Scholar]
- 21.Elsner M, Guldbakke B, Tiedge M, Munday R, Lenzen S. Relative importance of transport and alkylation for pancreatic beta-cell toxicity of streptozotocin. Diabetologia. 2000;43:1528–1533. doi: 10.1007/s001250051564. [DOI] [PubMed] [Google Scholar]
- 22.Srinivasan K, Viswanad B, Asrat L, Kaul C, Ramarao P. Combination of high-fat diet-fed and low-dose streptozotocin-treated rat: a model for type 2 diabetes and pharmacological screening. Mol Nutr Food Res. 2005;52:313–320. doi: 10.1016/j.phrs.2005.05.004. [DOI] [PubMed] [Google Scholar]
- 23.Chen W, Guo JX, Chang P. The effect of taurine on cholesterol metabolism. Mol Nutr Food Res. 2012;56:681–690. doi: 10.1002/mnfr.201100799. [DOI] [PubMed] [Google Scholar]
- 24.Scotti E, Gilardi F, Godio C, Gers E, Krneta J, Mitro N, De Fabiani E, Caruso D, Crestani M. Bile acids and their signaling pathways: eclectic regulators of diverse cellular functions. Cell Mol Life Sci. 2007;64:2477–2491. doi: 10.1007/s00018-007-7280-y. [DOI] [PMC free article] [PubMed] [Google Scholar]
- 25.Lefebvre P, Cariou B, Lien F, Kuipers F, Staels B. Role of bile acids and bile acid receptors in metabolic regulation. Physiol Rev. 2009;89:147–191. doi: 10.1152/physrev.00010.2008. [DOI] [PubMed] [Google Scholar]
- 26.Hylemon PB, Zhou H, Pandak WM, Ren S, Gil G, Dent P. Bile acids as regulatory molecules. J Lipid Res. 2009;50:1509–1520. doi: 10.1194/jlr.R900007-JLR200. [DOI] [PMC free article] [PubMed] [Google Scholar]
- 27.Brufau G, Stellaard F, Prado K, Bloks VW, Jonkers E, Boverhof R, Kuipers F, Murphy EJ. Improved glycemic control with colesevelam treatment in patients with type 2 diabetes is not directly associated with changes in bile acid metabolism. Hepatology. 2010;52:1455–1464. doi: 10.1002/hep.23831. [DOI] [PubMed] [Google Scholar]
- 28.Prawitt J, Caron S, Staels B. Bile acid metabolism and the pathogenesis of type 2 diabetes. Curr Diab Rep. 2011;11:160–166. doi: 10.1007/s11892-011-0187-x. [DOI] [PMC free article] [PubMed] [Google Scholar]
- 29.Tremaroli V, Bäckhed F. Functional interactions between the gut microbiota and host metabolism. Nature. 2012;489:242–249. doi: 10.1038/nature11552. [DOI] [PubMed] [Google Scholar]