

Abstract
Feature-based attention has been shown to enhance the responses of neurons tuned to an attended feature while simultaneously suppressing responses of neurons tuned to unattended features. However, the influence of these suppressive neuronal-level modulations on perception is not well understood. Here, we investigated the perceptual consequences of feature-based attention by having subjects judge which of four random dot patterns (RDPs) contained a motion signal (Experiment 1) or which of four RDPs contained the most salient nonrandom motion signal (Experiment 2). Subjects viewed pre-cues which validly, invalidly, or neutrally cued the direction of the target RDP. Behavioral data were fit using the linear ballistic accumulator (LBA) model; the model design that best described the data revealed that the rate of sensory evidence accumulation (drift rate) was highest on valid trials and systematically decreased until the cued direction and the target direction were orthogonal. These results demonstrate behavioral correlates of both feature-based attentional enhancement and suppression.
Keywords: visual attention, top-down attention, feature-based attention, suppression, enhancement
Introduction
Top-down visual attention is a highly adaptive mechanism that modulates sensory signals in order to facilitate the processing of behaviorally significant stimuli. Attention can be allocated based on prior knowledge of spatial locations (spatial attention) or of a target defining feature (feature-based attention). Numerous studies demonstrate that spatial attention improves behavioral performance on a wide array of tasks (Posner, 1980; Carrasco, 2011) and that these improvements in performance are accompanied by corresponding increases in the gain of sensory neurons that have a receptive field at the attended location (McAdams & Maunsell, 1999; Reynolds, Chelazzi, & Desimone, 1999; Reynolds, Pasternak, & Desimone, 2000; Williford & Maunsell, 2006; Reynolds & Heeger, 2009). In contrast, feature-based attention enhances the gain of neurons that are tuned to an attended feature and suppresses the gain of neurons that are tuned away from the attended feature (Cohen & Maunsell, 2011; Khayat, Neibergall, & Martinez-Trujillo, 2010; Martinez-Trujillo & Treue, 2004; Scolari, Byers, & Serences, 2012; Treue & Martinez-Trujillo, 1999).
Consistent with neurophysiology data, previous psychophysical studies suggest that feature-based attention selectively increases sensitivity to relevant visual features in a variety of perceptual tasks (Baldassi & Verghese, 2005; Busse, Katzner, Tillmann, & Treue, 2008; Felisberti & Zanker, 2005; Ling, Liu, & Carrasco, 2009; Liu & Hou, 2011; Liu, Stevens, & Carrasco, 2007; Sàenz, Buraĉas, & Boynton, 2003). However, the behavioral correlates of feature-based attentional suppression are less clear. One recent study suggests that feature-based attention suppresses neurons tuned away from an attended feature, consistent with evidence from single-unit recording (Ling et al., 2009), while another study reported only an enhancement of an attended feature value without concurrent suppression of dissimilar features (White & Carrasco, 2011). However, neither study systematically varied the relationship between the target stimulus and the focus of feature-based attention, so the consequence of attentional suppression on the efficiency of processing unattended features was not directly evaluated.
In the present study, we employed a cueing paradigm to investigate both the facilitatory and suppressive effects of top-down feature-based attention on visual processing using a paradigm in which feature-based attention had to be deployed to stimuli that were distributed across the entire visual field. Using a quantitative model of perceptual decision making—the linear ballistic accumulator ([LBA]; Brown & Heathcote, 2008)—we show that the rate of sensory evidence accumulation is highest for an attended feature and suppressed for stimulus directions rotated away from the attended direction. These findings provide behavioral evidence that feature-based attention can give rise to both improvements and impairments in perceptual processing.
Experiment 1
Methods
Subjects
Eleven right-handed subjects (five females) were recruited from the University of California, San Diego (UCSD, La Jolla, CA) community. All had normal or corrected-to-normal vision. Each subject gave written informed consent in line with the guidelines of the local Institutional Review Board at UCSD and the Declaration of Helsinki and completed two 1–1.5 hr sessions in a climate- and noise-controlled subject room. Compensation for participation was $10.00/hr for the experiment. Data from three subjects were discarded due to subjects' failure to return for the second session of the experiment (thus, data from eight subjects were analyzed).
Stimuli and task
Subjects viewed the stimuli in a darkened room on a CRT monitor (MultiSync FP2141 [NEC Display Solutions, Itasca, IL], refresh rate 85Hz) that was controlled by a PC running Windows XP. The luminance output of the monitor was measured with a Minolta LS-110 photometer (Konica Minolta, Ramsey, NJ) and linearized in the stimulus presentation software. Subjects viewed the screen from a distance of approximately 60 cm. Visual stimuli were generated using the Psychophysics Toolbox stimulus presentation software (version 3; Brainard, 1997; Pelli, 1997) for Matlab (version 7.8.0; Mathworks, Natick, MA).
Subjects were presented with four random dot patterns (RDPs). One RDP was presented in each quadrant of the screen and centered 7.82° from the horizontal midline and 6.98° from the vertical midline (see Figure 1). Each RDP was composed of small dots (0.15° × 0.15°) confined within a circular aperture 8° in diameter. Each dot was presented for a limited lifetime of 100 ms and moved at a speed of 5°/s. Dots that reached the edge of the aperture were moved to the opposite side of the aperture and redrawn. The target RDP contained 100% coherent motion (all dots moved in the same direction), while the distractors contained 0% coherent motion (the direction of each dot was drawn from a uniform distribution). Subjects had to indicate which RDP contained coherent motion using one of four keys on the number pad that corresponded to the spatial position of each of the four stimulus locations. At the beginning of each trial there was either a valid cue (50% of the trials) that correctly indicated the impending direction of the target stimulus, an invalid cue (25% of the trials) that incorrectly indicated the impending direction of the target stimulus, or a neutral cue (25% of the trials) that gave no indication of the impending target direction (Figure 1). Invalid cues indicated directions that were offset from the target direction by ±30° to ±180° in 30° steps, where the order of presentation was determined pseudorandomly on each trial with the constraint that all offsets were equally represented. All cues were presented centrally for 1000 ms and were followed by a 1000 ms presentation of the four RDPs. Subjects were instructed to keep their eyes at fixation throughout the trial and were allowed to make a response any time after the onset of the stimulus array; each trial was self-paced and terminated once subjects provided a response. All subjects were encouraged to respond as quickly and as accurately as possible. Each block contained 48 trials in total, and the experiment consisted of 20 blocks. Subjects typically completed four to eight blocks on the first day of the experiment (in addition to training, see below) and then returned a second day to complete the remaining blocks. Subjects were allowed to rest between blocks if they chose to do so, and all analyzed data came from subjects who completed all 20 blocks.
Figure 1.

Behavioral paradigm for Experiment 1. At the beginning of each trial there was either a valid cue (50% of the trials) correctly indicating the impending target direction of motion, an invalid cue (25% of the trials) incorrectly indicating the impending target direction of motion, or a neutral cue (25% of the trials) that contained no directional information whatsoever. Invalid cues indicated directions that were offset from the direction of motion of the target RDP anywhere from ±30° to ±180° on a trial by trial basis (determined pseudorandomly within a given block of trials). All cues were presented centrally for 1000 ms and were followed by 1000 ms of the four RDPs. Note: Cues in the first panel are exaggerated in size for the purposes of clarity.
All participants were trained for a minimum of 160 trials immediately prior to the main experiment. All cues in the training session were neutral and provided no directional information. In order to equate performance and to ensure that subjects were not at ceiling, a staircasing procedure implemented in Psychtoolbox (QUEST, Watson and Pelli, 1983) was run to estimate the contrast threshold of the stimuli at which each individual could perform the task with approximately 75% accuracy. The contrast value estimated for each subject was then fixed for the remaining blocks for the main experiment. The mean contrast level ± SEM across eight subjects was 1.65% ± 0.05%.
Linear ballistic accumulator model
The LBA model frames every decision as a race between N independent accumulators that correspond to each possible choice alternative, where N = 4 in our experiments (see Figure 2 for a schematic of the model and Brown & Heathcote, 2008 for more details). The first accumulator to reach the response threshold (or b) determines the response choice and the response time. For every trial, each accumulator begins with a random activation level (the starting point, or k) that is independently drawn from a uniform distribution on (0, A). The starting points vary from trial to trial and from accumulator to accumulator, but the height of the distribution (A) was fixed for each of the four accumulators. Since “response caution” is defined as the distance between the response threshold and the starting point, we hereon use the response threshold parameter to represent “response caution,” since the maximum of the starting point distribution here was fixed (in other situations where A is allowed to vary freely, response caution is sometimes defined as the response threshold minus the height of the starting point distribution; see Wolfe & Van Wert, 2010 for an example, although in that paper, response caution is referred to as “decision criterion”). During decision making, activity in each accumulator increases linearly and a response is deployed as soon as an accumulator crosses the response threshold. The predicted response time is thus the time taken to reach the threshold, in addition to a constant offset time (nondecision time or t0). The stimulus display drives the rate at which sensory evidence is gathered for each accumulator (drift rate, or d). These drift rates vary from trial to trial according to independent normal distributions (with the standard deviation, s, of these distributions being arbitrarily fixed at 1), with means v1, v2, … , vN for the N different response accumulators. The drift rate parameter estimated by the LBA model is thus the mean of this drift rate distribution, which reflects the quality of sensory information in favor of that particular response. For instance, if the upper right RDP contains 100% coherent motion while the other RDPs contain 0% coherent motion, there will be a large mean drift rate parameter for the accumulator corresponding to the upper right response, and small mean drift rates for the other three accumulators. All random values (the start points and drift rates) are drawn independently for each accumulator and are independent across decision trials.
Figure 2.
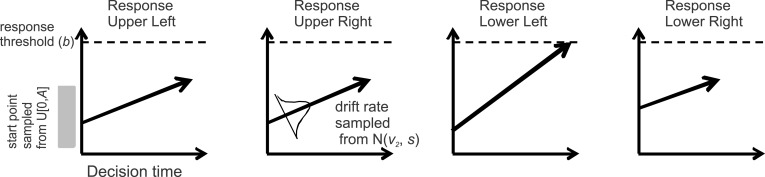
Schematic of the LBA model. The stimulus provides information to four racing accumulators (each corresponding to one of four spatially distinct RDPs); the first accumulator to reach the response threshold determines the response, and thus the decision time. One accumulator corresponds to each possible response, and their average rates of increase (drift rates) are assumed to be determined by the stimulus properties. Response caution determines how much sensory evidence needs to be accumulated before a response is made and captured by the relative distance between the response threshold and the start point. The final response time is the decision processing time (the time taken for the first accumulator to reach the response threshold) plus a constant offset (non decision time).
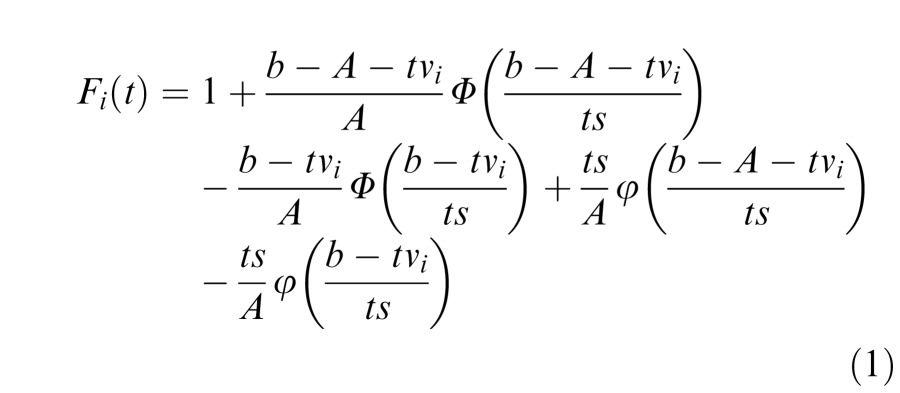
Since the starting point for the evidence accumulator is a random sample from a uniform distribution on (0, A), the amount of evidence that needs to be accumulated to reach the threshold b is a sample from the uniform distribution U(b – A, b), assuming b ≥ A. Since the drift rate for the i-th accumulator is a random draw from N(vi, s), the distribution function for the time taken for the i-th accumulator to reach threshold is the given by the ratio of these two, which has the following cumulative distribution function (CDF) (at time t > 0):
 |
The associated probability density function (PDF) is:
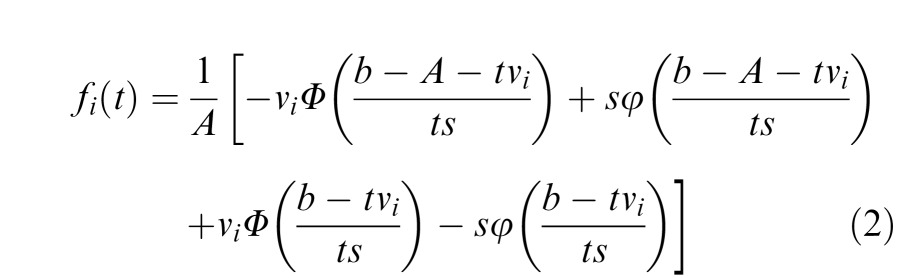 |
Note that lowercase Greek letters in Equations 1 and 2 refer to PDFs, while the uppercase Greek letters refer to CDFs. For more details regarding these equations and their derivations, see Brown and Heathcote (2008).
We used the LBA for several reasons. First, the parameter estimates are jointly constrained by both accuracy and response time (RT) data (for both correct and incorrect responses), as opposed to using only one dependent measure. Second, the joint use of accuracy and RT data allows the LBA to naturally handle any speed-accuracy tradeoffs that may arise in the data. Finally, the LBA (and other similar models) isolate specific aspects of cognitive processing that are influenced by various experimental conditions (as captured by the different parameters in the model). For instance, in our cueing experiment, it could be that the cue influences the rate or quality of information extracted from the stimulus (as captured by the drift rate parameter), how much response caution a participant displays (as captured by the distance between the start point and the response threshold parameter), or it may affect nondecision related processes (as captured by the nondecision time parameter).
To evaluate the plausibility of each of these possible models, we fit eight different versions of the LBA model to the data (using all possible combinations of these three parameters to capture the effects of cueing). The parameters were estimated using the method of maximum likelihood (see Donkin, Brown, Heathcote, & Wagenmakers, 2011 for full details of these methods, as well as an extensive discussion of alternative approaches). Initial parameter values for searches were generated two ways: (1) heuristic calculations based on the data and (2) start points determined from the end points of searches for simpler, nested models. Different mean drift rates were estimated for accumulators corresponding to the correct responses (that is, responses that matched the actual location of the target RDP), and the same single value was estimated for all three accumulators corresponding to incorrect responses (responses that did not match the true location of the target RDP). These correct and incorrect drift rates were then averaged across all four accumulators for each subject, respectively. For the purposes of our experiments, we report only the correct drift rates.
The most parsimonious of the eight models that we evaluated was selected using the Bayesian Information Criterion (BIC), a commonly used criterion that evaluates the tradeoff between model complexity and goodness of fit (Raftery, 1995; Schwarz, 1978):
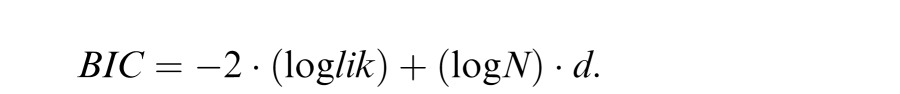 |
where lik = likelihood, N = number of data, and d = number of parameters.
We calculated the group BIC across all subjects for each model design by summing log-likelihoods, sample sizes, and parameter counts. The design with the lowest BIC value was considered the most parsimonious model. We then approximated posterior model probabilities based on the BIC by assuming a fixed effect for subjects. This approach assumed that every subject had an identical structure, such that when we compared model designs (e.g., the model where only drift rate varied versus the model where only response threshold varied), it was assumed that all subjects were described by the same model design. These posterior model probabilities provide support regarding the likelihood of each model design (for more details, see Burnham & Anderson, 2002).
Results
A one-way repeated measures ANOVA revealed a significant effect of cue validity on accuracy (F[7, 49] = 5.140, p = 0.0002; Figure 3a). Mean accuracy rates in the neutral condition were slightly higher than in the invalid condition, but not different from the valid condition (see Figure 3a and first column of Table 1). Most notably, accuracy was lowest when the target was offset by 90° or 120° from the attention cue, after which there was a gradual improvement in accuracy (rebound effect; see Discussion). Consistent with this observation, a one-way repeated measures ANOVA on the accuracy rates for only the invalid trials revealed a significant difference between accuracy levels across the different cue-target offsets (F[5, 35] = 2.8717, p = 0.02).
Figure 3.

(a) Mean accuracy rates across the different cue conditions for Experiment 1. Mean accuracy rates computed across subjects (ordinate) as a function of the eight possible cue conditions (abscissa). (b) Mean response times on correct trials across the different cued conditions for Experiment 1. Mean response times computed across subjects (ordinate) as a function of the eight possible cue conditions (abscissa). Offsets were collapsed across clockwise and counterclockwise directions. All error bars are ±1 SEM, computed after subtracting the mean from each subject.
Table 1.
Pair-wise comparisons of mean accuracy rates, mean response times, and mean drift rates between different cued conditions for Experiment 1 (n = 8). Offsets were collapsed across clockwise and counterclockwise directions. Please refer to Figure 3 and Figure 4. Note: The reported p-values here have been corrected for multiple comparisons using a False Discovery Rate procedure. *p < 0.05, **p < 0.01, ***p < 0.001.
|
Comparison |
Accuracy rate |
Response time |
Drift rate |
| Neutral vs. valid | p = 0.9948 | p = 0.0364* | p = 0.0168* |
| Neutral vs. 30° | p = 0.995 | p = 0.085 | p = 0.9392 |
| Neutral vs. 60° | p = 0.1367 | p = 0.1962 | p = 0.8191 |
| Neutral vs. 90° | p = 0.1003 | p = 0.7059 | p = 0.7433 |
| Neutral vs. 120° | p = 0.1 | p = 0.2545 | p = 0.744 |
| Neutral vs. 150° | p = 0.1699 | p = 0.254 | p = 0.8631 |
| Neutral vs. 180° | p = 0.1 | p = 0.1895 | p = 0.1157 |
| Valid vs. 30° | p = 0.17 | p = 0.25 | p = 0.0566 |
| Valid vs. 60° | p = 0.1005 | p = 0.0847 | p = 0.0642 |
| Valid vs. 90° | p = 0.1168 | p = 0.254 | p = 0.0616 |
| Valid vs. 120° | p = 0.1005 | p = 0.19 | p = 0.062 |
| Valid vs. 150° | p = 0.17 | p = 0.1895 | p = 0.057 |
| Valid vs. 180° | p = 0.101 | p = 0.0770 | p = 0.1814 |
| 30° vs. 60° | p = 0.1862 | p = 0.019 | p = 0.5965 |
| 30° vs. 90° | p = 0.14 | p = 0.3811 | p = 0.3192 |
| 30° vs. 120° | p = 0.1367 | p = 0.1962 | p = 0.345 |
| 30° vs. 150° | p = 0.2625 | p = 0.0196 | p = 0.056 |
| 30° vs. 180° | p = 0.1699 | p = 0.1305 | p = 0.062 |
| 60° vs. 90° | p = 0.2123 | p = 0.784 | p = 0.8635 |
| 60° vs. 120° | p = 0.1368 | p = 0.9225 | p = 0.8651 |
| 60° vs. 150° | p = 0.5676 | p = 0.7840 | p = 0.345 |
| 60° vs. 180° | p = 0.2625 | p = 0.92 | p = 0.0617 |
| 90° vs. 120° | p = 0.3746 | p = 0.7908 | p = 0.9392 |
| 90° vs. 150° | p = 0.995 | p = 0.791 | p = 0.25 |
| 90° vs. 180° | p = 0.4597 | p = 0.784 | p = 0.062 |
| 120° vs. 150° | p = 0.2787 | p = 0.79 | p = 0.249 |
| 120° vs. 180° | p = 0.3084 | p = 0.9667 | p = 0.059 |
| 150° vs. 180° | p = 0.9949 | p = 0.785 | p = 0.056 |
Similarly, RTs varied significantly as a function of cue condition (F[7, 49] = 2.505, p = 0.0278; Figure 3b). RTs were significantly faster on valid trials compared to neutral trials, but RTs on valid and invalid trials were of a similar magnitude (see Figure 3b and second column of Table 1). A one-way repeated measures ANOVA on the RTs for only the invalid trials revealed no significant differences between RTs across the different cue-target offsets (F[5, 35] = 0.7621, p = 0.5832).
The accuracy and RT data present a mixed picture: the accuracy data suggest that attention confers no facilitation for validly cued features, but instead operates primarily by suppressing features dissimilar from the cue. In contrast, the RT data suggest facilitation for the cued feature and little suppression of features dissimilar from the cue. However, there is a speed-accuracy tradeoff occurring: subjects were equally accurate on both valid and neutral trials, but responded significantly faster on valid trials (Figure 3 and first and second columns of Table 1). By using both accuracy and RT data, the LBA model accounts for such tradeoffs and is able to estimate how the cue manipulation selectively influences various latent variables such as the rate of sensory evidence accumulation (drift rate), the amount of information required to make a decision (response threshold), and the time related to nondecisional processes.
Out of the eight tested model designs (where either response caution, drift rate, or nondecision time could stay fixed or vary), the best fitting LBA model—as determined by the BIC—only allowed drift rate to vary between the eight possible cue-target conditions (validly cued targets, neutrally cued targets, and the six possible invalidly cued targets, collapsing across clockwise and counterclockwise offsets). The parameter estimates for response caution and nondecision time for this model were 3.188 and 0.169, respectively (see Figure 4 for the drift rates across the cue conditions). The posterior probability of this model was almost 1, which was more than 1040 times more likely than the next best design, in which both drift rate and nondecision time varied (see Methods for more details). Extremely strong support for one alternative like this is characteristic of group-average analyses like ours since such analyses compare extreme hypotheses (i.e., every subject is better described by one particular model compared to another). To confirm that these analyses did not bias our results, we also calculated posterior model probabilities separately for each individual participant and averaged the resulting probabilities; the model where only drift rate varied still had the greatest average posterior probability.
Figure 4.

Drift rates for the accumulators corresponding to the correct response on the different cue conditions for Experiment 1. Mean drift rates corresponding to the correct response on each trial computed across subjects (ordinate) as a function of the eight possible cue conditions (abscissa). Offsets were collapsed across clockwise and counterclockwise directions. All error bars are ±1 SEM, computed after subtracting the mean from each subject.
Figure 4 shows the drift rates corresponding to the accumulators that matched the correct response (and all subsequent statistics focus on these drift rates as well, see the LBA model section under Methods for more details). A one-way repeated-measures ANOVA revealed a strong effect of cue condition on drift rates (F[7, 49] = 6.793, p < 0.0001), and an individual t-test revealed that drift rates were larger on valid trials compared to neutral trials (Figure 4 and third column of Table 1). In contrast, the drift rates with invalidly cued trials were not significantly different from the drift rates observed on neutrally cued trials (Figure 4 and third column of Table 1). A one-way repeated measures ANOVA on the drift rates associated with just invalidly cued targets revealed a significant difference across the possible offsets (F[5, 35] = 5.092; p = 0.0013). Thus, drift rates on invalid trials did exhibit a pattern that is analogous to the rebound effect observed in the accuracy data: as the offset between the cued direction and target direction increased, the drift rates corresponding to the correct response decreased up until an offset of 90°, after which they began to rise again.
In Experiment 2, we attempted to amplify the suppressive effects of feature-based attention by creating a variant of the behavioral paradigm in which the distractors competed more effectively with the search target.
Experiment 2
Methods
Subjects
Thirteen right-handed subjects (five females) were recruited from the University of California, San Diego (UCSD, La Jolla, CA) community. All had normal or corrected-to-normal vision. Each subject gave written informed consent per Institutional Review Board requirements at UCSD and completed two 1–1.5 hr sessions in a climate- and noise-controlled subject room. Compensation for participation was $10.00/hr for the experiment. Data from 1 subject were discarded due to failure to return for the second testing session, so data from 12 subjects were analyzed.
Stimuli and task
All methods used in Experiment 2 are similar to those used in Experiment 1 unless noted. In Experiment 2, we also used a four alternative forced choice task, but the single target RDP contained 80% coherent motion, while the distractors contained 40% coherent motion (Figure 5). The purpose of this manipulation was to magnify competition between distractors and the target, which we anticipated would lead to larger attentional effects compared to Experiment 1. The direction of each distractor RDP was offset from the target direction by either ±15°, ±45°, ±75°, ±105°, ±135°, or ±165° (pseudorandomly chosen on each trial, with the constraint that each distractor direction was unique). Subjects indicated which RDP contained the high coherence using keys on the number pad to indicate their decision. Invalid cues indicated directions that were offset from the direction of motion of the target RDP anywhere from ±30° to ±180° (in 30° steps) on a trial-by-trial basis. All cues were presented centrally for 1000 ms and the stimulus array was presented for 2000 ms. Subjects were instructed to keep their eyes at fixation throughout the trial and were allowed to make a response any time after the stimulus onset; each trial was self-paced and terminated once subjects provided a response. All subjects were encouraged to respond as quickly and as accurately as possible. Each block contained 48 trials, and in total, the experiment consisted of 20 blocks. Subjects typically completed 4 to 8 blocks on the first day of the experiment (in addition to training) and then returned a second day to complete the remaining blocks. Subjects were allowed to rest between blocks if they chose to do so, and all analyzed data came from subjects who completed all 20 blocks.
Figure 5.

Behavioral paradigm for Experiment 2. At the beginning of each trial there was either a valid cue (50% of the trials) correctly indicating the impending direction of motion, an invalid cue (25% of the trials) incorrectly indicating the impending direction of motion, or a neutral cue (25% of the trials) that contained no directional information whatsoever. Invalid cues indicated directions that were offset from the direction of motion of the target RDP anywhere from ±30° to ±180° on a trial-by-trial basis (determined pseudorandomly within a given block of trials). The target RDP contained 80% motion coherence, while the distractors contained 40% motion coherence, where each distractor direction was offset from the target direction by either ±15°, ±45°, ±75°, ±105°, ±135°, or ±165° (randomly chosen per trial, where each distractor direction was unique) for eight of the subjects or by ±18°, ±36°, or ±72° for the remaining four subjects. Note: Cues in the first panel are exaggerated in size for the purposes of clarity.
We used the same training and staircasing procedures described in Experiment 1 to titrate performance to approximately 75% before data collection in the main task. For the main experiment, the mean contrast level ± SEM across the 12 subjects was 15.21% ± 4.3%.
Results
A one-way repeated measures ANOVA revealed a significant effect of cue-validity on accuracy (F[7, 77] = 19.561, p < 0.0001; Figure 6a). Accuracy was higher on valid trials compared to neutral trials and generally lower on invalid trials compared to neutral trials (Figure 6a and first column of Table 2a). A one-way repeated measures ANOVA for accuracy rates on only the invalid trials also revealed a highly significant difference (F[5, 55] = 11.319, p < 0.0001). Most notably, accuracy was lowest at 90° and 120° (Figure 6a and first column of Table 2a), after which there was a gradual improvement (rebound effect, see Discussion).
Figure 6.

(a) Accuracy rates across the different cue conditions for Experiment 2. Mean accuracy rates computed across subjects (ordinate) as a function of the eight possible cue conditions (abscissa). (b) Mean response times on correct trials across the different cued conditions for Experiment 2. Mean accuracy rates computed across subjects (ordinate) as a function of the eight possible cue conditions (abscissa). (c) Mean proportion of error trials for every offset between the chosen distractor and invalid cue for Experiment 2. Mean proportion of errors as a function of the offset between the direction of the chosen distractor (ordinate) and the invalid cue for that trial (abscissa). Only incorrect trials with invalid cues were used in this analysis. Offsets were collapsed across clockwise and counterclockwise directions. All error bars are ± SEM, computed after subtracting the mean from each subject.
Table 2a.
Pair-wise comparisons of mean accuracy rates, mean response times, and drift rates between different cued conditions for Experiment 2 (n = 12). Offsets were collapsed across clockwise and counterclockwise directions. Please refer to Figures 6a, 6b, and 7. Note: The reported p-values here have been corrected for multiple comparisons using a False Discovery Rate procedure. *p < 0.05, **p < 0.01, ***p < 0.001.
|
Comparison |
Accuracy rate |
Response time |
Drift rate |
| Neutral vs. valid | p = 0.000364*** | p = 0.0021** | p = 0.0056** |
| Neutral vs. 30° | p = 0.3960 | p = 0.5851 | p = 0.0409* |
| Neutral vs. 60° | p = 0.0022** | p = 0.052 | p = 0.0491* |
| Neutral vs. 90° | p = 0.0004*** | p = 0.0491* | p = 0.0409* |
| Neutral vs. 120° | p = 0.00035*** | p = 0.0037** | p = 0.0436* |
| Neutral vs. 150° | p = 0.0019** | p = 0.0031** | p = 0.044* |
| Neutral vs. 180° | p = 0.1656 | p = 0.01* | p = 0.4928 |
| Valid vs. 30° | p = 0.00043*** | p = 0.052 | p = 0.0261* |
| Valid vs. 60° | p = 0.00035*** | p = 0.0018** | p = 0.0325* |
| Valid vs. 90° | p = 0.0003*** | p = 0.01* | p = 0.026* |
| Valid vs. 120° | p = 0.0003*** | p = 0.0019** | p = 0.027* |
| Valid vs. 150° | p = 0.0004*** | p = 0.0037** | p = 0.026* |
| Valid vs. 180° | p = 0.0065** | p = 0.01* | p = 0.0437 |
| 30° vs. 60° | p = 0.00037*** | p = 0.046* | p = 0.3794 |
| 30° vs. 90° | p = 0.00036*** | p = 0.052 | p = 0.0659 |
| 30° vs. 120° | p = 0.00036*** | p = 0.0112* | p = 0.1376 |
| 30° vs. 150° | p = 0.0019** | p = 0.0328* | p = 0.5381 |
| 30° vs. 180° | p = 0.1387 | p = 0.0835 | p = 0.0491* |
| 60° vs. 90° | p = 0.0239* | p = 0.3645 | p = 0.02 |
| 60° vs. 120° | p = 0.0575 | p = 0.1426 | p = 0.041 |
| 60° vs. 150° | p = 0.7924 | p = 0.3948 | p = 0.7489 |
| 60° vs. 180° | p = 0.3326 | p = 0.6406 | p = 0.044* |
| 90° vs. 120° | p = 0.6875 | p = 0.5851 | p = 0.4029 |
| 90° vs. 150° | p = 0.057 | p = 0.7351 | p = 0.0473* |
| 90° vs. 180° | p = 0.0275* | p = 0.6283 | p = 0.03* |
| 120° vs. 150° | p = 0.0565 | p = 0.3171 | p = 0.0436* |
| 120° vs. 180° | p = 0.0145* | p = 0.1737 | p = 0.026* |
| 150° vs. 180° | p = 0.0413* | p = 0.7499 | p = 0.027* |
RTs also varied as a function of cue condition (F[7, 77] = 7.44, p < 0.0001; Figure 6b). Compared with neutral trials, RTs were significantly faster on valid trials and significantly slower on invalid trials (Figure 6b and second column of Table 2a). A one-way repeated measures ANOVA for RTs on only the invalid trials also revealed a significant difference (F[5, 55] = 3.2106, p = 0.013).
A one-way repeated measures ANOVA also revealed a significant modulation in the error rate as a function of the directional offset between the cue and an incorrectly selected distractor (F[5, 55] = 36.164, p < 0.0001; Table 2b and Figure 6c). In particular, subjects selected a distractor whose direction was only 15° away from the invalid cue significantly more often than distractors rotated more than 105° from the invalidly cued direction (Table 2b and Figure 6c).
As in Experiment 1, we found that the best fitting model based on the lowest BIC value was the one where only drift rate varied between the eight possible cue types (collapsing across clockwise and counterclockwise offsets). The parameter estimates for response caution and nondecision time were 20.215 and 0.139, respectively (see Figure 7 for the drift rates across the cue conditions).
Figure 7.

Drift rates for the accumulators corresponding to the correct response on the different cue conditions for Experiment 2. Mean drift rates corresponding to the correct response on each trial computed across subjects (ordinate) as a function of the eight possible cue conditions (abscissa). Offsets were collapsed across clockwise and counterclockwise directions. All error bars are ±1 SEM, computed after subtracting the mean from each subject.
The approximate posterior model probability (see Methods for more details) was close to 1, more than 106 more likely than the next best design in which both drift rate and nondecision time varied. A one-way ANOVA revealed a robust effect of cue-type on drift rates (F[7, 77] = 8.281, p < 0.0001). Consistent with the raw accuracy rates and RTs, drift rates estimated from valid trials were significantly larger than drift rates estimated from neutral trials. Drift rates were also significantly lower for all invalid offsets compared to neutral trials, with the exception of the 180° offset. A one-way repeated measures ANOVA for drift rates on only the invalid trials revealed a highly significant difference (F[5, 55] = 6.7937, p < 0.0001). Drift rates showed the same rebound effect evident in the accuracy data: drift rates continued to decrease as the offset between the cue and target increased, up until an offset of 90°, after which they returned to the level observed on neutral trials (Figure 7 and third column of Table 2a).
Discussion
We utilized two variants of a cueing paradigm to show that goal-directed feature-based attention influences visual performance through both facilitatory and suppressive mechanisms. In Experiment 1, when subjects searched for an oddball motion target, the LBA model revealed increased rates of sensory evidence accumulation for validly cued targets compared to neutral targets (facilitation). In addition, drift rates on invalidly cued trials varied as a function of the cue target offset, with highest drift rates observed for invalid targets that most closely matched the cue. However, while these patterns are suggestive, the drift rates on invalid trials were not significantly lower than drift rates on neutral trials. In Experiment 2, two key changes were made in an attempt to amplify attentional enhancement and suppression. First, we increased competition between the target and distractors in an effort to place additional demands on suppressive attentional mechanisms. Second, as a result of the increased difficulty associated with having more salient distractors, the RDPs in Experiment 2 had higher mean contrast levels compared to Experiment 1: 15.21% versus 1.65%. Given that both neurophysiological and psychophysical work suggest that higher contrast levels can yield greater feature-based attentional effects (Hermann, Heeger, & Carrasco, 2012; Martinez-Trujillo & Treue, 2002), it is possible that this increase in contrast might also contribute to more pronounced attentional modulations. Indeed, these manipulations had the intended effect, as an analysis of drift rates revealed extremely robust evidence for both attention-related facilitation and suppression (Figure 7).
Rebound effect
In Experiment 1, drift rates corresponding to invalidly cued targets were suggestive of a suppressive effect of feature-based attention (Figure 4 and third column of Table 1). This pattern, however, was far more pronounced in Experiment 2, where drift rates corresponding to the invalidly cued targets were significantly lower than those for neutrally cued targets as the offset between the invalid cue and target approached 90° (Figure 7 and third column of Table 2a). However, as the offset between the invalid cue and target increased from 90° to 180°, the corresponding drift rates also gradually increased, giving rise to a “rebound effect” (Figure 7 and third column of Table 2a). A similar rebound pattern was also observed in Experiment 1, where a ANOVA conducted on drift rates on invalidly cued targets was significant (Figure 4 and third column of Table 1).
This nonmonotonic change in drift rate as a function of cue-to-target separation is superficially inconsistent with neurophysiological data showing maximal neural suppression for directions opposite from the attended direction (Martinez-Trujillo & Treue, 2004). Recall that our task only required subjects to identify the quadrant that contained the RDP with the highest motion coherence (among distractors containing 0% motion coherence in Experiment 1 and 40% motion coherence in Experiment 2). As a result, the observed rebound effect could be related to subjects monitoring orientation signals associated with the axis of motion rather than the direction of motion per se. Indeed, many neurons in areas such as the primary visual cortex will respond robustly to the axis of motion in a manner analogous to a static bar rendered at the same orientation (Albright, 1984; Conway and Livingstone, 2003; Livingstone, 1998; Livingstone and Conway, 2003). Note, however, that behavioral performance in Experiment 2 on invalid trials with a 180° offset was not as good as performance on valid trials (Figures 6 and 7; Table 2a). Therefore, signals from motion selective neurons tuned 180° from the cue might very well have been suppressed in motion selective visual areas such as middle temporal (MT), and the partial recovery of performance might be supported by attentional gain targeted towards orientation selective neurons in other areas that are tuned to the axis of motion. In either case, the data suggest that subjects were using the cue to guide search, and clear evidence supporting the suppressive effects of feature-based attention were observed.
Comparisons with the feature-similarity gain model
Compared to a condition in which only a fixation mark was attended, Martinez-Trujillo and Treue (2004) reported enhanced responses in MT neurons that were tuned to an attended direction of motion and suppressed responses in neurons that were tuned away from the attended direction of motion (see also Cohen & Maunsell, 2011). These data predict enhanced perceptual sensitivity for attended features as well as a reduction in perceptual sensitivity for features that are maximally separated from the target in feature space (e.g., opposite directions of motion). Consistent with a suppressive component of feature-based attention, Ling et al. (2009) used an equivalent-noise paradigm and a task in which subjects had to discern whether or not a centrally presented RDP contained motion that was clockwise or counterclockwise from one of four reference directions (see also Baldassi & Verghese, 2005). The coherence (proportion of dots moving in the same direction) of the RDP was systematically adjusted across multiple levels, and the directional offset between the target direction and the reference directions was adjusted to estimate a perceptual sensitivity threshold for each subject. On validly cued trials, attention reduced sensitivity thresholds across all motion coherence levels, suggesting that feature-based attention suppressed neural responses evoked by dots within the RPDs that were moving in uncued directions. This putative suppression of uncued motion directions is consistent with previous neurophysiology studies and with our psychophysical and modeling results. However, the present results further demonstrate that the suppressive effect of feature-based attention can operate across multiple locations in the visual field, as opposed to being restricted to a single spatial location that contains both the cued and the uncued features (as in the variable coherence RDPs used by Ling et al., 2009). In addition, our data reveal a systematic decline in processing efficiency as a function of the directional offset between the cue and the target. This systematic relationship between the cue-to-target offset and the efficiency of sensory processing is evident both in the pattern of drift rates on invalid trials (Figure 7), and in the pattern of errors made on invalid trials, as subjects in Experiment 2 more often chose a distractor whose direction was similar to the cue compared to a distractor whose direction was far from the cue (Figure 6c).
White and Carrasco (2011) also directly assessed the relationship between feature-based attentional suppression and behavior using a dual-task paradigm. Subjects were asked to indicate whether there was a speed change in a primary RDP (that was shown in one hemifield) and then asked to discern which of two secondary RDPs shown in the other hemifield contained coherent motion. The direction of coherent motion in the secondary RDP either matched or mismatched (by 180°) the direction of motion of the primary stimulus. As in the present study, performance was enhanced when subjects were given a valid cue that indicated the direction of the primary RDP compared to when they were given a neutral cue. In addition, subjects were more sensitive to coherent motion in the secondary stimulus when the motion in the secondary stimulus matched the cued direction. However, when the direction of the secondary stimulus mismatched the cued direction, performance was not impaired compared to a neutral cue condition. Thus, their overall pattern of data is consistent with attentional facilitation in the absence of suppression. In contrast, the results from our experiments—particularly Experiment 2—provide strong evidence for both attentional facilitation and suppression. However, our results are not necessarily inconsistent with White and Carrasco's (2011) findings, as motion in their secondary stimulus either matched the cued direction or was offset by 180° from the cued direction. In both of our experiments, suppression was minimized for directions that were 180° from an invalid cue (the “rebound effect,” Figures 3, 4, 6, and 7). Thus, suppression might simply have been minimized at the 180° offset in their study.
Table 2b.
Pair-wise comparisons of the mean error rate on invalid trials according to the different offsets between the invalid cue and chosen distractor direction (n = 12). Offsets were collapsed across clockwise and counterclockwise directions. Please refer to Figure 6c. Note: The reported p-values here have been corrected for multiple comparisons using a False Discovery Rate procedure. *p < 0.05, **p < 0.01, ***p < 0.001.
|
Comparison |
|
| 15° vs. 45° | p = 0.4164 |
| 15° vs. 75° | p = 0.2786 |
| 15° vs. 105° | p = 0.0015** |
| 15° vs. 135° | p = 0.006** |
| 15° vs. 165° | p = 0.0321* |
| 45° vs. 75° | p = 0.8433 |
| 45° vs. 105° | p = 0.1436 |
| 45° vs. 135° | p = 0.0071** |
| 45° vs. 165° | p = 0.084 |
| 75° vs. 105° | p = 0.1579 |
| 75° vs. 135° | p = 0.006** |
| 75° vs. 165° | p = 0.2217 |
| 105° vs. 135° | p = 0.2456 |
| 105° vs. 135° | p = 0.8051 |
| 135° vs. 165° | p = 0.169 |
Finally, Tombu and Tsotsos (2008) evaluated a feature-based version of their selective-tuning model, which posits that attention facilitates the processing of attended features, suppresses the processing of immediately adjacent features, and has little impact on the processing of distant features (see also Tsotsos et al. 1995). In their study, subjects had to decide whether the stripes on a grating stimulus were jagged or straight, and the attended orientation was cued on a block-by-block basis. The orientation of the stripes either matched the attended orientation or was offset by 45° (the “similar” condition) or by 90° (the “dissimilar” condition). Accuracy rates were highest when the stripes matched the cued orientation, lowest in the similar condition (45° offset), and intermediate in the dissimilar condition (90° offset). Although this pattern was only observed with “jagged” stripes (and not with straight stripes), their data are consistent with the pattern of suppression and rebound that we report in Experiment 1 (Figures 3 and 4) and Experiment 2 (Figures 6 and 7). Namely, the pattern of suppression was nonmonotonic as the offset between the cued orientation and the presented orientation increased, and offsets farther away from the cued feature were not suppressed as strongly as offsets that were at an intermediate distance from the cued feature value. Thus, it is possible that our results—particularly in Experiment 2—tap into a similar mechanism proposed in Tsotsos et al.'s (1995) selective-tuning model. The present study, however, complements and extends their results by demonstrating enhancement and suppression relative to a neutral cue baseline, by sampling more feature values, and by implementing a quantitative decision model that can better isolate the different latent cognitive factors that are involved in perceptual decision making.
In sum, our results reveal both facilitatory and suppressive effects of feature-based attention that systematically depend on the directional offset of the stimulus and the currently attended direction. These graded attention effects—that primarily influence the rate of sensory evidence accumulation—are generally consistent with the feature-similarity gain model, which predicts increasingly impaired performance for features that are tuned progressively farther away from the cued direction (but see our discussion of the “rebound effect” and the selective tuning model above). To extend these findings in future studies, we can couple our general experimental and analytical approach with paradigms developed by other investigators to examine interactions between suppression and the spatial extent of feature-based attention (Liu et al., 2011), as well as the impact of feature-based attention on the simultaneous processing of multiple relevant stimuli (Sàenz et al., 2003; White & Carrasco, 2011).
Mechanisms of attentional enhancement and suppression: Sensory gain versus selective weighting
Given the large and growing amount of neurophysiological evidence, it is tempting to ascribe the facilitatory and suppressive behavioral effects observed in our study to modulations of neurons at relatively early stages of sensory processing (Liu et al., 2007; Martinez-Trujillo & Treue, 2004; Maunsell & Treue, 2006; Sàenz, Buraĉas, & Boynton, 2002; Scolari et al., 2012; Serences, Saproo; Scolari, Ho, & Muftuler, 2009; Treue & Maunsell, 1996; Treue & Martinez-Trujillo, 1999). However, the attentional enhancement and suppression effects that we observe may not reflect changes in early sensory gain, but instead a selective weighting of sensory responses by downstream decision mechanisms (Baldassi and Verghese, 2002, 2005; Dosher & Lu, 1999; Eckstein, Thomas, Palmer, & Shimozaki, 2000; Law & Gold, 2008, 2009; Palmer, 1995; Palmer, Verghese, & Pavel, 2000). On this account, areas involved in integrating sensory evidence during decision making might overweight the output of direction-selective neural populations tuned to the cued feature, and underweight input from neural populations tuned away from the cued direction. This selective weighting would give rise to enhanced performance in the valid-cue condition and systematically worse performance for targets rotated farther from the cue (Figures 3 and 4 from Experiment 1; Figures 6 and 7 from Experiment 2). Moreover, this type of selective weighting also predicts the systematic pattern of errors observed in Experiment 2, as neurons that respond to distractor directions that are close to the cued direction might more strongly influence decision mechanisms and trigger more frequent incorrect responses (Figure 6c). Finally, the selective weighting account might explain the larger suppressive effects that we observed in Experiment 2 compared to Experiment 1, as the 40% coherent RDP distractors in Experiment 2 are more likely to influence decision mechanisms that differentially weight responses from neural populations that respond to directions that are adjacent to the cued direction.
Thus, based on the current behavioral data alone, we cannot unambiguously determine if the behavioral facilitation on valid trials and the impaired performance on invalid trials is due to sensory enhancement, selective weighting during decision making, or—more likely—to some combination of the two mechanisms. One potential method to disentangle these alternatives would be to re-run a version of Experiment 2 with fewer offsets and more sessions in order to dramatically increase the amount of data that is collected. With more power, it may be possible to use a modified LBA model to estimate response caution for every possible cue-distractor offset on trials in which a distractor is incorrectly selected in place of the target. Thus, one could test whether or not response caution is lower when distractors are similar to the invalid cue, which might support the idea that the decision criteria are adjusted based on cue-stimulus similarity. However, an alternate, and perhaps more fruitful, approach would be to adapt a version of Experiment 2 to either single unit recording or functional magnetic resonance imaging environments. This would enable measurements of attention-mediated changes in sensory gain throughout the visual cortex and allow one to examine if most of the variability in behavior can be accounted for by only considering the observed changes in sensory gain or if positing an additional mechanism that selectively reweights sensory responses during decision making is needed to fully explain the nature and magnitude of the observed changes in behavior (Pestilli, Carrasco, Heeger, & Gardner, 2011).
Linear ballistic accumulator versus signal detection models
The LBA model is one of many models that utilizes RT and accuracy to examine how experimental manipulations impact latent cognitive factors such as drift rate, decision boundaries, and non-decision times (Brown & Heathcote, 2008; Link & Heath, 1975; Ratcliff, 1978; Ratcliff & Rouder, 1988; Usher & McClelland, 2001; Van Zandt, Colonius, & Proctor, 2000; Wagenmakers, van der Maas, & Grasman, 2007). Other models, such as those based on signal detection theory (SDT), also do an excellent job explaining accuracy data that is obtained in experiments similar to ours (Baldassi & Verghese, 2002, 2005; Eckstein et al., 2000; Palmer, 1995; Palmer et al., 2000). In these SDT models, each element in a visual display elicits a noisy representation within each relevant feature dimension. The observer then combines these representations across all features to obtain a single decision variable, and the stimulus with the maximum value is deemed the most likely to be the target. This approach is particularly adept at explaining behavior in situations where the target is exposed briefly in a data-limited manner, and accuracy is the primary dependent measure (as opposed to RT). However, even though SDT models account for performance on an impressive array of search tasks, sequential sampling models often have an advantage. This is particularly true when a decision is based on noisy sensory inputs that are continuously present so that the reliability of the final decision variable continuously increases as more evidence is unveiled (Smith & Ratcliff, 2004). In addition, the conception of a perceptual decision as an accumulation process is now well supported based on studies that examine the buildup of firing rates of sensorimotor neurons that are thought to play a key role in mediating basic perceptual decisions (Gold & Shadlen, 2007; Heekeren, Marrett, Bandettini, & Ungerleider, 2004; Leon & Shadlen, 1999; Mazurek, Roitman, Ditterich, & Shadlen, 2003).
Feature-based attention and changes in neural variability
As discussed above, changes in the rate of sensory evidence accumulation (Figures 4 and 7) can be intuitively linked to changes either in the firing rate of sensory neurons or to changes in the relative weighting of sensory signals by downstream decision mechanisms. However, there is growing evidence that top-down attention can also influence neural variability (Cohen & Maunsell, 2009, 2010, 2011; Cohen & Kohn, 2011; Mitchell, Sundberg, & Reynolds, 2007, 2009). For example, space- and feature-based attention have been shown to reduce the ratio of the variance of individual sensory neurons to their mean firing rate (or the “fano factor”; Mitchell et al., 2009; Cohen & Maunsell, 2011). In turn, a reduction in neural variability should lead to more stable sensory responses across time, thus speeding the process of evidence accumulation during decision making (Churchland, Kiani, Chaudhuri, Wang, Pouget, & Shadlen, 2011). Recently, Rahnev et al. (2011) used a SDT model to demonstrate that such a reduction in neural variability can increase behavioral performance by increasing the signal available for supporting perceptual decisions. Interestingly, this reduction in variability improves performance on average, but also reduces the probability of a high signal response on any given trial, thereby leading to a more conservative bias in behavioral responses (Rahnev et al., 2011). While these results are not directly comparable to the present findings due to differences in the task and the type of model that was employed, they suggest an important role for attention-mediated reductions in neural noise during perceptual decision making. An advantage of sequential sampling models, like the LBA, is that such explanations can be directly investigated. For example, one could explore LBA models in which the parameter governing the variance of the drift rate distributions was free to vary with cueing manipulations. Such models can be difficult to estimate due to the highly correlated posterior distributions for mean drift rate and variance parameters, so such investigations will require future studies that have many more data points per participant (Donkin, Brown, & Heathcote, 2009; Smith, Ratcliff, & Wolfgang, 2004).
Conclusions
Here, we provide evidence for both facilitatory and suppressive effects of top-down feature-based attention on human performance that can best be explained by changes in the rate of sensory evidence accumulation, particularly when competition between the target and distractors was high. One critical outstanding issue concerns developing a mechanistic explanation for the observed effects and determining whether feature-based attention mediates behavior primarily via changes in sensory gain, changes in the weighting of sensory evidence by downstream decision mechanisms, or through some combination of the two. Future studies employing neurophysiological or neuroimaging approaches will hopefully dissociate these possibilities and isolate the relative contributions of each mechanism.
Acknowledgments
This work was supported by National Institutes of Mental Health (R01-MH092345 to J.T.S.).
Commercial relationships: none.
Corresponding author: Tiffany C. Ho.
Email: tcho@ucsd.edu; jserences@ucsd.edu.
Address: Department of Psychology, University of California, San Diego, La Jolla, CA.
Contributor Information
Tiffany C. Ho, Email: tcho@ucsd.edu.
Scott Brown, Email: Scott.Brown@newcastle.edu.au.
John T. Serences, Email: jserences@ucsd.edu.
References
- Albright T. D. (1984). Direction and orientation selectivity of neurons in visual area MT of the macaque. Journal of Neurophysiology, 52(6), 1106–1130. [DOI] [PubMed] [Google Scholar]
- Baldassi S., Verghese P. (2002). Comparing integration rules in visual search. Journal of Vision , 2(8):15 559–570, http://www.journalofvision.org/content/2/8/3, doi:10.1167/2.8.3. [PubMed] [Article] [DOI] [PubMed] [Google Scholar]
- Baldassi S., Verghese P. (2005). Attention to locations and features: Different top-down modulation of detector weights. Journal of Vision , 5(6):15 556–570, http://www.journalofvision.org/content/5/6/7, doi:10.1167/5.6.7. [PubMed] [Article] [DOI] [PubMed] [Google Scholar]
- Brainard D. H. (1997). The psychophysics toolbox. Spatial Vision , 10, 433–436. [PubMed] [Google Scholar]
- Brown S., Heathcote A. (2008). The simplest complete model of choice response time: Linear ballistic accumulation. Cognitive Psychology , 57, 153–178. [DOI] [PubMed] [Google Scholar]
- Burnham K. P., Anderson D. R. (2002). Model selection and multimodel inference: A practical information-theoretic approach (2nd ed.). New York: Springer. [Google Scholar]
- Busse L., Katzner S., Tillmann C., Treue S. (2008). Effects of attention on perceptual direction tuning curves in the human visual system. Journal of Vision , 8(9):15 1–13, http://www.journalofvision.org/content/8/9/2, doi:10.1167/8.9.2. [PubMed] [Article] [DOI] [PubMed] [Google Scholar]
- Carrasco M. (2011). Visual attention: The past 25 years. Vision Research , 51, 1484–1525. [DOI] [PMC free article] [PubMed] [Google Scholar]
- Churchland A. K., Kiani R., Chaudhuri R., Wang X. J., Pouget A., Shadlen M. N. (2011). Variance as a signature of neural computations during decision making. Neuron , 69, 818–831. [DOI] [PMC free article] [PubMed] [Google Scholar]
- Cohen M. R., Kohn A. (2011). Measuring and interpreting neuronal correlations. Nature Neuroscience, 14, 811–819. [DOI] [PMC free article] [PubMed] [Google Scholar]
- Cohen M. R., Maunsell J. H. (2009). Attention improves performance primarily by reducing interneuronal correlations. Nature Neuroscience , 12, 1594–1600. [DOI] [PMC free article] [PubMed] [Google Scholar]
- Cohen M. R., Maunsell J. H. (2010). A neuronal population measure of attention predicts behavioral performance on individual trials. Journal of Neuroscience, 30(45), 15241–15253. [DOI] [PMC free article] [PubMed] [Google Scholar]
- Cohen M. R., Maunsell J. H. R. (2011). Using neuronal populations to study the mechanisms underlying spatial and feature attention. Neuron , 70, 1192–1204. [DOI] [PMC free article] [PubMed] [Google Scholar]
- Conway B. R., Livingstone M .S. (2003). Space-time maps and two-bar interactions of different classes of direction-selective cells in macaque V1. Journal of Neurophysiology , 89, 2726–2742. [DOI] [PMC free article] [PubMed] [Google Scholar]
- Donkin C., Brown S. D., Heathcote A. (2009). The overconstraint of response time models: Rethinking the scaling problem. Psychonomic Bulletin & Review , 16, 1129–1135. [DOI] [PubMed] [Google Scholar]
- Donkin C., Brown S., Heathcote A., Wagenmakers E. J. (2011). Diffusion versus linear ballistic accumulation: Different models but the same conclusions about psychological processes? Psychonomic Bulletin & Review , 18, 61–69. [DOI] [PMC free article] [PubMed] [Google Scholar]
- Dosher B. A., Lu Z. L. (1999). Mechanisms of perceptual learning. Vision Research , 39, 197–221. [DOI] [PubMed] [Google Scholar]
- Eckstein M. P., Thomas J. P., Palmer J., Shimozaki S. S. (2000). A signal detection model predicts the effects of set size on visual search for feature, conjunction, triple conjunction, and disjunction displays. Perception & Psychophysics , 62(3), 425–451. [DOI] [PubMed] [Google Scholar]
- Felisberti F. M., Zanker J. M. (2005). Attention modulates perception of transparent motion. Vision Research , 45, 2587–2599. [DOI] [PubMed] [Google Scholar]
- Gold J. I., Shadlen M. N. (2007). The neural basis of decision making. Annual Reviews of Neuroscience , 30, 535–574. [DOI] [PubMed] [Google Scholar]
- Heekeren H. R., Marrett S., Bandettini P. A., Ungerleider L. G. (2004). A general mechanism for perceptual decision-making in the human brain. Nature , 14, 859–862. [DOI] [PubMed] [Google Scholar]
- Hermann K., Heeger D. J., Carrasco M. (2012). Feature-based attention enhances performance by increasing response gain. Vision Research , Epub ahead of print. [DOI] [PMC free article] [PubMed] [Google Scholar]
- Khayat P. S., Neibergall R., Martinez-Trujillo J. C. (2010). Attention differentially modulates similar neuronal responses evoked by varying contrast and direction stimuli in area MT. Journal of Neuroscience , 30, 2188–2197. [DOI] [PMC free article] [PubMed] [Google Scholar]
- Law C. T., Gold J. I. (2008). Neural correlates of perceptual learning in a sensory-motor, but not a sensory cortical area. Nature Neuroscience, 11, 505–513. [DOI] [PMC free article] [PubMed] [Google Scholar]
- Law C. T., Gold J. I. (2009). Reinforcement learning can account for associative and perceptual learning on a visual-decision task. Nature Neuroscience, 12, 655–663. [DOI] [PMC free article] [PubMed] [Google Scholar]
- Leon M. I., Shadlen M. N. (1999). Effect of reward magnitude on the response of neurons in the dorsolateral prefrontal cortex of the macaque. Neuron , 24, 415–425. [DOI] [PubMed] [Google Scholar]
- Ling S., Liu T., Carrasco M. (2009). How spatial and feature-based attention affect the gain and tuning of population responses. Vision Research , 49, 1194–120. [DOI] [PMC free article] [PubMed] [Google Scholar]
- Link S. W., Heath R. A. (1975). A sequential theory of psychological discrimination. Psychometrikia, 40, 77–105. [Google Scholar]
- Liu T., Hou Y. (2011). Global feature-based attention to orientation. Journal of Vision , 11(10):15 1–8, http://www.journalofvision.org/content/11/10/8, doi:10.1167/11.10.8. [PubMed] [Article] [DOI] [PubMed] [Google Scholar]
- Liu T., Stevens S. T., Carrasco M. (2007). Comparing the time course and efficacy of spatial and feature-based attention. Vision Research , 47, 108–113. [DOI] [PubMed] [Google Scholar]
- Livingstone M. S. (1998). Mechanisms of direction selectivity in macaque V1. Neuron, 20, 509–526. [DOI] [PubMed] [Google Scholar]
- Livingstone M. S., Conway B. R. (2003). Substructure of direction-selective receptive fields in macaque V1. Journal of Neurophysiology , 89, 2743–2759. [DOI] [PMC free article] [PubMed] [Google Scholar]
- Maunsell J. H. R., Treue S. (2006). Feature-based attention in visual cortex. Trends in Neuroscience, 29, 317–322. [DOI] [PubMed] [Google Scholar]
- Martinez-Trujillo J. C., Treue S. (2002). Attentional modulation strength in cortical area MT depends on stimulus contrast. Neuron , 35, 365–370. [DOI] [PubMed] [Google Scholar]
- Martinez-Trujillo J. C., Treue S. (2004). Feature-based attention increases the selectivity of population responses in primate visual cortex. Current Biology , 14, 744–751. [DOI] [PubMed] [Google Scholar]
- Mazurek M. E., Roitman J. D., Ditterich J., Shadlen M. N. (2003). A role for neural integrators in perceptual decision making. Cerebral Cortex, 13, 1257–1269. [DOI] [PubMed] [Google Scholar]
- McAdams C. J., Maunsell J. H. (1999). Effects of attention on orientation-tuning functions of single neurons in macaque cortical area V4. Journal of Neuroscience , 19(1), 431–441. [DOI] [PMC free article] [PubMed] [Google Scholar]
- Mitchell J. F., Sundberg K. A., Reynolds J. H. (2007). Differential attention-dependent response modulations across cell classes in macaque visual area V4. Neuron , 55, 131–141. [DOI] [PubMed] [Google Scholar]
- Mitchell J. F., Sundberg K. A., Reynolds J. H. (2009). Spatial attention decorrelates intrinsic activity fluctuations in macaque area V4. Neuron , 63, 879–888. [DOI] [PMC free article] [PubMed] [Google Scholar]
- Palmer J. (1995). Attention in visual search: Distinguishing four causes of set-size effects. Current Directions in Psychological Science , 4, 118–123. [Google Scholar]
- Palmer J., Verghese P., Pavel M. (2000). The psychophysics of visual search. Vision Research, 40(10-12), 1227–1268. [DOI] [PubMed] [Google Scholar]
- Pelli D. G. (1997). The Video Toolbox software for visual psychophysics: Transforming numbers into movies. Spatial Vision , 10, 437–442. [PubMed] [Google Scholar]
- Pestilli F., Carrasco M., Heeger D. J., Gardner J. L. (2011). Attentional enhancement via selection and pooling of early sensory responses in human visual cortex. Neuron , 72, 832–846. [DOI] [PMC free article] [PubMed] [Google Scholar]
- Posner M. I. (1980). Orienting of attention. Quarterly Journal of Experimental Psychology, 3, 3–25. [DOI] [PubMed] [Google Scholar]
- Raftery A. E. (1995). Bayesian model selection in social research. Sociological Methodology , 25, 111–163. [Google Scholar]
- Rahnev D., Maniscalco B., Graves T., Huang E., de Lange F. P., Lau H. (2011). Attention induces conservative subjective biases in visual perception. Nature Neuroscience , 14, 1513–1515. [DOI] [PubMed] [Google Scholar]
- Ratcliff R. (1978). A theory of memory retrieval. Pyschological Review, 85, 59–108. [Google Scholar]
- Ratcliff R., Rouder J. N. (1998). Modeling response times for two-choice decisions. Psychological Science , 9, 347–356. [Google Scholar]
- Reynolds J. H., Chelazzi L., Desimone R. (1999). Competitive mechanisms subserve attention in macaque areas V2 and V4. Journal of Neuroscience , 19(5), 1736–1753. [DOI] [PMC free article] [PubMed] [Google Scholar]
- Reynolds J. H., Heeger D. J. (2009). The normalization model of attention. Neuron , 61, 168–185. [DOI] [PMC free article] [PubMed] [Google Scholar]
- Reynolds J. H., Pasternak T., Desimone R. (2000). Attention increases sensitivity of V4 neurons. Neuron , 26, 703–714. [DOI] [PubMed] [Google Scholar]
- Sàenz M., Buraĉas G. T., Boynton G. M. (2002). Global effects of feature-based attention in human visual cortex. Nature Neuroscience , 5, 631–632. [DOI] [PubMed] [Google Scholar]
- Sàenz M., Buraĉas G. T., Boynton G. M. (2003). Global feature-based attention for motion and color. Vision Research , 43, 629–637. [DOI] [PubMed] [Google Scholar]
- Schwarz G. (1978). Estimating the dimension of a model. Annuals of Statistics, 6, 461–464. [Google Scholar]
- Scolari M., Byers A., Serences J. T. (2012). Optimal deployment of attentional gain during fine discriminations. Journal of Neuroscience , 32, 7723–7733. [DOI] [PMC free article] [PubMed] [Google Scholar]
- Serences J. T., Saproo S., Scolari M., Ho T., Muftuler L. T. (2009). Estimating the influence of attention on population codes in human visual cortex using voxel-based tuning functions. Neuroimage , 44, 223–31. [DOI] [PubMed] [Google Scholar]
- Smith P. L., Ratcliff R. (2004). Psychology and neurobiology of simple decisions. Trends in Neurosciences , 27, 161–168. [DOI] [PubMed] [Google Scholar]
- Smith P. L., Ratcliff R., Wolfgang B. J. (2004). Attention orienting and the time course of perceptual response time distributions with masked and unmasked displays. Vision Research , 44, 1297–1320. [DOI] [PubMed] [Google Scholar]
- Tombu M., Tsotsos J. K. (2008). Attending to orientation results in an inhibitory surround in orientation space. Perception & Psychophysics, 70, 30–35. [DOI] [PubMed] [Google Scholar]
- Treue S., Maunsell J. H. R. (1996). Attentional modulation of visual motion processing cortical areas MT and MST. Nature, 382, 539–541. [DOI] [PubMed] [Google Scholar]
- Treue S., Martinez-Trujillo J. C. (1999). Feature-based attention influences motion processing gain in macaque visual cortex. Nature , 399, 575–579. [DOI] [PubMed] [Google Scholar]
- Tsotsos J. K., Culhane S. M., Wai W. Y. K., Lai Y., Davis N., Nuflo F. (1995). Modeling visual attention via selective tuning. Artificial Intelligence , 78, 507–545. [Google Scholar]
- Usher M., McClelland J.L. (2001). The time course of perceptual choice: The leaky, competing accumulator model. Psychological Review, 108, 550–592. [DOI] [PubMed] [Google Scholar]
- Van Zandt T., Colonius H., Proctor R. W. (2000). A comparison of two response time models applied to perceptual matching. Psychonomic Bulletin & Review , 7, 208–256. [DOI] [PubMed] [Google Scholar]
- Wagenmakers E. J., van der Maas H. L., Grasman R. P. (2007). An EZ-diffusion model for response time and accuracy. Psychonomic Bulletin & Review , 14, 3–22. [DOI] [PubMed] [Google Scholar]
- Watson A. B., Pelli D. G. (1983). QUEST: A Bayesian adaptive psychometric method. Perception & Psychophysics , 33, 113–120. [DOI] [PubMed] [Google Scholar]
- White A. L., Carrasco M. (2011). Feature-based attention involuntarily and simultaneously improves visual performance across locations. Journal of Vision , 11(6):15 1–10, http://www.journalofvision.org/content/11/6/15, doi:10.1167/11.6.15. [PubMed] [Article] [DOI] [PMC free article] [PubMed] [Google Scholar]
- Williford T., Maunsell J. H. (2006). Effects of spatial attention on contrast response functions in macaque area V4. Journal of Neurophysiology , 96, 40–54. [DOI] [PubMed] [Google Scholar]
- Wolfe J. M., Van Wert M. J. (2010). Varying target prevalence reveals two dissocial decision criteria in visual search. Current Biology 20, 121–124. [DOI] [PMC free article] [PubMed] [Google Scholar]