

Supplemental Digital Content is available in the text.
Keywords: magnetic resonance, MRI, myocardial infarction
Abstract
Rationale:
After acute myocardial infarction (MI), delineating the area-at-risk (AAR) is crucial for measuring how much, if any, ischemic myocardium has been salvaged. T2-weighted MRI is promoted as an excellent method to delineate the AAR. However, the evidence supporting the validity of this method to measure the AAR is indirect, and it has never been validated with direct anatomic measurements.
Objective:
To determine whether T2-weighted MRI delineates the AAR.
Methods and Results:
Twenty-one canines and 24 patients with acute MI were studied. We compared bright-blood and black-blood T2-weighted MRI with images of the AAR and MI by histopathology in canines and with MI by in vivo delayed-enhancement MRI in canines and patients. Abnormal regions on MRI and pathology were compared by (a) quantitative measurement of the transmural-extent of the abnormality and (b) picture matching of contours. We found no relationship between the transmural-extent of T2-hyperintense regions and that of the AAR (bright-blood-T2: r=0.06, P=0.69; black-blood-T2: r=0.01, P=0.97). Instead, there was a strong correlation with that of infarction (bright-blood-T2: r=0.94, P<0.0001; black-blood-T2: r=0.95, P<0.0001). Additionally, contour analysis demonstrated a fingerprint match of T2-hyperintense regions with the intricate contour of infarcted regions by delayed-enhancement MRI. Similarly, in patients there was a close correspondence between contours of T2-hyperintense and infarcted regions, and the transmural-extent of these regions were highly correlated (bright-blood-T2: r=0.82, P<0.0001; black-blood-T2: r=0.83, P<0.0001).
Conclusion:
T2-weighted MRI does not depict the AAR. Accordingly, T2-weighted MRI should not be used to measure myocardial salvage, either to inform patient management decisions or to evaluate novel therapies for acute MI.
The myocardium that becomes ischemic after occlusion of its supplying coronary artery defines the myocardium that is at risk of death, the so-called area-at-risk (AAR).1 The portion of the AAR that survives, if any, represents myocardium that has been salvaged by treatment during acute myocardial infarction (MI). Identifying salvage is crucial for patient management and for predicting prognosis. Moreover, an accurate estimate of salvage, which only can be made if one knows how much myocardium is at risk, would provide a direct measure of therapeutic efficacy and serve as a better end point in randomized trials than in indirect metrics, such as left ventricular ejection fraction and infarct size.2,3
Editorial, see p 222
T2-weighted MRI is widely promulgated as an excellent noninvasive method to characterize the AAR.4–11 Expert reviews and consensus society guidelines suggest this application represents an important advantage of MRI over other imaging modalities.4–11 A search of 2 major clinical trial registries, ClinicalTrials.gov and Current Controlled Trials, underscores the high level of interest and shows this application of MRI is being used as an efficacy end point in 29 acute MI trials, involving >6600 patients worldwide.2,12,13
Recently, however, questions have been raised regarding the pathophysiological underpinning of the technique.2,14 For example, T2-weighted MRI depicts myocardial edema, yet a homogeneously bright AAR as suggested by prior reports15–17 is incompatible with the different levels of edema that are known to occur in infarcted versus salvaged myocardium. Edema nearly doubles myocardial volume in infarcted tissue, but it is barely measurable, if present at all, in salvaged myocardium.2,18,19
Additionally, despite a large body of literature suggesting that T2-weighted MRI can identify the AAR, the evidence is indirect, and therefore, the method has not been fully validated.2,20,21 The vast majority of published studies use clinical surrogate markers of the AAR and do not provide verification with histopathology. Although 2 reports provide some histopathology data, the AAR was extrapolated from a crude map of microsphere counts involving only a small number of tissue sections that were wedge-shaped and fully transmural.15,22 Hence, the shape and contour of the AAR were not determined, and there is no direct anatomic evidence in the literature to support the conclusion that T2-weighted MRI depicts the AAR.2
Here, we show for the first time a direct comparison between the shape and contour of the hyperintense, abnormal region on T2-weighted MRI and the shape and contour of the true AAR delineated by histopathology. Both bright-blood and black-blood T2-weighted MRI images were obtained using standard sequences, and fluorescent microspheres were used to define the AAR at pathology. A comparison also was made with the shape and contour of infarction determined at pathology with histochemical staining and delineated in vivo with delayed-enhancement MRI.23
Methods
Canines
Protocol Overview and Pathology
The care and treatment of canines (20–30 kg) was in accordance with the Position of the American Heart Association on Research Animal Use.24 The protocol was approved by the Duke University Institutional Animal Care and Use Committee. We produced an MI by occluding the left anterior descending coronary artery or the left circumflex artery (obtuse marginal branch) under sterile conditions after a lateral thoracotomy.25 To investigate a wide range of myocardial salvage within the AAR, we used a range of occlusion times (40–90 minutes) followed by reperfusion. As a point-of-reference, a 40-minute occlusion in the canine model leads to a subendocardial infarct that averages 38% transmural.26
MRI was performed under general anesthesia 4±1 days after coronary occlusion/reperfusion. We chose 4±1 days because many randomized trials using T2-weighted MRI as an efficacy end point performed MRI 3 to 5 days after MI.27–30
After imaging, the area-at-risk and the area of infarction were determined using microspheres and histochemical staining, respectively.23,25 In brief, the infarct-related artery was reoccluded while under anesthesia and 150 mg of fluorescent microspheres (1–10 μm; ThermoFisher Scientific, Fremont, CA) were injected into the left atrial appendage, immediately followed by 2 mmol/kg of potassium chloride to arrest the heart. The hearts were removed, immersed in cold saline solution, rinsed, then sectioned into 7-mm short-axis slices from base to apex. Slices were photographed under ultraviolet light to detect the presence of microspheres, which allowed the determination of the AAR (region without microspheres). Slices were then stained with 2% triphenyltetrazolium chloride solution and photographed in room light to delineate the infarct (infarcted, yellowish-white; noninfarcted, brick-red). A limitation of the study is that we did not collect data on hemodynamics or collateral blood flow, both of which are important factors in determining the amount of salvage that might occur for any given animal with a set coronary occlusion time.
MRI
Images were acquired on a 3T Siemens Verio (first 5 animals on 1.5 T Sonata) during ventilated breathholds. First, T2-weighted images were acquired and then 10 minutes after intravenous gadoversetamide administration (0.2 mmol/kg body weight), standard inversion-recovery delayed-enhancement images were obtained in the same short-axis locations as T2-weighted-MRI.23
Both bright-blood and black-blood T2-weighted images were obtained so that findings would be broadly applicable. Bright-blood images were acquired using a standard sequence employing a T2-preparation module followed by steady-state free-precession readout (T2-prep time, 80 ms; TR, 2–3 R-R intervals; flip angle, 60°; slice thickness, 7 mm; in-plane resolution, 1.1×1.0; bandwidth, 975 Hz/pixel).31 Black-blood images were acquired using a standard double-inversion, turbo-spin-echo sequence (TR, 2–3 R-R intervals; TE 77 ms; flip angle, 180°; slice thickness, 7 mm; in-plane resolution, 1.1×1.0) with fat suppression and vendor-supplied coil normalization.31 The bandwidth was 780 Hz/pixel and similar to that used for black-blood turbo-spin-echo in prior studies (eg, 930 Hz/pixel,32 798 Hz/pixel33).
Bright-blood images were obtained in mid-diastole, which is conventional.31 Black-blood images were also obtained in diastole; however, we have observed that small changes in the timing of image acquisition can affect the severity of artifacts.14 Hence, for black-blood imaging, we first obtained test images at multiple time-points in diastole to determine the optimal time of image readout when motion-related signal loss (dropout) artifact was minimized (Figure 1A). Although the optimal time was usually in mid-diastole or end-diastole, there was significant subject-to-subject variation and ranged from 60% to 95% of the cardiac cycle. Note, the procedure to optimize timing was used only for black-blood imaging, and because there was no change in the pulse sequence (ie, no change in TR, TE, bandwidth, etc), there was no effect on myocardial T2-weighting.
Figure 1.
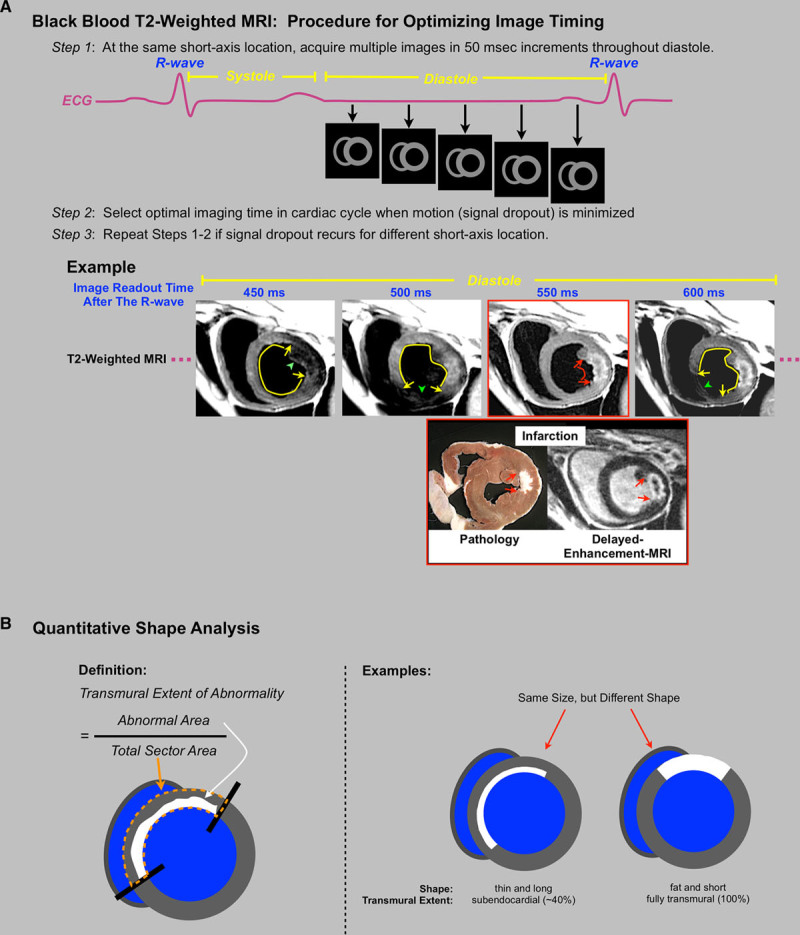
A, The steps used to optimize image timing for black-blood T2-weighted-MRI. This involved choosing a midventricular short-axis slice, obtaining test images throughout diastole, and inspecting the images to determine the best timing of readout based on the absence of signal loss (dropout) artifact. Signal loss was determined visually and defined as a myocardial region with obviously reduced signal on one but not other test images. Example images from one subject demonstrate that small changes in timing (≈50 ms) can affect the presence and location of dropout artifact (green arrrowhead). Note that when dropout artifact is present, the remaining myocardium appears hyperintense (yellow arc), which could confound interpretation. This usually leads to overestimation of T2-abnormality size because dropout typically affects only a fraction (<50%) of the myocardium in the slice. The image with optimal timing (red box) demonstrates no region with dropout and an obvious area of hyperintensity (red arc) in the region of acute infarction as demonstrated by pathology and in vivo delayed-enhancement MRI (red arrows). B, The shapes of abnormal regions on MRI and pathology were compared by quantitatively measuring the transmural-extent of the abnormal region. This was defined as the area of the abnormal region (white region) divided by the total myocardial sector area (orange outline). The examples show that 2 subjects could have similar-sized abnormalities, yet shapes are clearly distinct representing different underlying pathophysiology (eg, thin and long versus fat and short in the radial and circumferential directions, respectively).
Image Analysis
To ascertain what T2-weighed-MRI in the canine heart depicts, the shape and contour of hyperintense regions on T2-weighted-MRI were compared with that of the AAR (microspheres) and that of infarction (ex vivo by histopathology and in vivo by delayed-enhancement-MRI). Two analysis methods were used: (a) quantitative measurement of the mean transmural-extent of the abnormality (Figure 1B) and (b) picture matching of contours. A fundamental tenet, the wavefront phenomenon of ischemic cell death, was the pathophysiological basis for examining transmural-extent.1 It describes that during coronary occlusion, MI ensues as a transmurally directed wavefront extending from the subendocardial to subepicardial myocardium of the AAR. Thus, subjects with similar infarct size may have infarcts with different shape (eg, transmural-extent) depending on the timeliness of reperfusion therapy and the extent of arterial collateral flow (Figure 1B). Consequently, comparing shape rather than size results in less ambiguity for discerning the underlying pathophysiology.
Pathology slices were registered with in vivo MRI images using myocardial landmarks (papillary muscles, RV insertions into septum). For each animal, ≤3 slices which transected the AAR were analyzed by an observer blinded to MRI. The AAR and infarcted myocardium were planimetered on the ultraviolet-light and triphenyltetrazolium chloride-stained pathology photographs, respectively, and the transmural-extent of the AAR and infarction were expressed as a percentage of the total myocardial sector area on a slice-by-slice basis (Figure 1B). The transmural-extent of hyperintense regions on T2-weighted MRI and hyperenhanced regions on delayed-enhancement MRI were measured similarly. Some results were also expressed in units of grams of tissue. Each MRI technique was interpreted separately and blinded to the results from the other MRI techniques and pathology. Myocardium was considered abnormal using a signal intensity threshold of >2 standard deviations (SD) above the remote, unaffected region, although for exploratory purposes, other integer multiples of SD were also tested.
For picture matching of abnormality contours, we compared hyperintense regions on T2-weighted MRI with hyperenhanced regions on delayed-enhancement MRI. For this analysis, we maintained blinding using the procedures described below. Black-blood images were used because contours of T2-hyperintense regions bordering the left ventricle (LV) cavity were more conspicuous compared with bright-blood images. To reduce the possibility that features of the LV besides that of hyperintense regions could be used for matching images that were acquired from the same heart, we compared only mid-ventricular slices in canines with subendocardial infarction in the anterior wall (n=8). Additionally, delayed-enhancement images were masked so that only the anterior half of the LV was visible. Then the set of delayed-enhancement images along with the set of corresponding T2-weighted images were placed in random order. Four observers, unaware of the purpose of the study, were instructed to best match T2-weighted and delayed-enhancement images solely using the contours of the bright abnormal regions on the 2 sets of images as a fingerprint comparison. The hypothesis was that if T2-weighted MRI depicts the AAR, consistent pairing of images from the same subject would not be possible because the contours of T2-hyperintense regions would not match that of hyperenhanced regions on delayed-enhancement MRI because the latter represents infarction and not the AAR. Hence, correct matches, if any, would be due to random chance.
Patients
Patients presenting with first, acute MI were recruited prospectively. The diagnosis of MI was based on the Universal Definition and required an appropriate rise in cardiac biomarkers.34 To increase the likelihood that a wide range of myocardial salvage would be encountered, we recruited patients with or without electrocardiographic ST-segment elevation and with or without primary percutaneous coronary intervention. Patients <18 years old, with prior history of MI, history of cardiac surgery, or contraindications for MRI were excluded. Consecutive patients who underwent invasive coronary angiography during admission with confirmed coronary disease (≥70% stenosis in ≥1 vessel) and who agreed to undergo MRI were enrolled. MRI was performed for research purposes (not clinically ordered scans), and scan results were not used to guide clinical decision-making. All patients gave written informed consent, which was approved by the Duke University Institutional Review Board.
MRI was performed 3±1 days after admission. The MRI protocol was the same as that used in canines, and the same sequences were used with similar settings (bright-blood: T2-prep time, 80 ms; TR, 2 R-R intervals; flip angle, 60°; slice thickness, 7 mm; in-plane resolution, 1.9×1.4; black-blood: TR, 2 R-R intervals; TE 80 ms; flip angle, 180°; slice thickness, 7 mm; in-plane resolution, 1.9×1.4 mm). Delayed-enhancement images were obtained 10 minutes after intravenous gadoversetamide (0.15–0.2 mmol/kg) administration. MRI analysis was the same as for canines, and T2-weighted and delayed-enhancement images were interpreted independently, masked to patient identity and clinical information. AAR size was estimated by the Bypass Angioplasty Revascularization Investigation (BARI) method and calculated as a percentage of the LV.35
Statistical Analysis
Continuous data are presented as mean±SD or, in cases where the distribution is not normal, as median and interquartile range. The mean transmural-extent of the AAR and infarction by pathology, as well as T2-hyperintensity and in vivo infarction by delayed-enhancement MRI, were compared by use of paired t-tests. Linear correlation analysis was used to compare the relationships between the transmural-extent of abnormal regions on pathology and MRI. Because multiple slices were analyzed in each subject, a linear mixed-model regression analysis for repeated measures was performed to account for the fact that transmural-extent values are correlated within each subject. Linear regression analysis was used to assess whether the 95% confidence intervals of the regression coefficients included the line of identity (ie, 1). Bland–Altman analysis was performed to assess the agreement between MRI and pathology measurements. Statistical tests were 2-tailed; P<0.05 was considered significant. SAS (version 9.3, Cary, NC) was used to perform the statistical analyses.
Results
Canines
Data from all canines (n=21) that survived the surgical MI procedure are included. Three animals died during surgery. Bright-blood and black-blood T2-weighted MRI were performed in 19 and 21 subjects, respectively. No subject was excluded on the basis of image quality.
Comparison of T2-Hyperintensity With the AAR and Infarction
Examples of in vivo MRI in comparison with pathology are shown in Figure 2. In these 4 subjects, the area of T2-hyperintensity on both bright-blood and black-blood imaging is primarily limited to the subendocardial portion of the wall (ie, transmural-extent is ≈50%). Similarly, the infarcted region determined by histopathology or delayed-enhancement MRI is mostly subendocardial. In contrast, the true AAR by histopathology (top row, orange outline) involves the full thickness of the wall (ie, transmural-extent is nearly 100%). Hence, in these examples, the shape of T2-hyperintense regions differed markedly from the true AAR.
Figure 2.
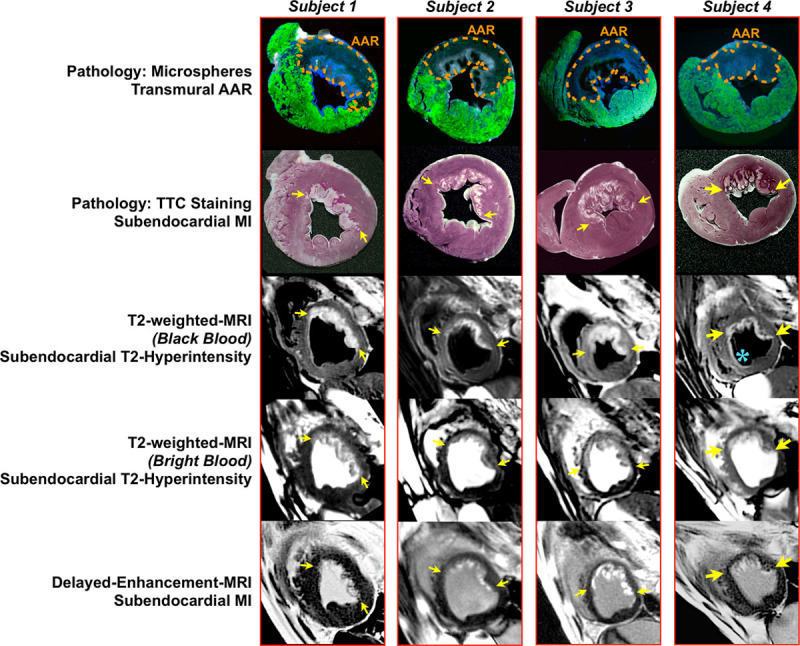
Examples of in vivo MRI compared with pathology in 4 canines. Assessment of the gross pathology under ultraviolet light (top row) shows clearly demarcated regions without fluorescent microspheres, representing the hypoperfused area-at-risk (AAR; orange outline). In these examples, the transmural-extent of the AAR is nearly 100% (ie, involves the full thickness of the wall), whereas the transmural-extent of infarction is ≈50% (second row, white regions) demonstrating salvage of the epicardial portion of the wall. Both bright-blood (fourth row) and black-blood (third row) T2-weighted MRI and delayed-enhancement MRI (bottom row) show bright regions limited primarily to the subendocardial portion of the wall (yellow arrows), clearly reflecting nontransmural involvement and discordance in shape with the true AAR. Occasionally, the endocardial border is artifactually hyperintense on black-blood T2-weighted MRI because of stagnant blood in the LV cavity (blue asterisk).
Figure 3A shows additional comparisons in one subject at multiple short-axis locations. At all locations, the shapes of T2-hyperintense regions match that of infarction, not the AAR, even when there are only tiny islands of subendocardial infarction (as shown in the most basal slice). Zoomed-in views in a subject are shown in Figure 3B. On the enlarged images, the intricate contour of the infarcted region is visible and observed to closely resemble that of T2-hyperintensity on both bright-blood and black-blood imaging. The contour of the AAR by histopathology is clearly different from that revealed by T2-hyperintensity.
Figure 3.
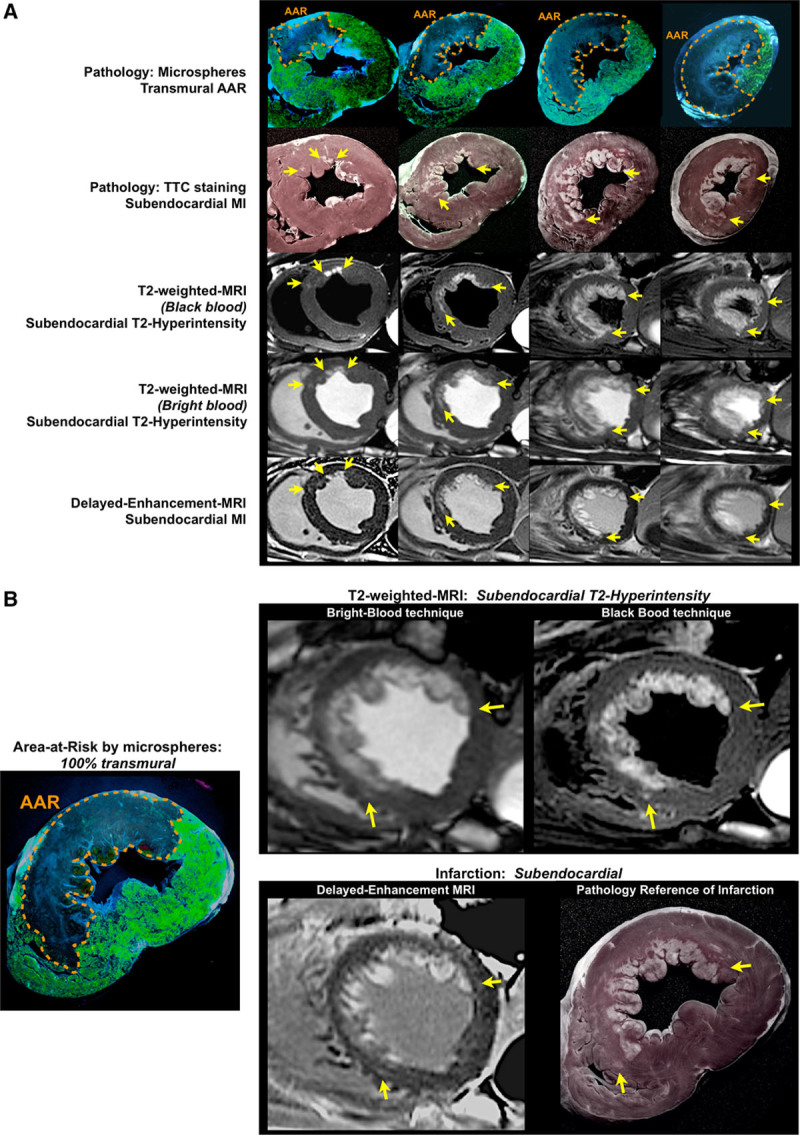
A, A comparison between MRI and pathology at multiple short-axis levels in one subject with substantial salvage. The area-at-risk (AAR) by histopathology (top row, orange outline) is nearly 100% transmural at every short-axis location, whereas T2-hyperintense (third and fourth rows) and infarcted regions (second and bottom row) are clearly nontransmural (yellow arrows). The most basal slice shows a particularly large discrepancy between the full-thickness AAR and the region of infarction, which is tiny and subendocardial. For all slices, T2-hyperintense regions closely resemble the shape of infarction not the AAR. B, Zoomed-in views in a subject. The enlarged views emphasize the irregular contour of the infarcted region, which is matched by the contour of T2-hyperintensity on both bright-blood and black-blood images.
Figure 4 summarizes the transmural-extent analyses. Figure 4A demonstrates that the transmural extent of T2-hyperintensity is unrelated to the transmural extent of the AAR defined by histopathology (bright-blood-T2: r=0.06, P=0.69; black-blood-T2: r=0.01, P=0.97). This is because the transmural extent of the AAR is consistently high (mean, 94%±6%; range, 70%–100%) and independent of that of T2-hyperintensity, which is variable (bright-blood-T2: mean, 55%±26%; range, 0%–95%; black-blood-T2: mean, 53%±25%; range, 0%–96%). Although there is no relationship with the AAR, there is a strong correlation between the transmural extent of T2-hyperintensity and that of infarction (Figure 4B) defined by histopathology (bright-blood-T2: r=0.94, P<0.0001; black-blood-T2: r=0.95, P<0.0001) or determined in vivo by delayed-enhancement MRI (bright-blood-T2: r=0.95, P<0.0001; black-blood-T2: r=0.97, P<0.0001). The regression coefficient and associated 95% confidence interval for the relationship between T2-hyperintensity and the area-at-risk did not include the line of identity, whereas in all cases, it did include the line of identity for the relationship between T2-hyperintensity and infarction. Bland–Altman analyses (Online Figure) are consistent with the regression analyses in that there is poor agreement between the transmural extent of T2-hyperintensity and the area-at-risk, whereas the agreement is far better when T2-hyperintensity is compared against infarction by pathology or delayed-enhancement MRI.
Figure 4.
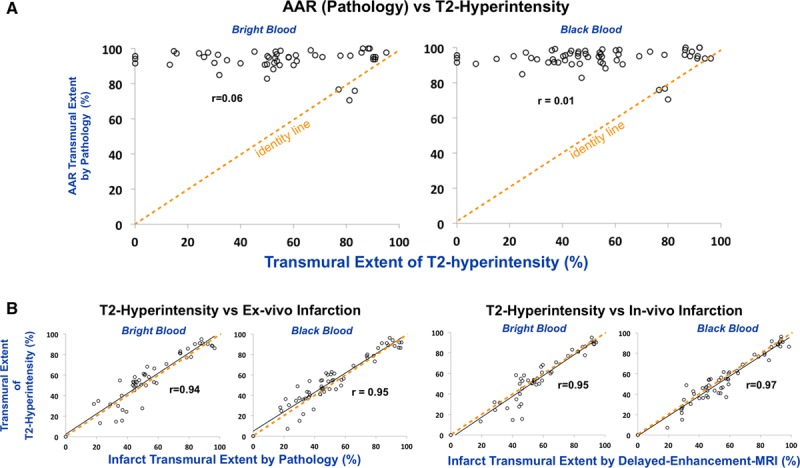
The transmural-extent of T2-hyperintensity is compared with the transmural-extent of the area-at-risk (AAR) defined by histopathology (A) and the transmural-extent of infarction (B) defined by histopathology or by in vivo delayed-enhancement MRI. Although there is no relationship with the AAR, there is a strong correlation with infarction. The orange dashed line is the line of identity.
To further examine the correlation between the transmural-extent of T2-hyperintensity with that of infarction, we tested multiple signal intensity cutpoints used to define abnormal myocardium for both T2-weighted MRI (2 and 3 SD above the mean signal of unaffected myocardium remote from MI) and delayed-enhancement MRI (2–5 SD above remote). The Online Table summarizes this analysis and shows that there is a significant correlation between the transmural extent of T2-hyperintensity and infarction by delayed-enhancement MRI for all tested thresholds (all comparisons: r≥0.79). Similarly, strong correlations were observed between both thresholds for T2-weighted MRI and infarction by pathology (all comparisons: r≥0.90), whereas no relationships were observed when compared with the area-at-risk (all comparisons: r≤0.11).
Picture Matching of Contours
We also compared the contours of abnormal regions on T2-weighted MRI and delayed-enhancement MRI in subjects with subendocardial infarction of the anterior wall at the midventricular level (Figure 5A). Although the order position of both sets were randomized before presentation to 4 blinded observers, all 4 observers provided the correct pairing in 100% of subjects solely using the contours of the bright, abnormal regions as a fingerprint comparison. Figure 5B shows 2 additional subjects with subendocardial infarction of the inferolateral wall. For images in both Figure 5A and 5B, it is evident that although the infarct contour is irregular and often intricate, it is matched by the contour of the hyperintense region on T2-weighted MRI.
Figure 5.
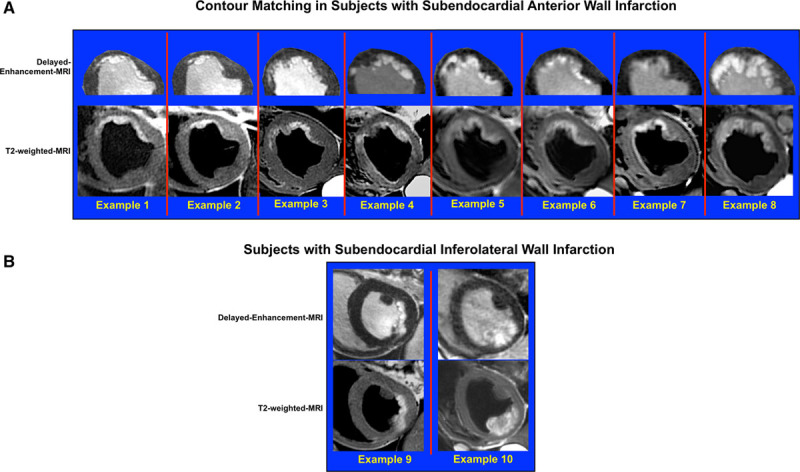
A, Image-pairs in 8 canines with subendocardial infarction of the anterior wall at the midventricular level. The order position of both sets were randomized before presentation to blinded observers to determine whether the correct order could be unscrambled (panel shows correct pairing). Also before randomization, the right ventricle, inferior half of the LV, and epicardial fat were cropped from the delayed-enhancement images to remove features that potentially could be used for matching. B, Two additional subjects with subendocardial infarction of the inferolateral wall.
Validation of Shape Analysis by Pathology
Figure 6 illustrates that comparing shape rather than size results in less ambiguity for discerning the underlying pathology. The area-at-risk should be distinct from the area of infarction; however, if true AAR size and infarct size (both by pathology) are compared, there is a significant, albeit modest correlation (left panel; % LV: r=0.45, P<0.0001; in grams of tissue: r=0.59, P<0.0001) because the infarcted region is a subset of the AAR. Conversely, there is no relationship between shapes (right panel; r=0.03, P=0.82) because the transmural extent of the AAR is consistently high, whereas the transmural extent of infarction is variable (mean, 51%±25%; range, 0%–97%). Not surprisingly, T2-hyperintensity size is correlated with both infarct size (bright-blood-T2, r=0.86; black-blood-T2, r=0.87) and AAR size (bright-blood-T2, r=0.48; black-blood-T2, r=0.48), albeit the relationship with infarct size is stronger.
Figure 6.
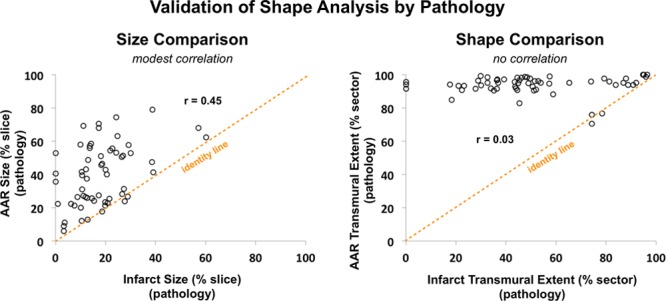
Although the area-at-risk and the area of infarction represent distinct physiological entities, there is still a modest correlation between the size of the area-at-risk (AAR) and that of infarction (left panel, r=0.45, P<0.0001; both delineated by histopathology) because infarct size is a subset of AAR size. Conversely, there is no relationship between shapes (right panel, r=0.03, P=0.82).
Patients
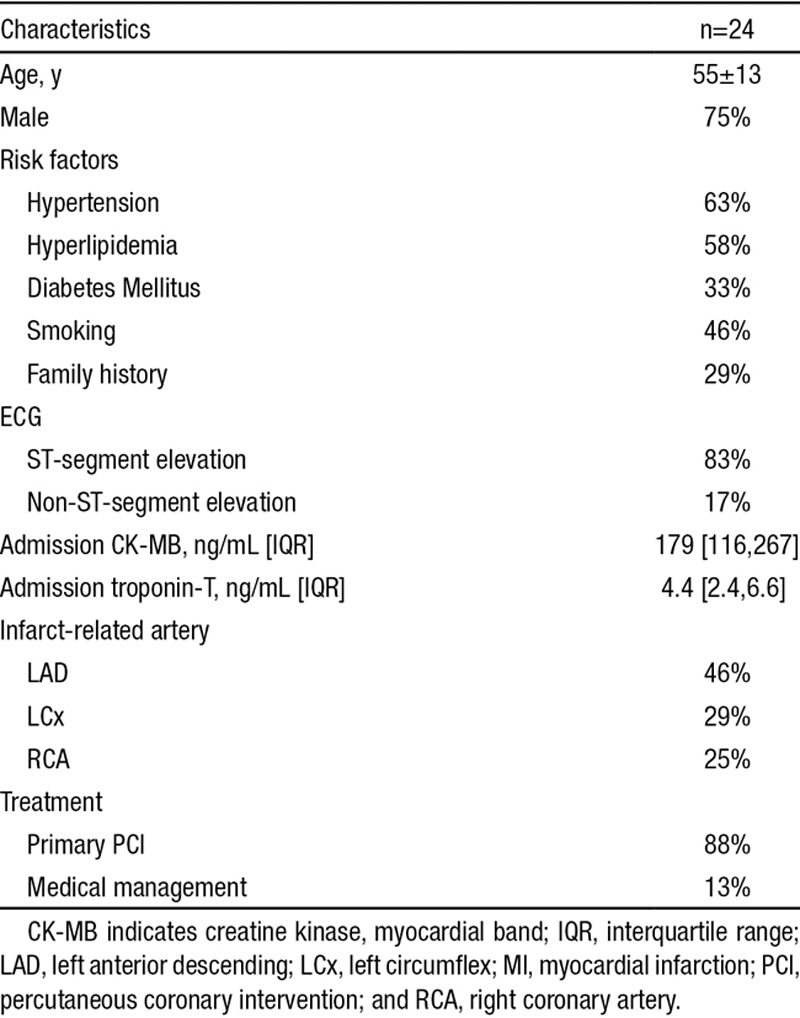
Baseline clinical characteristics are shown in the Table. No patient was excluded on the basis of image quality. Bright-blood and black-blood T2-weighted images were obtained in 17 and 24 patients, respectively. T2-hyperintensity size was modestly correlated with AAR size as estimated by BARI angiographic scores (bright-blood-T2: r=0.46, P=0.05; black-blood-T2: r=0.56, P=0.01) and modestly correlated with admission Troponin-T levels (bright-blood-T2: r=0.58, P=0.01; black-blood-T2: r=0.65, P=0.01). However, the contour of T2-hyperintense regions matched that of infarcted regions depicted by delayed-enhancement MRI (Figure 7), and there was a strong correlation between the transmural-extents (bright-blood-T2: r=0.82, P<0.0001; black-blood-T2: r=0.83, P<0.0001). When infarction was subendocardial (transmural extent <50%), T2-hyperintense regions also were limited to the subendocardium in 100% and 93% of cases for bright-blood and black-blood imaging, respectively. Thus, consistent with canines, T2-hyperintense regions in patients are often limited to the subendocardium.
Figure 7.
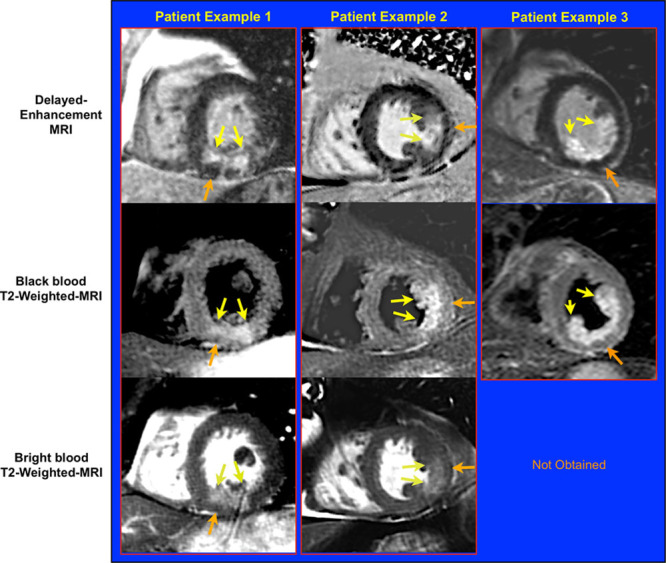
Typical images in 3 patients with acute myocardial infarction 5, 5, and 2 days after admission. In these examples, infarction by delayed-enhancement MRI is subendocardial (yellow arrows). Similarly, T2-hyperintense regions (yellow arrows, middle and bottom rows) are subendocardial and the contour closely matches that of infarction. Orange arrows point to myocardium on the epicardial half of the wall that is neither hyperenhanced on delayed-enhancement MRI nor hyperintense on T2-weighted MRI. These findings are incompatible with the concept that T2-weighted MRI portrays the area-at-risk (AAR).
Table.
Patients With Acute MI
Discussion
The ischemic area-at-risk is a fundamental concept in Cardiology. In the setting of coronary occlusion, it represents the maximum infarct size that is possible as well as the greatest amount of myocardium that is potentially salvageable with early reperfusion therapy.1 Robust approaches for assessing the AAR in vivo have been elusive. As such, reports describing the use of T2-weighted MRI to depict the AAR have been met with enthusiasm, and there has been early integration of this technique into randomized clinical trials to provide end points for determining therapeutic efficacy.2,12,13
In this study, we show that T2-weighted MRI does not depict the AAR. Instead, the data demonstrate that T2-hyperintense regions closely resemble infarcted regions in both a large animal model and in patients. Thus, the findings contradict the conventional wisdom regarding T2-weighted MRI and indicate that this method should not be used to measure myocardial salvage.
In our investigation, we performed a comparison between the shape and contour of the abnormal hyperintense region depicted by T2-weighted MRI and that of the AAR delineated by histopathology. This analysis was possible because our methodology (administration of fluorescent microspheres followed by high-resolution photography under ultraviolet light) enabled direct visualization of the true AAR (Figures 2 and 3). Prior studies did not perform comparisons with histopathology or did not use methods that permitted direct visualization of the AAR. Instead, the authors inferred that T2-weighted MRI delineates the AAR because the measured size of T2-hyperintense regions were usually larger than infarct size as determined by delayed-enhancement MRI or, more rarely, by histopathology.15,16,22,36,37
Attributing size differences in abnormal regions depicted by different imaging techniques as evidence that distinct anatomic structures are being identified is beset with concerns. The apparent size of an abnormality on MRI can change by small alterations in the methodology of analysis. For instance, changing the image intensity cutpoint used to define myocardial hyperenhancement on delayed-enhancement images can affect measured infarct size.2,38 Even when standard methods of analysis are used, different MRI techniques often result in dissimilar image characteristics and propensity for image artifacts and can lead to different measurements of the same structure. For example, it is well known that measurement of LV mass is consistently larger when assessed from spoiled gradient-echo cine sequences than from steady-state free-precession cine sequences.39 Clearly, in this situation, the difference in myocardial mass should not be ascribed to an anatomic structure. This example shows that one MRI technique may consistently provide a larger (or smaller) quantitative size measurement compared with a second MRI technique, even if both depict the same underlying anatomy.
This is why we performed picture matching of contours in our investigation, rather than relying on the size of hyperintense regions as in prior studies. The match observed between the intricate contour of T2-hyperintense regions and that of infarcted regions depicted by delayed-enhancement MRI provides a straightforward interpretation of the data. Because image artifacts, by their nature, are inherently random with regard to the contour of the true bright zone, it is nearly impossible that image artifact could lead to a fingerprint match—whereby all the nooks and crannies of 2 complex contours match—without the conclusion that the 2 sets of images portray the same underlying pathology. In contrast, it is relatively easy for artifact to change the measured size of an abnormality because this method of analysis reduces all of the information on an image to a single number. Regarding the picture matching analysis (Figure 5), the probability that all 4 blinded observers would each provide a 100% (8/8) correct pairing by chance alone is (1/8!)4=3.8×10–19.
Moreover, the relationship between the size of the AAR and the size of infarction is potentially itself a confounder. Although there is a wide range in AAR size given the natural variation in coronary artery perfusion beds,40 infarct size, by definition, is a subset of AAR size (with longer durations of ischemia leading to larger infarcts asymptotically approaching that of AAR size). Hence, it is not surprising that there is a relationship, albeit moderate, between the 2 (Figure 6, left). Conversely, no relationship exists between the transmural-extent of the AAR and that of infarction (Figure 6, right). This demonstrates that comparing shape (eg, transmural-extent) rather than size results in less ambiguity for discerning the underlying pathophysiology and was the rationale for our approach in this investigation.
We used 2 independent means to produce T2-weighted images (bright-blood with T2-prep and black-blood with turbo-spin-echo) so that findings would not be specific to a single technique. It is well-known these 2 techniques have completely different image characteristics and propensity for artifacts; hence, limitations in one should have no bearing on the findings of the other.31 Standard sequences were used for both techniques. There is no consensus in the bandwidth that should be used for black-blood imaging. We used a value (780 Hz/pixel) that is higher than in some investigations but lower than in others (eg, 930 Hz/pixel32; 798 Hz/pixel33). The procedure to optimize timing of image acquisition within the cardiac cycle was used only for black-blood imaging, and because there is no change in the actual pulse sequence (ie, no change in TR, TE, bandwidth, etc), there is no effect on myocardial T2-weighting. The consistency in observations between bright-blood and black-blood-T2 imaging, including intricate contours that precisely match each other and closely resemble the histopathology (Figures 2, 3A, and 3B), indicate the optimization protocol was successful in improving image quality for black-blood T2-weighted MRI and further corroborates our conclusion that T2-weighted MRI depicts MI and not the area-at-risk.
We note that the original study in canines by Aletras et al15 performed T2-weighted imaging at 2 days after acute MI and the first study in patients by Friedrich et al16 performed imaging at 3±3 days. Moreover, many randomized trials using T2-weighted-MRI as an efficacy end point performed MRI 3 to 5 days after MI.27–30 Because, in the current investigation, canines were imaged at 4±1 days after acute MI and patients at 3±1 days, we believe our findings inform on these prior reports.
Our results are perhaps not entirely unforeseen. The use of T2-weighted MRI to delineate the AAR does not have a clear pathophysiological basis.2 Seminal studies by Jennings et al19,41,42 have carefully measured water content in myocardium reversibly and irreversibly damaged by ischemia. These direct measurements (not based on MRI) have established that substantial edema only occurs in infarcted myocardium. There is a small increase in tissue water content after reversible ischemic injury (0%–9%41), but any measurable edema is expected to resolve within 24 hours.42 Based on these studies, the difference in edema between infarcted and salvaged portions of the AAR should be at least 9-fold.2 Because of the conundrum concerning the lack of measurable edema in salvaged myocardium, it has been proposed that there are changes in fractions of water species (bound, gel-like water versus free water) that can affect T2 even without any increase in tissue water content.4 However, recent studies examining protein hydration dynamics indicate there is little difference between water molecules in the hydration layer of a dissolved protein and those in bulk water either in a thermodynamic or kinetic sense.43 Hence, characterizations of ischemia as somehow transforming water from gel-like to free or causing water release from cellular proteins4 seem unsound. On the other hand, the studies directly measuring myocardial water content, which show substantial edema in infarcted myocardium and little or no measurable edema in salvaged myocardium, provide a clear pathophysiologic mechanism for T2-weighted MRI to delineate acute MI.
There are several implications of our study. First, we believe that conclusions regarding the efficacy of novel acute MI therapies in current and past studies that are based on T2-weighted-MRI measurements of myocardial salvage should be re-examined. This includes not only large-scale multicenter trials, but also preclinical studies where in vivo imaging results may be the primary basis for proceeding with a large capital expenditure or abandoning an otherwise promising approach. Concerns are also raised for recent investigations that purport to elucidate pathophysiologic mechanisms of disease on the basis of black-blood T2-weighted MRI. These involve high-profile and controversial disorders, including Takotsubo cardiomyopathy,44 alcohol-induced myocardial inflammation caused by binge-drinking,45 and heart damage—albeit temporary—caused by marathon running.46 Given the propensity of signal-loss artifact to confound interpretation with black-blood T2-weighted MRI (see Figure 1), we believe it is premature to use this technique to conclude that there is myocardial edema in the absence of infarction (or necrosis) in these or other cardiac disorders without corroborating evidence from an appropriate pathology-based reference standard.
In summary, we describe the first direct comparison between T2-weighted MRI and the true AAR delineated by histopathology. The images show a fingerprint match between the contour of T2-hyperintensity and that of acute infarction—not the AAR. Hence, we believe the use of T2-weighted MRI to measure the AAR or to index myocardial salvage is unsound, and conclusions previously based on this premise in clinical practice, multicenter trials, and basic investigations should be re-examined.
Sources of Funding
US National Institute of Health grant NIH-NHLBI R01-HL64726 (R.J. Kim). There was no industry support for this study, nor was there any industry role in the design, conduct, or any other part of the study.
Disclosures
Drs R.J. Kim and R.M. Judd are inventors on a US patent on delayed-enhancement MRI owned by Northwestern University. Dr W. Rehwald is employed by Siemens Healthcare. The other authors report no conflicts.
Supplementary Material
Nonstandard Abbreviations and Acronyms
- AAR
- area-at-risk
- LV
- left ventricle
- MI
- myocardial infarction
- SD
- standard deviation
In April 2015, the average time from submission to first decision for all original research papers submitted to Circulation Research was 13.84 days.
The online-only Data Supplement is available with this article at http://circres.ahajournals.org/lookup/suppl/doi:10.1161/CIRCRESAHA.117.305771/-/DC1.
Novelty and Significance
What Is Known?
After acute myocardial infarction, delineating the area-at-risk is crucial for determining myocardial salvage, the efficacy of reperfusion therapy, and prognosis.
T2-weighted MRI is currently believed to be an excellent method for delineating the myocardial area-at-risk.
The evidence supporting the validity of T2-weighted MRI to measure the area-at-risk is indirect, and it has never been validated with direct anatomic measurements.
What New Information Does This Article Contribute?
A direct comparison of the shape and contour of abnormal regions depicted by T2-weighted-MRI with the shape and contour of the area-at-risk as determined by anatomic pathology in a canine model of acute MI.
The shape and contour of the abnormal regions depicted by T2-weighted-MRI did not correspond to the area-at-risk; instead there was a fingerprint match with the intricate contour of myocardial infarction in both canines and patients.
Measurements of the ischemic area-at-risk are essential for estimating myocardial salvage and for subsequent therapy and prognosis. T2-weighted MRI is a new approach to depict the area-at-risk, and it has been used in randomized trials of patients with acute MI to provide an end point of therapeutic efficacy. However, the pathophysiologic underpinnings of T2-weighted MRI remain unclear, and the technique has not been validated with direct anatomic measurements. In this study, the intricate contour of T2 hyperintense regions are compared with corresponding high-resolution photographs of the area-at-risk and the infarcted region determined by histopathology. Additionally, direct comparisons are made to the shape of infarction delineated in vivo with delayed-enhancement MRI. These data demonstrate that T2-weighted MRI does not depict the area-at-risk; instead, there was a fingerprint match between the contour of the T2-hyperintense region and the contour of the infarcted region. These findings question the use of T2-weighted MRI to measure the area-at-risk or to index myocardial salvage; and therefore, conclusions previously based on this premise in clinical practice, multicenter trials, and basic investigations should be re-examined.
References
- 1.Reimer KA, Jennings RB. The “wavefront phenomenon” of myocardial ischemic cell death. II. Transmural progression of necrosis within the framework of ischemic bed size (myocardium at risk) and collateral flow. Lab Invest. 1979;40:633–644. [PubMed] [Google Scholar]
- 2.Croisille P, Kim HW, Kim RJ. Controversies in cardiovascular MR imaging: T2-weighted imaging should not be used to delineate the area at risk in ischemic myocardial injury. Radiology. 2012;265:12–22. doi: 10.1148/radiol.12111769. doi: 10.1148/radiol.12111769. [DOI] [PubMed] [Google Scholar]
- 3.Heusch G. Cardioprotection: chances and challenges of its translation to the clinic. Lancet. 2013;381:166–175. doi: 10.1016/S0140-6736(12)60916-7. doi: 10.1016/S0140-6736(12)60916-7. [DOI] [PubMed] [Google Scholar]
- 4.Friedrich MG. Myocardial edema–a new clinical entity? Nat Rev Cardiol. 2010;7:292–296. doi: 10.1038/nrcardio.2010.28. doi: 10.1038/nrcardio.2010.28. [DOI] [PubMed] [Google Scholar]
- 5.Eitel I, Friedrich MG. T2-weighted cardiovascular magnetic resonance in acute cardiac disease. J Cardiovasc Magn Reson. 2011;13:13. doi: 10.1186/1532-429X-13-13. doi: 10.1186/1532-429X-13-13. [DOI] [PMC free article] [PubMed] [Google Scholar]
- 6.Dall’Armellina E, Karamitsos TD, Neubauer S, Choudhury RP. CMR for characterization of the myocardium in acute coronary syndromes. Nat Rev Cardiol. 2010;7:624–636. doi: 10.1038/nrcardio.2010.140. doi: 10.1038/nrcardio.2010.140. [DOI] [PubMed] [Google Scholar]
- 7.Schwitter J, Arai AE. Assessment of cardiac ischaemia and viability: role of cardiovascular magnetic resonance. Eur Heart J. 2011;32:799–809. doi: 10.1093/eurheartj/ehq481. doi: 10.1093/eurheartj/ehq481. [DOI] [PMC free article] [PubMed] [Google Scholar]
- 8.Stillman AE, Oudkerk M, Bluemke D, et al. North American Society of Cardiovascular Imaging; European Society of Cardiac Radiology. Assessment of acute myocardial infarction: current status and recommendations from the North American society for Cardiovascular Imaging and the European Society of Cardiac Radiology. Int J Cardiovasc Imaging. 2011;27:7–24. doi: 10.1007/s10554-010-9714-0. doi: 10.1007/s10554-010-9714-0. [DOI] [PMC free article] [PubMed] [Google Scholar]
- 9.Perazzolo Marra M, Lima JA, Iliceto S. MRI in acute myocardial infarction. Eur Heart J. 2011;32:284–293. doi: 10.1093/eurheartj/ehq409. doi: 10.1093/eurheartj/ehq409. [DOI] [PubMed] [Google Scholar]
- 10.Lockie T, Nagel E, Redwood S, Plein S. Use of cardiovascular magnetic resonance imaging in acute coronary syndromes. Circulation. 2009;119:1671–1681. doi: 10.1161/CIRCULATIONAHA.108.816512. doi: 10.1161/CIRCULATIONAHA.108.816512. [DOI] [PMC free article] [PubMed] [Google Scholar]
- 11.Raman SV, Ambrosio G. T2-cardiac magnetic resonance: has Elvis left the building? Circ Cardiovasc Imaging. 2011;4:198–200. doi: 10.1161/CIRCIMAGING.111.965343. doi: 10.1161/CIRCIMAGING.111.965343. [DOI] [PubMed] [Google Scholar]
- 12. Clinicaltrials.Gov. http://clinicaltrials.gov/. Accessed May 29, 2013. Search terms with Boolean operators: ((T2 OR salvage) AND (magnetic OR mri OR cmr) AND (heart OR myocardium)) OR (magnetic AND myocardial infarction). Entries were examined before inclusion.
- 13.Current Controlled Trials. http://www.controlled-trials.com/. Accessed May 29, 2013. Search terms with Boolean operators: ((T2 OR salvage) AND (magnetic OR mri OR cmr) AND (heart OR myocardium)) OR (magnetic AND myocardial infarction). Entries were examined before inclusion.
- 14.Wince WB, Kim RJ. Molecular imaging: T2-weighted CMR of the area at risk–a risky business? Nat Rev Cardiol. 2010;7:547–549. doi: 10.1038/nrcardio.2010.124. doi: 10.1038/nrcardio.2010.124. [DOI] [PubMed] [Google Scholar]
- 15.Aletras AH, Tilak GS, Natanzon A, Hsu LY, Gonzalez FM, Hoyt RF, Jr, Arai AE. Retrospective determination of the area at risk for reperfused acute myocardial infarction with T2-weighted cardiac magnetic resonance imaging: histopathological and displacement encoding with stimulated echoes (DENSE) functional validations. Circulation. 2006;113:1865–1870. doi: 10.1161/CIRCULATIONAHA.105.576025. doi: 10.1161/CIRCULATIONAHA.105.576025. [DOI] [PubMed] [Google Scholar]
- 16.Friedrich MG, Abdel-Aty H, Taylor A, Schulz-Menger J, Messroghli D, Dietz R. The salvaged area at risk in reperfused acute myocardial infarction as visualized by cardiovascular magnetic resonance. J Am Coll Cardiol. 2008;51:1581–1587. doi: 10.1016/j.jacc.2008.01.019. doi: 10.1016/j.jacc.2008.01.019. [DOI] [PubMed] [Google Scholar]
- 17.Dall’Armellina E, Karia N, Lindsay AC, Karamitsos TD, Ferreira V, Robson MD, Kellman P, Francis JM, Forfar C, Prendergast BD, Banning AP, Channon KM, Kharbanda RK, Neubauer S, Choudhury RP. Dynamic changes of edema and late gadolinium enhancement after acute myocardial infarction and their relationship to functional recovery and salvage index. Circ Cardiovasc Imaging. 2011;4:228–236. doi: 10.1161/CIRCIMAGING.111.963421. doi: 10.1161/CIRCIMAGING.111.963421. [DOI] [PMC free article] [PubMed] [Google Scholar]
- 18.Haendchen RV, Corday E, Torres M, Maurer G, Fishbein MC, Meerbaum S. Increased regional end-diastolic wall thickness early after reperfusion: a sign of irreversibly damaged myocardium. J Am Coll Cardiol. 1984;3:1444–1453. doi: 10.1016/s0735-1097(84)80283-1. [DOI] [PubMed] [Google Scholar]
- 19.Jennings RB, Schaper J, Hill ML, Steenbergen C, Jr, Reimer KA. Effect of reperfusion late in the phase of reversible ischemic injury. Changes in cell volume, electrolytes, metabolites, and ultrastructure. Circ Res. 1985;56:262–278. doi: 10.1161/01.res.56.2.262. [DOI] [PubMed] [Google Scholar]
- 20.Mewton N, Rapacchi S, Augeul L, Ferrera R, Loufouat J, Boussel L, Micolich A, Rioufol G, Revel D, Ovize M, Croisille P. Determination of the myocardial area at risk with pre- versus post-reperfusion imaging techniques in the pig model. Basic Res Cardiol. 2011;106:1247–1257. doi: 10.1007/s00395-011-0214-8. doi: 10.1007/s00395-011-0214-8. [DOI] [PubMed] [Google Scholar]
- 21.Fernández-Jiménez R, Sánchez-González J, Agüero J, et al. Myocardial edema after ischemia/reperfusion is not stable and follows a bimodal pattern: imaging and histological tissue characterization. J Am Coll Cardiol. 2015;65:315–323. doi: 10.1016/j.jacc.2014.11.004. doi: 10.1016/j.jacc.2014.11.004. [DOI] [PubMed] [Google Scholar]
- 22.Ugander M, Bagi PS, Oki AJ, Chen B, Hsu LY, Aletras AH, Shah S, Greiser A, Kellman P, Arai AE. Myocardial edema as detected by pre-contrast T1 and T2 CMR delineates area at risk associated with acute myocardial infarction. JACC Cardiovasc Imaging. 2012;5:596–603. doi: 10.1016/j.jcmg.2012.01.016. doi: 10.1016/j.jcmg.2012.01.016. [DOI] [PMC free article] [PubMed] [Google Scholar]
- 23.Kim RJ, Fieno DS, Parrish TB, Harris K, Chen EL, Simonetti O, Bundy J, Finn JP, Klocke FJ, Judd RM. Relationship of MRI delayed contrast enhancement to irreversible injury, infarct age, and contractile function. Circulation. 1999;100:1992–2002. doi: 10.1161/01.cir.100.19.1992. [DOI] [PubMed] [Google Scholar]
- 24.Position of the American Heart Association on the use of research animals. A statement for health professionals from a task force appointed by the Board of Directors of the American Heart Association. Circ Res. 1985;57:330–331. doi: 10.1161/01.res.57.2.330. [DOI] [PubMed] [Google Scholar]
- 25.Fieno DS, Kim RJ, Chen EL, Lomasney JW, Klocke FJ, Judd RM. Contrast-enhanced magnetic resonance imaging of myocardium at risk: distinction between reversible and irreversible injury throughout infarct healing. J Am Coll Cardiol. 2000;36:1985–1991. doi: 10.1016/s0735-1097(00)00958-x. [DOI] [PubMed] [Google Scholar]
- 26.Reimer KA, Lowe JE, Rasmussen MM, Jennings RB. The wavefront phenomenon of ischemic cell death. 1. Myocardial infarct size vs duration of coronary occlusion in dogs. Circulation. 1977;56:786–794. doi: 10.1161/01.cir.56.5.786. [DOI] [PubMed] [Google Scholar]
- 27.Janssens S, Dubois C, Bogaert J, et al. Autologous bone marrow-derived stem-cell transfer in patients with ST-segment elevation myocardial infarction: double-blind, randomised controlled trial. Lancet. 2006;367:113–121. doi: 10.1016/S0140-6736(05)67861-0. doi: 10.1016/S0140-6736(05)67861-0. [DOI] [PubMed] [Google Scholar]
- 28.Patel MR, Smalling RW, Thiele H, Barnhart HX, Zhou Y, Chandra P, Chew D, Cohen M, French J, Perera D, Ohman EM. Intra-aortic balloon counterpulsation and infarct size in patients with acute anterior myocardial infarction without shock: the CRISP AMI randomized trial. JAMA. 2011;306:1329–1337. doi: 10.1001/jama.2011.1280. doi: 10.1001/jama.2011.1280. [DOI] [PubMed] [Google Scholar]
- 29.Atar D, Arheden H, Berdeaux A, et al. Effect of intravenous TRO40303 as an adjunct to primary percutaneous coronary intervention for acute ST-elevation myocardial infarction: MITOCARE study results. Eur Heart J. 2015;36:112–119. doi: 10.1093/eurheartj/ehu331. doi: 10.1093/eurheartj/ehu331. [DOI] [PubMed] [Google Scholar]
- 30.Eitel I, Wöhrle J, Suenkel H, et al. Intracoronary compared with intravenous bolus abciximab application during primary percutaneous coronary intervention in ST-segment elevation myocardial infarction: cardiac magnetic resonance substudy of the AIDA STEMI trial. J Am Coll Cardiol. 2013;61:1447–1454. doi: 10.1016/j.jacc.2013.01.048. doi: 10.1016/j.jacc.2013.01.048. [DOI] [PubMed] [Google Scholar]
- 31.Kellman P, Aletras AH, Mancini C, McVeigh ER, Arai AE. T2-prepared SSFP improves diagnostic confidence in edema imaging in acute myocardial infarction compared to turbo spin echo. Magn Reson Med. 2007;57:891–897. doi: 10.1002/mrm.21215. doi: 10.1002/mrm.21215. [DOI] [PMC free article] [PubMed] [Google Scholar]
- 32.Verhaert D, Thavendiranathan P, Giri S, Mihai G, Rajagopalan S, Simonetti OP, Raman SV. Direct T2 quantification of myocardial edema in acute ischemic injury. JACC Cardiovasc Imaging. 2011;4:269–278. doi: 10.1016/j.jcmg.2010.09.023. doi: 10.1016/j.jcmg.2010.09.023. [DOI] [PMC free article] [PubMed] [Google Scholar]
- 33.Aletras AH, Kellman P, Derbyshire JA, Arai AE. ACUT2E TSE-SSFP: a hybrid method for T2-weighted imaging of edema in the heart. Magn Reson Med. 2008;59:229–235. doi: 10.1002/mrm.21490. doi: 10.1002/mrm.21490. [DOI] [PubMed] [Google Scholar]
- 34.Thygesen K, Alpert JS, Jaffe AS, et al. Joint ESC/ACCF/AHA/WHF Task Force for Universal Definition of Myocardial Infarction; Authors/Task Force Members Chairpersons; Biomarker Subcommittee; ECG Subcommittee; Imaging Subcommittee; Classification Subcommittee; Intervention Subcommittee; Trials & Registries Subcommittee; Trials & Registries Subcommittee; Trials & Registries Subcommittee; Trials & Registries Subcommittee; ESC Committee for Practice Guidelines (CPG); Document Reviewers. Third universal definition of myocardial infarction. J Am Coll Cardiol. 2012;60:1581–1598. doi: 10.1016/j.jacc.2012.08.001. [Google Scholar]
- 35.Alderman EM, Stadius ML. The angiographic definitions of the bypass angioplasty revascularization investigation. Coron Artery Dis. 1992;3:1198–1207. [Google Scholar]
- 36.Berry C, Kellman P, Mancini C, Chen MY, Bandettini WP, Lowrey T, Hsu LY, Aletras AH, Arai AE. Magnetic resonance imaging delineates the ischemic area at risk and myocardial salvage in patients with acute myocardial infarction. Circ Cardiovasc Imaging. 2010;3:527–535. doi: 10.1161/CIRCIMAGING.109.900761. doi: 10.1161/CIRCIMAGING.109.900761. [DOI] [PMC free article] [PubMed] [Google Scholar]
- 37.Carlsson M, Ubachs JF, Hedström E, Heiberg E, Jovinge S, Arheden H. Myocardium at risk after acute infarction in humans on cardiac magnetic resonance: quantitative assessment during follow-up and validation with single-photon emission computed tomography. JACC Cardiovasc Imaging. 2009;2:569–576. doi: 10.1016/j.jcmg.2008.11.018. doi: 10.1016/j.jcmg.2008.11.018. [DOI] [PubMed] [Google Scholar]
- 38.Kim HW, Farzaneh-Far A, Kim RJ. Cardiovascular magnetic resonance in patients with myocardial infarction: current and emerging applications. J Am Coll Cardiol. 2009;55:1–16. doi: 10.1016/j.jacc.2009.06.059. doi: 10.1016/j.jacc.2009.06.059. [DOI] [PubMed] [Google Scholar]
- 39.Moon JC, Lorenz CH, Francis JM, Smith GC, Pennell DJ. Breath-hold FLASH and FISP cardiovascular MR imaging: left ventricular volume differences and reproducibility. Radiology. 2002;223:789–797. doi: 10.1148/radiol.2233011181. doi: 10.1148/radiol.2233011181. [DOI] [PubMed] [Google Scholar]
- 40.Lee JT, Ideker RE, Reimer KA. Myocardial infarct size and location in relation to the coronary vascular bed at risk in man. Circulation. 1981;64:526–534. doi: 10.1161/01.cir.64.3.526. [DOI] [PubMed] [Google Scholar]
- 41.Whalen DA, Jr, Hamilton DG, Ganote CE, Jennings RB. Effect of a transient period of ischemia on myocardial cells. I. Effects on cell volume regulation. Am J Pathol. 1974;74:381–397. [PMC free article] [PubMed] [Google Scholar]
- 42.Jennings RB, Murry C, Reimer KA. Myocardial effects of brief periods of ischemia followed by reperfusion. Adv Cardiol. 1990;37:7–31. doi: 10.1159/000418813. [DOI] [PubMed] [Google Scholar]
- 43.Halle B. Protein hydration dynamics in solution: a critical survey. Philos Trans R Soc Lond B Biol Sci. 2004;359:1207–23; discussion 1223. doi: 10.1098/rstb.2004.1499. doi: 10.1098/rstb.2004.1499. [DOI] [PMC free article] [PubMed] [Google Scholar]
- 44.Eitel I, von Knobelsdorff-Brenkenhoff F, Bernhardt P, Carbone I, Muellerleile K, Aldrovandi A, Francone M, Desch S, Gutberlet M, Strohm O, Schuler G, Schulz-Menger J, Thiele H, Friedrich MG. Clinical characteristics and cardiovascular magnetic resonance findings in stress (takotsubo) cardiomyopathy. JAMA. 2011;306:277–286. doi: 10.1001/jama.2011.992. doi: 10.1001/jama.2011.992. [DOI] [PubMed] [Google Scholar]
- 45.Zagrosek A, Messroghli D, Schulz O, Dietz R, Schulz-Menger J. Effect of binge drinking on the heart as assessed by cardiac magnetic resonance imaging. JAMA. 2010;304:1328–1330. doi: 10.1001/jama.2010.1343. doi: 10.1001/jama.2010.1343. [DOI] [PubMed] [Google Scholar]
- 46.Gaudreault V, Tizon-Marcos H, Poirier P, Pibarot P, Gilbert P, Amyot M, Rodés-Cabau J, Després JP, Bertrand O, Larose E. Transient myocardial tissue and function changes during a marathon in less fit marathon runners. Can J Cardiol. 2013;29:1269–1276. doi: 10.1016/j.cjca.2013.04.022. doi: 10.1016/j.cjca.2013.04.022. [DOI] [PubMed] [Google Scholar]