Abstract
Objective:
To investigate the role of known multiple sclerosis (MS)-associated genetic variants in MS familial aggregation, clinical expression, and accuracy of disease prediction in sporadic and familial cases.
Methods:
A total of 1,443 consecutive patients were screened for MS and familial autoimmune history in a hospital-based Italian cohort. Among them, 461 sporadic and 93 familial probands were genotyped for 107 MS-associated polymorphisms. Their effect sizes were combined to calculate the weighted genetic risk score (wGRS).
Results:
Family history of MS was reported by 17.2% of probands, and 33.8% reported a familial autoimmune disorder, with autoimmune thyroiditis and psoriasis being the most frequent. No difference in wGRS was observed between sporadic and familial MS cases. In contrast, a lower wGRS was observed in probands with greater familial aggregation (>1 first-degree relative or >2 relatives with MS) (p = 0.03). Also, female probands of familial cases with greater familial aggregation had a lower wGRS than sporadic cases (p = 0.0009) and male probands of familial cases (p = 0.04). An inverse correlation between wGRS and age at onset was observed (p = 0.05). The predictive performance of the genetic model including all known MS variants was modest but greater in sporadic vs familial cases (area under the curve = 0.63 and 0.57).
Conclusions:
Additional variants outside the known MS-associated loci, rare variants, and/or environmental factors may explain disease occurrence within families; in females, hormonal and epigenetic factors probably have a predominant role in explaining familial aggregation. The inclusion of these additional factors in future versions of aggregated genetic measures could improve their predictive ability.
Multiple sclerosis (MS) is an inflammatory disease of the CNS caused by the interaction between genetic and nongenetic risk factors.1
Nowadays, the association between the major histocompatibility complex (MHC) region and MS is well-established.2,3 Very recently, knowledge about MS-associated genetic variants has increased thanks to genome-wide association studies (GWAS) that validated the effect of 103 non-MHC loci in the genetic architecture of the disease.4,5 The majority of non-MHC risk loci have known immunologic functions, and some of them are also shared across different autoimmune diseases (AIDs). Moreover, MS can coexist with other AIDs within individuals and their families,6 suggesting a shared genetic architecture between MS and other AIDs.7
Taken one by one, MS-associated loci make a very small contribution to disease risk. The combined aggregation of genetic variants is a simple measure to explore the influence of the cumulative genetic burden on disease susceptibility and clinical expression.
In the present study, we investigated the role of the established MS loci in explaining the familial aggregation for MS in a single-center, hospital-based Italian cohort. For this purpose, a cohort of ∼1,500 patients was screened for familial aggregation of MS and AIDs, and in a subset the weighted genetic risk score (wGRS) was calculated to take into account the combined influence of the susceptibility loci on MS familial aggregation. As secondary and tertiary outcomes, we investigated the impact of these genetic variants in explaining the clinical disease characteristics and their predictive capability on disease status.
METHODS
Patient screening.
Between July and December 2011, consecutive Italian patients with MS (diagnosed according to McDonald criteria and further revisions8,9) who had had at least one appointment at San Raffaele Hospital (OSR) MS center were screened for familial history of MS and/or AIDs. A structured questionnaire was administered during an outpatient visit to all patients willing to participate in the study. Specifically, we assessed for familial history of MS, clinically isolated syndrome, and the following AIDs: insulin-dependent diabetes mellitus (IDDM), inflammatory bowel diseases (IBDs), autoimmune thyroiditis (AT), rheumatoid arthritis (RA), systemic lupus erythematosus (SLE), psoriasis, celiac disease (CD), and neuromyelitis optica spectrum disorder. An open question regarding the occurrence of other AIDs was also included.
Probands with at least one relative affected by MS were defined as patients with familial MS (fMS), whereas probands without any familial history of the disease were defined as patients with sporadic MS (sMS). For each patient with fMS, we defined the number and the degree of kinship of affected relatives. For each proband, we screened for the number of relatives affected by AIDs and their degree of kinship. We also calculated the recurrence risk ratio of siblings for MS, the lambda siblings (λs), which is the ratio between the risk of disease in siblings of an affected individual and the disease population prevalence, estimated at 100/100,000 in Italy.10
In addition, the following clinical and paraclinical information was collected when available: age at visit, age at disease onset (AAO), sex, disease duration, clinical course, Expanded Disability Status Scale (EDSS) score, MS Severity Score (MSSS), and oligoclonal band (OCB) status.
Genotyping data and wGRS calculation.
Among the screened patients, genotyping data were already available for 554 patients. Of these, 104 patients were genotyped at the Wellcome Trust Sanger Institute using the Illumina Human660-Quad chip.5 248 additional cases were genotyped using the Illumina OmniExpress array at OSR11; the remaining 202 patients were genotyped using Illumina HumanOmni2.5 arrays.
A cohort of 258 Italian healthy controls (HC) recruited at OSR MS center were also included in the analyses. These individuals did not have any degree of kinship with the patients with MS enrolled in the study and they did not have a known familial history for MS. They were genotyped using the Illumina OmniExpress array at OSR.12
The wGRS was calculated as previously described,11 combining the odds ratio of 106 non–human leukocyte antigen (HLA) MS variants (table e-1 at Neurology.org/nn)4,5 and one tagging single nucleotide polymorphism (SNP) for the HLA-DRB1*1501 allele. Quality controls were performed as described elsewhere.5,12 Whenever a specific SNP was absent in one of the arrays, the best available proxy according to HapMap release 24 was considered for the analyses; in this case, the r2 value between the original and proxy SNP was included in the wGRS calculation. The score was also calculated after the exclusion of the HLA polymorphism in order to evaluate the contribution of non-HLA risk variants (wGRS–non-HLA). For the HLA-DRB1*1501 allele, since the tagging SNP rs313538813 was not available on used arrays, the best available proxy (rs9271366) was chosen (r2 = 0.974, D' = 1.0 according to HapMap release 24). Patients with genotypes with more than 10% missing were excluded; patients with genotypes with less than 10% missing were included in the analysis, setting the missing SNPs as heterozygous.
Receiver operating characteristic (ROC) curves were computed to assess the wGRS performance in discriminating between cases and controls, and the area under the curve (AUC) was calculated. Differences in the predictive performance of the genetic models were tested using the DeLong test for correlated ROC curves in the R package “pROC.” Statistical analyses were performed using the nonparametric Mann-Whitney test and the Pearson correlation implemented in GraphPad software v.5.
Standard protocol approvals, registrations, and patient consents.
The study was approved by the institutional ethics committee (“NEUFAM-01” and “NEUFAM02” protocol). Each enrolled patient agreed to participate in the study by signing the informed consent. Blood sample collection was performed after the consent form was signed.
RESULTS
Familial aggregation for MS and AIDs.
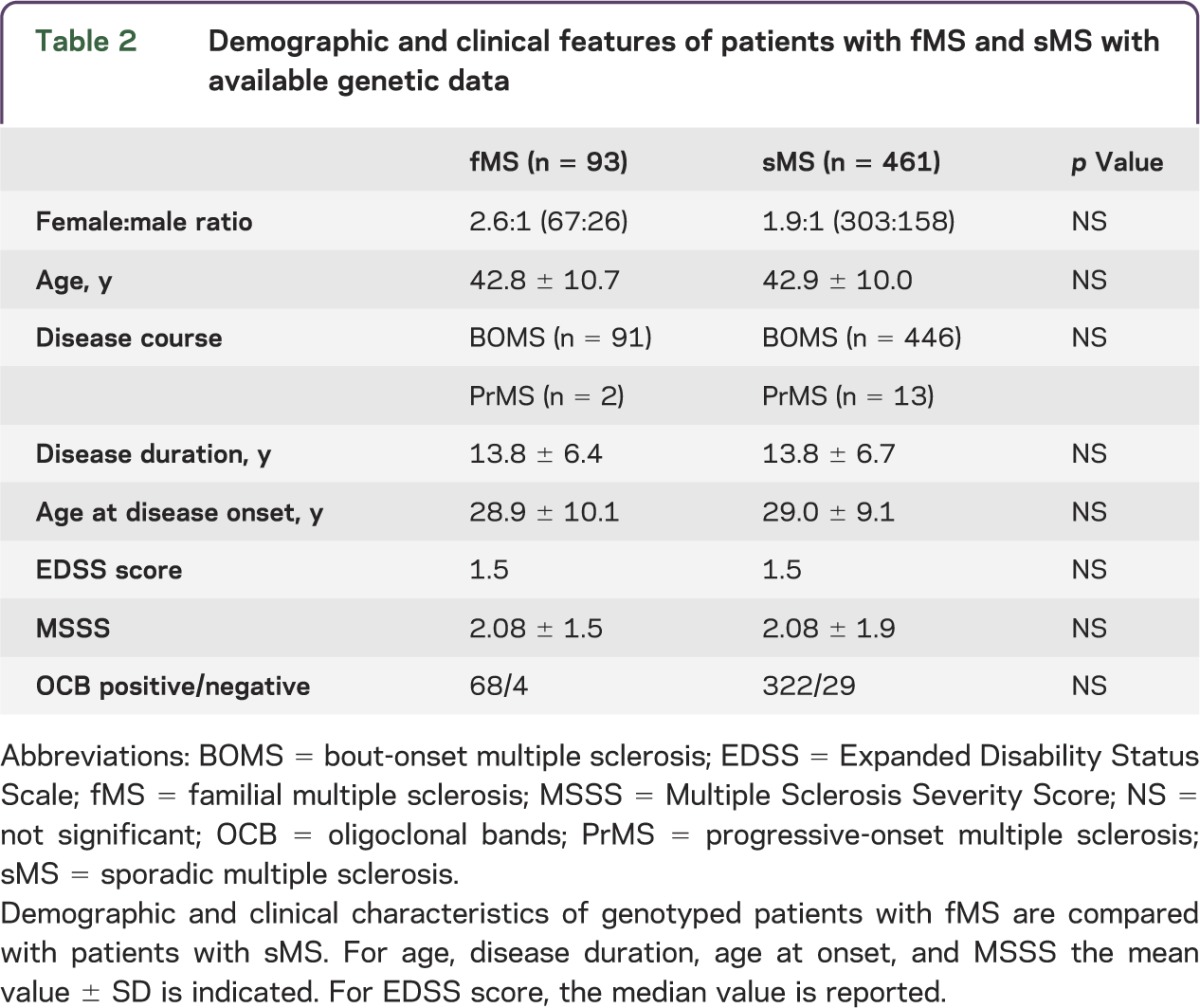
A total of 1,443 Italian patients with MS were screened using a structured questionnaire in order to assess the occurrence of MS and/or any other AID within the family. The participation rate was 96.2%. A total of 248 probands (17.2%) reported another family member affected by MS (fMS). Among them, 202 (81.5%) had 1 affected relative, 39 (15.7%) had 2 affected relatives, 6 (2.4%) had 3 affected relatives, and 1 (0.4%) had 5 affected relatives. Demographic and clinical characteristics of the cohort are reported in table 1. The subset of patients with available genotyping data (n = 554) was older and had longer disease duration and less severe disease than the entire screened cohort. However, the genotyped patients were representative of the entire population followed at OSR (n = 2,500) in terms of age, sex, disease course, disease duration, EDSS score, and disease severity. When considering genotyped patients with MS, we observed no differences between fMS (n = 93) and sMS (n = 461) in terms of sex, age, AAO, disease duration, disease severity, or OCB status. These characteristics are reported in table 2 and are in line with data from the literature.14
Table 1.
Demographic and clinical features of the studied cohort
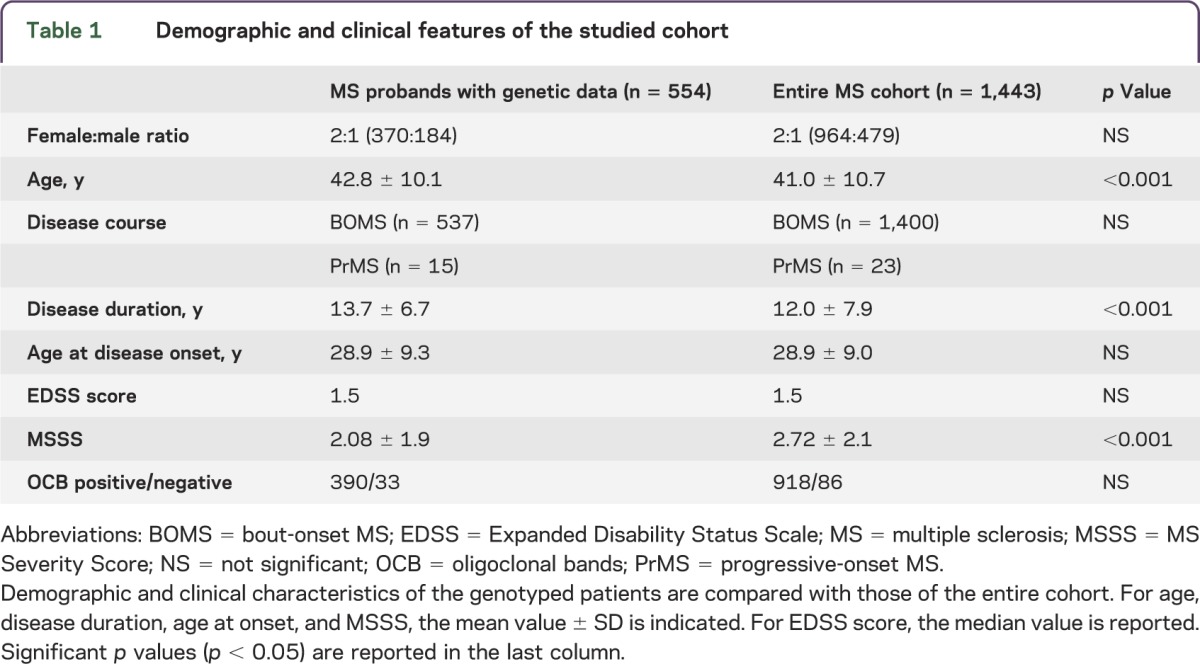
Table 2.
Demographic and clinical features of patients with fMS and sMS with available genetic data
Based on the information available for each proband, the crude recurrence risk ratio of siblings15 for MS was calculated. Considering an MS prevalence of 1/1,000 in Italy, the estimate of λs was 23.3, in line with what has been reported previously in the literature.16
Regarding the aggregation for AIDs, 33.8% of patients (n = 488) reported a family history of autoimmunity. Specifically, 290 (59.5%) had 1 relative, 105 (21.5%) had 2 relatives, 25 (5.1%) had 3 relatives, 5 (1%) had 4 relatives, and 5 (1%) had 5 or more relatives affected by AIDs. The remaining 58 probands (11.9%) did not report the exact number of relatives affected by AIDs. The distribution of AIDs in fMS and sMS is plotted in figure e-1. The most common conditions were AT (reported in 142 relatives) and psoriasis (reported in 137 relatives), followed by 124 relatives with RA, 90 relatives with IDDM, 52 relatives with CD, 33 relatives with SLE, and 32 relatives with IBD. Forty-five relatives were affected by other AIDs, including myasthenia, scleroderma, polymyositis, and vitiligo.
Impact of wGRS on familial aggregation.
As expected, the wGRS was significantly higher in patients with sMS and fMS than HC: the mean wGRS (SE) was 10.35 (0.04) in HC compared to 10.78 (0.04) in sMS (p < 0.0001) and 10.68 (0.09) in fMS (p = 0.01) (figure 1A, table e-2). Considering the wGRS–non-HLA, similar results were obtained: mean wGRS was 10.18 (0.03) in HC vs 10.46 (0.02) in sMS (p < 0.0001) and 10.37 (0.06) in fMS (p = 0.01). However, no difference in wGRS was observed between sMS and fMS, regardless of whether or not the HLA variant was included in the genetic burden calculation (p = 0.14 and 0.16, respectively) (figure 1A, table e-2).
Figure 1. Distribution of the wGRS in HC and patients with sMS and fMS.
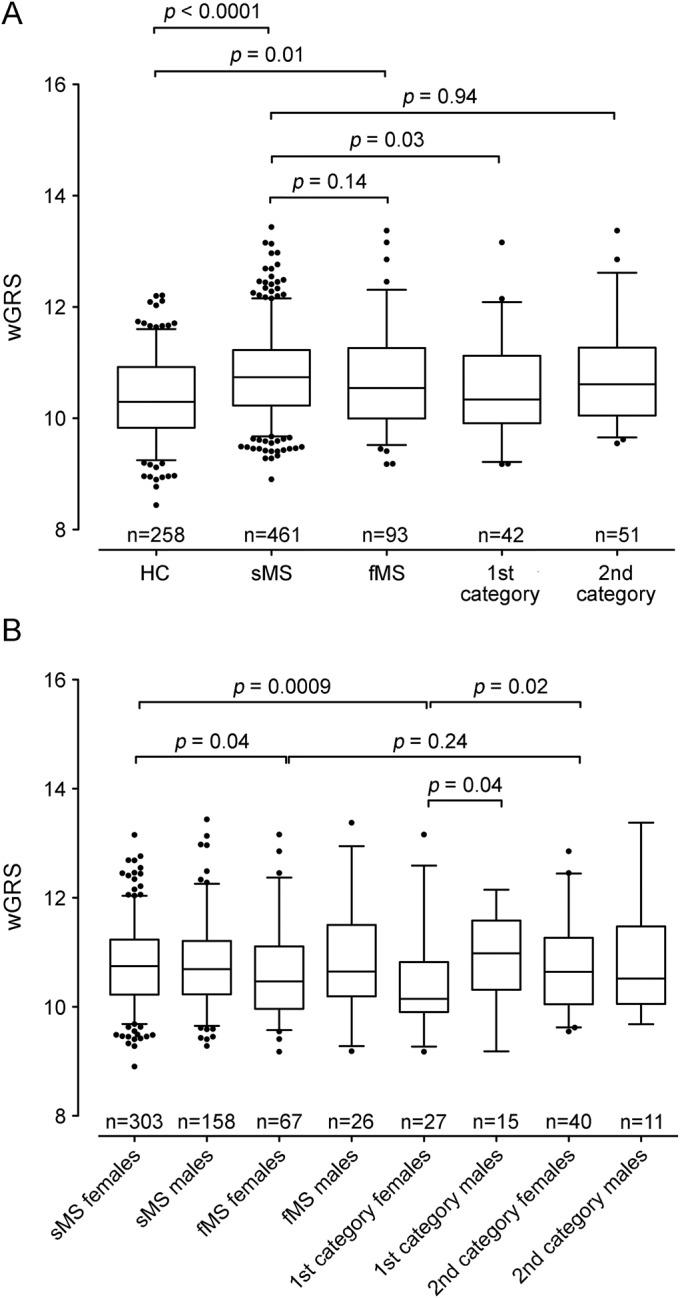
(A) The box plot describes the weighted genetic risk score (wGRS) distribution in healthy controls (HC) and patients with sporadic multiple sclerosis (sMS) and familial multiple sclerosis (fMS). (B) The same analysis stratified by sex. Sample size is indicated at the bottom of each box plot. The horizontal line in the box represents the median of the sample set, the hinges represent the 25th and 75th percentiles, and the whiskers represent the 5th and 95th percentiles. The p values between the different groups are reported at the top of the box plots. 1st category: probands with one first-degree affected relative or with at least 2 affected relatives; 2nd category: probands with one affected relative with second or more degree of kinship.
When limiting the analyses to patients with fMS with a higher degree of familial aggregation (probands with one first-degree affected relative or with at least 2 affected relatives [first category in figure 1A]), a significantly lower wGRS was observed in fMS than sMS: 10.52 (0.13) vs 10.78 (0.04), p = 0.03 (figure 1A). Considering the wGRS–non-HLA, the same comparison showed a trend toward statistical significance (10.29 vs 10.46, p = 0.06). In contrast, we did not observe any difference between probands with one affected relative with second or more degree of kinship (second category in figure 1A) and patients with sMS (p = 0.94 for wGRS and p = 0.78 for wGRS–non-HLA).
We also assessed the impact of the known MS loci on the combined aggregation for MS or other AIDs; however, we did not observe any difference between patients without familial history of MS or AIDs and patients with familial history of MS or AIDs (p = 0.38, data not shown).
We then performed analyses stratified by sex and observed that female patients with fMS had a lower wGRS than female patients with sMS: 10.62 (0.10) vs 10.78 (0.04), p = 0.04 (figure 1B, table e-3). This difference became even more significant when comparing female patients with fMS with a higher degree of familiarity (first category females) with female patients with sMS: 10.35 (0.15) vs 10.78 (0.04), p = 0.0009 (figure 1B, table e-3). Moreover, a lower wGRS was found in first category females compared with female patients with a lower degree of familiarity (second category females) (10.35 vs 10.79, p = 0.02) and first category males (p = 0.04) (figure 1B, table e-3). Similar results were obtained in the wGRS–non-HLA analysis (data not shown). No differences were found in male patients, even if sample size was lower (data not shown).
wGRS and MS clinical features.
In the second part of our study, we assessed the association between wGRS and MS clinical characteristics. We observed an inverse relationship between genetic burden and AAO: patients with higher wGRS had an earlier AAO (p = 0.05). This relationship was stronger when excluding the HLA-DRB1*1501 variant in the score calculation (p = 0.01) (figure 2A). After stratification for MS familiarity, the relationship between genetic burden and AAO was confirmed in sMS (figure 2B) but not in fMS (figure 2C), probably because of the limited sample size. We also observed that wGRS did not correlate with disease severity measured by MSSS or with the presence of OCB.
Figure 2. Correlation between wGRS and age at onset.
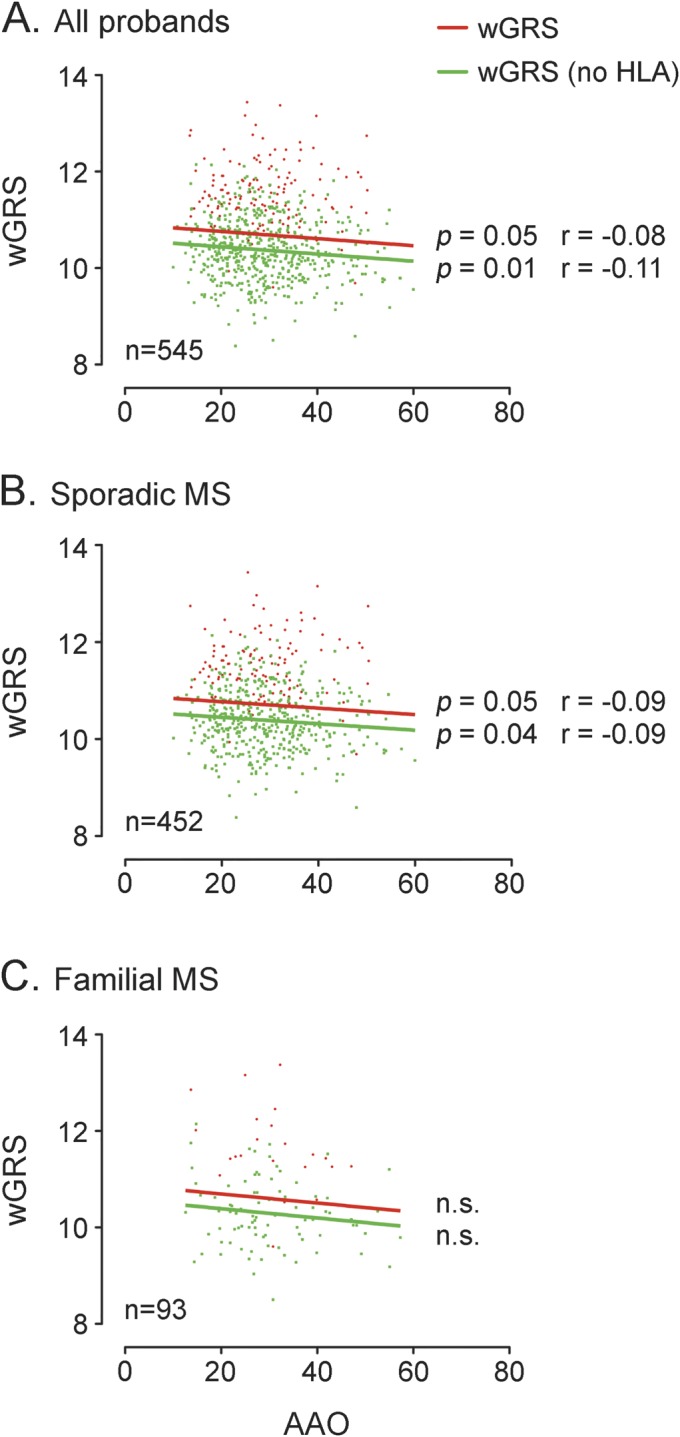
The figure shows the correlation between weighted genetic risk score (wGRS) and age at onset in all probands (A), patients with sporadic multiple sclerosis (MS) (B), and patients with familial MS (C). The linear regression lines are drawn in solid red and green for wGRS and wGRS without the inclusion of human leukocyte antigen (HLA) in the calculation, respectively. The p values from the Pearson nonparametric correlation test and the r estimates are shown near the regression lines. n.s. = not significant.
wGRS and prediction of disease status.
Finally, we assessed the predictive performance of different genetic models using ROC curves. The wGRS score calculated based on only the HLA-DRB1*1501 variant allele had a very limited capacity to discriminate between patients with MS and HC (AUC = 0.55, 95% confidence interval [CI] 0.52–0.58, figure 3A). The AUC increased to 0.59 (95% CI 0.55–0.63) and to 0.61 (95% CI 0.57–0.65) when including wGRS–non-HLA and HLA alleles for building the model, respectively (figure 3A). The difference in predictive performance was significant between the model considering only HLA-DRB1 and the one considering HLA-DRB1*1501 plus 106 SNPs (p = 0.0008). We then evaluated the predictive capability of the different genetic models separately in sMS (figure 3B) and fMS (figure 3C). We observed that the full model (HLA-DRB1*1501 plus 106 genetic loci) was better at discriminating patients with sMS from HC (AUC = 0.63, 95% CI 0.58–0.67, figure 3B) than discriminating patients with fMS from HC (AUC = 0.57, 95% CI 0.50–0.64, figure 3C); however, the difference in the predictive capability was not statistically significant (p = 0.13). Moreover, in the sMS subgroup, the full model had a statistically better predictive performance than the model considering only HLA-DRB1 (p = 0.00006). Finally, no difference in predictive capability was found in female probands compared with male probands (AUC = 0.62, 95% CI 0.55–0.68 vs AUC = 0.60, 95% CI 0.54-0.66; p = 0.65).
Figure 3. Predictive performance of wGRS.
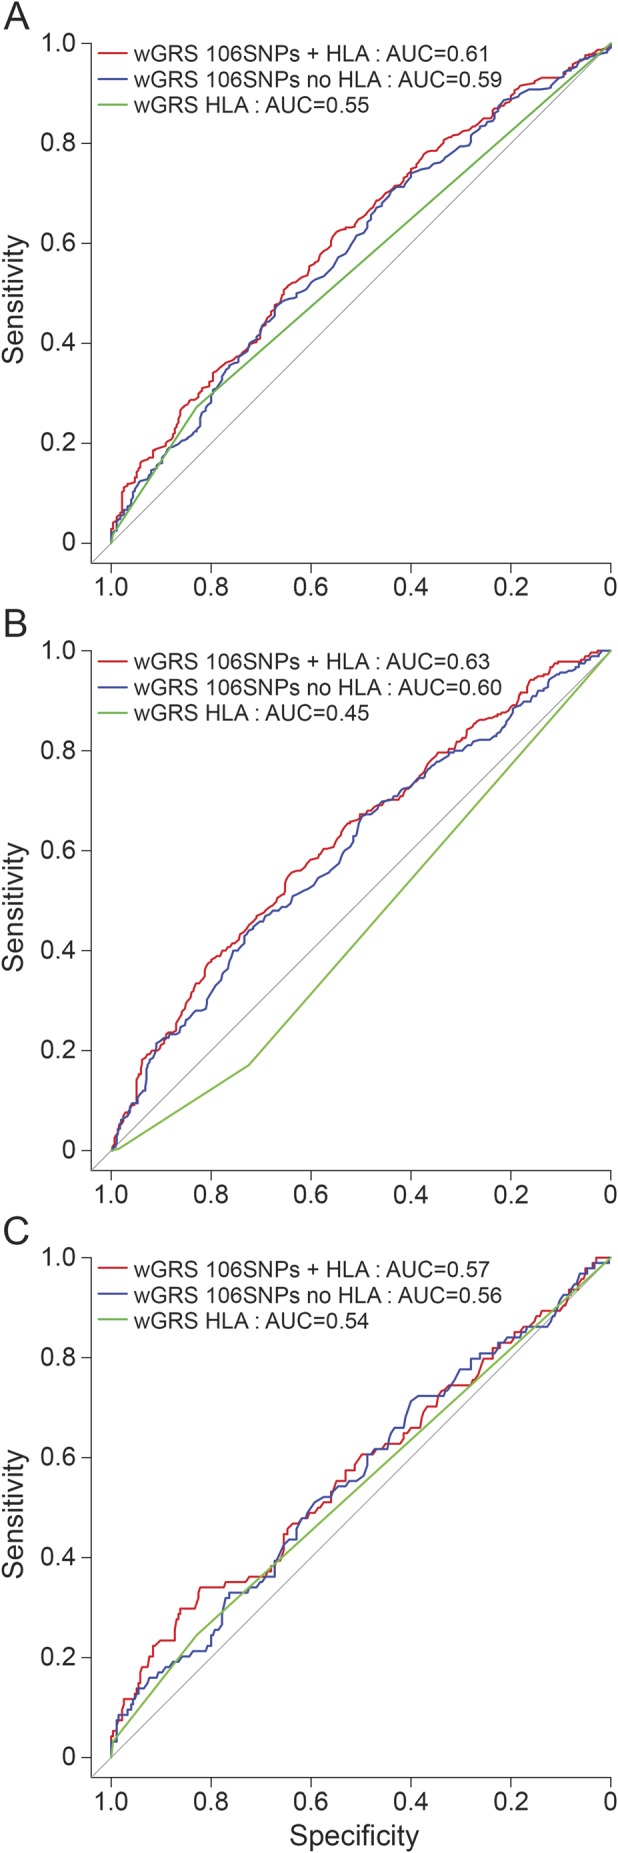
The receiver operating characteristic curves are plotted considering 3 different models: weighted genetic risk score (wGRS) calculated with only with HLA-DRB1 alleles (green line), wGRS non-HLA (blue line), and wGRS calculated including all the 106 known genetic variants plus HLA allele (red line). The area under the curve (AUC) was calculated for the 3 different models, assessing the predictive capability in the entire multiple sclerosis (MS) cohort (A), in the subgroup of patients with sporadic MS (B), and in the subgroup of patients with familial MS (C). HLA = human leukocyte antigen; SNP = single nucleotide polymorphism.
DISCUSSION
In recent years, significant efforts have been made to understand the genetic architecture of MS, allowing a deeper knowledge of the pathogenetic mechanisms triggering the disease. More than 100 loci are now confirmed to be associated with MS, and this number is expected to increase in the near future thanks to additional GWAS combined with next-generation sequencing efforts. The challenge that the MS community has to face now is how to integrate this information into clinical practice. We performed this study in order to assess the role of known genetic variants in explaining familial aggregation, clinical phenotypes, and prediction of disease status by using an aggregate measure to estimate genetic burden at the individual level.
We studied a single-center, hospital-based cohort of Italian patients with MS who were screened for familial risks of MS and AIDs. All consecutive patients with MS who had had at least one appointment at OSR during a 6-month period were asked to complete a questionnaire, and the participation rate was very high (96.2%). Family history of MS was reported by 17.2% of probands, which is in line with data reported in the literature,15–17 particularly a Canadian study15 in which 19.9% of patients reported at least one relative with MS and a Belgian cohort17 in which 15.4% of patients had at least one affected relative in the pedigree. These data suggest that our cohort is representative of the general MS population in the Northern hemisphere.
Then we evaluated how AIDs cluster in families of MS probands. Autoimmune conditions were common in these families, with AT being the most frequent condition, followed by psoriasis and RA. This suggests the presence of common underlying pathophysiologic mechanisms, which could be explained by shared genetic and/or environmental risk factors. Specifically, there are already several cases of genetic variants, involving both HLA and non-HLA loci, known to be implicated in the susceptibility to different AIDs.18
The subset of patients with available genotype information for the known MS loci was then studied to evaluate how susceptibility variants may have an impact on disease epidemiology and clinical manifestations. In our cohort, both wGRS and wGRS–non-HLA were statistically higher in patients with MS than HC, in agreement with previous reports from American and Norwegian data sets in which the wGRS was calculated using almost half of the currently available MS susceptibility variants.14,19 More recently, the analyses performed on a UK cohort considering all known genetic variants revealed similar results.20 Previous studies on the American MS cohort suggested higher aggregation of susceptibility variants in multicase compared with single-case MS families.14,21 However, this observation was not replicated in a Norwegian data set.19 Harbo et al.19 did not find differences in genetic burden between fMS and sMS. We cannot exclude the possibility that differences in genetic burden between fMS and sMS might emerge by increasing sample size. However, population-based differences could explain the different findings observed in our study and the study by Harbo et al. compared to those from the American cohort.14
In addition, in the present cohort, a lower wGRS was observed when considering a subset of MS probands with a high degree of familiarity (first category in figure 1A). We argue that common genetic variants associated with MS explain little of the familial aggregation of MS in European populations.
We can speculate that other factors, such as rare/private variants, environmental factors, or epigenetic mechanisms, are shared within families, especially in those with a high degree of familiarity. It is interesting that the analysis stratified by sex revealed that female probands had a lower wGRS than male probands (figure 1B). This observation could be explained by the different sample size, but it also points to possible hormonal factors involved in explaining susceptibility and incidence of the disease in females compared to males, together with putative epigenetic mechanisms with prevalent maternal transmission.22 These preliminary results need to be interpreted with caution due to the small size of the groups after stratification, and they should be confirmed in additional samples to establish this association with confidence.
In agreement with previous reports,19 we confirmed that individuals with a higher wGRS have a lower AAO, suggesting that carrying an increased number of susceptibility variants might influence the clinical expression of MS by shortening the duration of the silent clinical phase.
Finally, we observed that when the wGRS was used as a predictor of disease status, the predictive performance improved when adding all known MS susceptibility variants to the model; nonetheless, the wGRS measure still has limited predictive value for discrimination between cases and controls (figure 3A). The same analyses stratified by sMS and fMS suggested that known MS genetic variants are better at distinguishing patients with sMS from HC than patients with fMS (figure 3, B and C). These results are consistent with what was observed in our primary analysis.
The present study has several limitations: (1) the epidemiologic data were gathered indirectly through interviews with patients and not from the relatives themselves using a family history method; (2) the limited sample size of our cohort could have had an impact on our observations, and additional analyses in bigger cohorts are required to confirm our findings; (3) the lack of an independent replication cohort does not provide a robust framework to assess the importance of our findings for the Italian MS population as a whole; and (4) given that our genotyped population is a subset with longer duration and less severe disease, our findings could require extension to a more representative genotyped sample or the entire population screened to assess whether wGRS has a more important role when incorporating a higher proportion of patients with more severe disease.
Taken together, our results suggest that genetic data are still unlikely to be useful on their own for assessing disease prediction and familial aggregation in clinical settings, even if they may contribute to the exploration of how genetic risk contributes to clinical phenotypes like AAO. It is more likely that a predictive algorithm using MS susceptibility loci might provide useful information when incorporating both common and rare variants as well as other dimensions of information such as environmental risk factors or, ultimately, blood biomarkers or imaging data. Moreover, it is clear that genetic factors are not the only players in explaining familial aggregation and that the epistatic interactions between genetic and nongenetic factors should be considered in building an updated algorithm able to take into account the complex and polygenic nature of MS, especially in families with female predominance.
Supplementary Material
ACKNOWLEDGMENT
The authors thank all the patients and healthy controls for their participation in this study. The authors thank the International Multiple Sclerosis Genetic Consortium (IMSGC) and the Wellcome Trust Case Control Consortium 2 for sharing genotype data from a subset of recruited patients with MS.
GLOSSARY
- AAO
age at onset
- AID
autoimmune disease
- AT
autoimmune thyroiditis
- AUC
area under the curve
- CD
celiac disease
- CI
confidence interval
- EDSS
Expanded Disability Status Scale
- fMS
familial MS
- GWAS
genome-wide association studies
- HC
healthy controls
- HLA
human leukocyte antigen
- IBD
inflammatory bowel disease
- IDDM
insulin-dependent diabetes mellitus
- MHC
major histocompatibility complex
- MS
multiple sclerosis
- MSSS
MS Severity Score
- OCB
oligoclonal bands
- OSR
San Raffaele Hospital
- RA
rheumatoid arthritis
- ROC
receiver operating characteristic
- SLE
systemic lupus erythematosus
- sMS
sporadic MS
- SNP
single nucleotide polymorphism
- wGRS
weighted genetic risk score
Footnotes
Supplemental data at Neurology.org/nn
AUTHOR CONTRIBUTIONS
F.E., C.G., and F.M.B. designed the study, analyzed and interpreted the data, and wrote the manuscript. M.S., F.C., E.M., and S.S. generated and analyzed the data. L.F., M.P., M. Radaelli, B.C., L.M., M. Rodegher, and V.M. selected patients for inclusion into the study and characterized the participants. E.S. and G.C. contributed to study design and data interpretation. All authors have read and reviewed the submitted version of the manuscript.
STUDY FUNDING
The study was supported by the Italian Foundation for Multiple Sclerosis (Fondazione Italiana Sclerosi Multipla—FISM, grant 2013/R/13).
DISCLOSURE
F. Esposito received honoraria from Serono Symposia International Foundation. C. Guaschino, M. Sorosina, F. Clarelli, L. Ferre', E. Mascia, S. Santoro, M. Pagnesi, M. Radaelli, and B. Colombo report no disclosures. L. Moiola received honoraria for speaking from Sanofi-Aventis. M. Rodegher received travel support from Merck Serono, Bayer Schering, Teva, and Sanofi-Aventis. E. Stupka is employed by Boehringer Ingelheim Pharma. V. Martinelli is on the scientific advisory board for Merck Serono and Genzyme and received honoraria for speaking, consultancy, or support for participation in National and International Congresses from Bayer Schering, Biogen-Dompè, Merck Serono, Novartis, Genzyme, and Teva Pharmaceutical. G. Comi has received consulting fees for participating on advisory boards from Novartis, Merck Serono, Teva, Sanofi, Genzyme, Biogen, Bayer, Almirall, Receptos, Chugai, Excemed, Roche, Serono Symposia International Foundation; has received lecture fees from Novartis, Teva Pharmaceutical Industries Ltd, Sanofi-Aventis, Merck Serono, Genzyme, Almirall, Excemed, Biogen Dompè, and Serono Symposia International Foundation; and is an associate editor for Neurological Sciences. F. Martinelli Boneschi received honoraria for consulting, research grants, and/or travel expenses from Teva Neuroscience, Biogen Idec, GW-Pharma, and Genzyme; is on the speakers' bureau for Biogen Idec, Teva, and Genzyme; and received research support from Ministero della salute, Fondazione Cariplo. Go to Neurology.org/nn for full disclosure forms.
REFERENCES
- 1.Ebers GC. Environmental factors and multiple sclerosis. Lancet Neurol 2008;7:268–277. [DOI] [PubMed] [Google Scholar]
- 2.Barcellos LF, Sawcer S, Ramsay PP, et al. Heterogeneity at the HLA-DRB1 locus and risk for multiple sclerosis. Hum Mol Genet 2006;15:2813–2824. [DOI] [PubMed] [Google Scholar]
- 3.Jersild C, Fog T, Hansen GS, Thomsen M, Svejgaard A, Dupont B. Histocompatibility determinants in multiple sclerosis, with special reference to clinical course. Lancet 1973;2:1221–1225. [DOI] [PubMed] [Google Scholar]
- 4.Beecham AH, Patsopoulos NA, Xifara DK, et al. Analysis of immune-related loci identifies 48 new susceptibility variants for multiple sclerosis. Nat Genet 2013;45:1353–1360. [DOI] [PMC free article] [PubMed] [Google Scholar]
- 5.Sawcer S, Hellenthal G, Pirinen M, et al. Genetic risk and a primary role for cell-mediated immune mechanisms in multiple sclerosis. Nature 2011;476:214–219. [DOI] [PMC free article] [PubMed] [Google Scholar]
- 6.Barcellos LF, Kamdar BB, Ramsay PP, et al. Clustering of autoimmune diseases in families with a high-risk for multiple sclerosis: a descriptive study. Lancet Neurol 2006;5:924–931. [DOI] [PubMed] [Google Scholar]
- 7.Baranzini SE. The genetics of autoimmune diseases: a networked perspective. Curr Opin Immunol 2009;21:596–605. [DOI] [PubMed] [Google Scholar]
- 8.McDonald WI, Compston A, Edan G, et al. Recommended diagnostic criteria for multiple sclerosis: guidelines from the International Panel on the diagnosis of multiple sclerosis. Ann Neurol 2001;50:121–127. [DOI] [PubMed] [Google Scholar]
- 9.Polman CH, Reingold SC, Edan G, et al. Diagnostic criteria for multiple sclerosis: 2005 revisions to the “McDonald Criteria.” Ann Neurol 2005;58:840–846. [DOI] [PubMed] [Google Scholar]
- 10.Millefiorini E, Cortese A, Di Rezze S, et al. The prevalence of multiple sclerosis in central Italy. Mult Scler 2010;16:1432–1436. [DOI] [PubMed] [Google Scholar]
- 11.De Jager PL, Chibnik LB, Cui J, et al. Integration of genetic risk factors into a clinical algorithm for multiple sclerosis susceptibility: a weighted genetic risk score. Lancet Neurol 2009;8:1111–1119. [DOI] [PMC free article] [PubMed] [Google Scholar]
- 12.Sorosina M, Brambilla P, Clarelli F, et al. Genetic burden of common variants in progressive and bout-onset multiple sclerosis. Mult Scler 2014;20:802–811. [DOI] [PubMed] [Google Scholar]
- 13.de Bakker PI, McVean G, Sabeti PC, et al. A high-resolution HLA and SNP haplotype map for disease association studies in the extended human MHC. Nat Genet 2006;38:1166–1172. [DOI] [PMC free article] [PubMed] [Google Scholar]
- 14.Gourraud PA, McElroy JP, Caillier SJ, et al. Aggregation of multiple sclerosis genetic risk variants in multiple and single case families. Ann Neurol 2011;69:65–74. [DOI] [PMC free article] [PubMed] [Google Scholar]
- 15.Sadovnick AD, Baird PA, Ward RH. Multiple sclerosis: updated risks for relatives. Am J Med Genet 1988;29:533–541. [DOI] [PubMed] [Google Scholar]
- 16.Compston A. Genetic epidemiology of multiple sclerosis. J Neurol Neurosurg Psychiatry 1997;62:553–561. [DOI] [PMC free article] [PubMed] [Google Scholar]
- 17.Carton H, Vlietinck R, Debruyne J, et al. Risks of multiple sclerosis in relatives of patients in Flanders, Belgium. J Neurol Neurosurg Psychiatry 1997;62:329–333. [DOI] [PMC free article] [PubMed] [Google Scholar]
- 18.Cardenas-Roldan J, Rojas-Villarraga A, Anaya JM. How do autoimmune diseases cluster in families? A systematic review and meta-analysis. BMC Med 2013;11:73. [DOI] [PMC free article] [PubMed] [Google Scholar]
- 19.Harbo HF, Isobe N, Berg-Hansen P, et al. Oligoclonal bands and age at onset correlate with genetic risk score in multiple sclerosis. Mult Scler 2014;20:660–668. [DOI] [PMC free article] [PubMed] [Google Scholar]
- 20.Disanto G, Dobson R, Pakpoor J, et al. The refinement of genetic predictors of multiple sclerosis. PLoS One 2014;9:e96578. [DOI] [PMC free article] [PubMed] [Google Scholar]
- 21.Isobe N, Damotte V, Lo Re V, et al. Genetic burden in multiple sclerosis families. Genes Immun 2013;14:434–440. [DOI] [PMC free article] [PubMed] [Google Scholar]
- 22.Voskuhl RR, Gold SM. Sex-related factors in multiple sclerosis susceptibility and progression. Nat Rev Neurol 2012;8:255–263. [DOI] [PMC free article] [PubMed] [Google Scholar]
Associated Data
This section collects any data citations, data availability statements, or supplementary materials included in this article.


