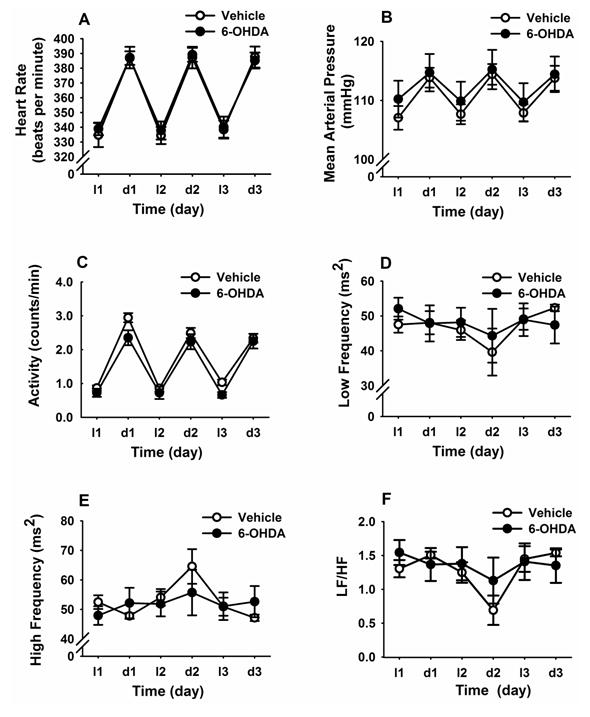
Figure 4. Time course of changes in cardiovascular and heart rate variability (HRV) parameters during the light and dark phase of baseline daily rhythms (3 days).

A2 lesions did not alter daily rhythms of heart rate (A), mean arterial pressure (B), locomotor activity (C), low frequency (LF) HRV (D), high frequency (HF) HRV (E), and LF/HF ratio (F). Data are expressed as mean ± SEM. (n = 5 for 6-OHDA and n = 6 for vehicle).
