

Abstract
Lapses of attention can have negative consequences, including accidents and lost productivity. Here we used closed-loop neurofeedback to improve sustained attention abilities and reduce the frequency of lapses. During a sustained attention task, the focus of attention was monitored in real time with multivariate pattern analysis of whole-brain neuroimaging data. When indicators of an attentional lapse were detected in the brain, we gave human participants feedback by making the task more difficult. Behavioral performance improved after one training session, relative to control participants who received feedback from other participants’ brains. This improvement was largest when feedback carried information from a frontoparietal attention network. A neural consequence of training was that the basal ganglia and ventral temporal cortex came to represent attentional states more distinctively. These findings suggest that attentional failures do not reflect an upper limit on cognitive potential and that attention can be trained with appropriate feedback about neural signals.
Our ability to sustain attention over long periods of time is limited, both in the laboratory1,2 and in the real world3,4. This has been demonstrated using vigilance tasks in which participants monitor for and detect infrequent stimuli5–7. Behavior in these tasks is predictive of attention disorders8 and is reliable over time9. Within the normal population, there is considerable variability in attentional abilities as measured by these tasks, and this variability is related to other perceptual and mnemonic processes10. We hypothesized that lapses in these tasks—and in life—occur because humans do not adequately monitor how well they are attending from moment to moment. Lapses emerge gradually and may be detected too late, after the chain of events that produces behavioral errors has been initiated. Accordingly, one way to train sustained attention might be to provide a more sensitive feedback signal, such that participants can learn to sense upcoming lapses earlier and prevent them from manifesting in behavior.
To pursue this approach, we created a continuous feedback signal customized to each participant, reflecting moment-to-moment variations in their sustained attention. Participants were presented with a series of composite stimuli containing a mixture of information relevant and irrelevant to the task. Online analysis was used to track their attentional state, operationalized as the amount of task-relevant information active in their brains minus the amount of task-irrelevant information. Finally, this measure was provided to participants as feedback by altering the appearance of the next stimulus. When participants were attending well (that is, more task-relevant information was detected in their brains), we increased the proportion of task-relevant information in the stimulus. Conversely, when they were attending poorly (that is, more task-irrelevant information was detected), we reduced the proportion of task-relevant information in the stimulus. In this way, we amplified the consequences of their attentional state, rewarding them with a stronger stimulus and an easier task for staying focused and punishing them with a degraded stimulus and a more difficult task for lapsing. We hypothesized that this would make attentional lapses more salient and that participants would be able to exploit this feedback to learn to improve their sustained attention.
For online analysis, we combined real-time functional magnetic resonance imaging (rtfMRI)11–13 with multivariate pattern analysis (MVPA)14. The rtfMRI component of the system involved immediately acquiring measurements of the blood oxygen level-dependent (BOLD) response over the whole brain. This technique has been used previously to display univariate activity for pain regulation15, to display multivariate activity for inducing perceptual learning16 and to trigger stimulus presentation based on univariate activity in brain regions associated with memory encoding17 and vigilance18. Our approach was related to these latter triggering designs, in the sense that brain states were used to control stimuli rather than controlling a separate feedback scale or gauge, but differed in that the stimulus triggered by a brain state at one moment in time influenced the brain state at the next moment, which in turn influenced the next stimulus, and so on. In other words, after a stimulus was triggered, the trial did not end and there was no delay imposed before the next stimulus could be triggered17,18. This approach of continually updating task stimuli as they perturb brain states has been referred to as “closed-loop”12. The MVPA component of the system decoded differences in whole-brain BOLD activity patterns reflecting attention to the task-relevant versus task-irrelevant stimuli. The combination of MVPA and rtfMRI is well suited for rapidly decoding distributed cognitive processes such as attention.
There are other, simpler ways of delivering real-time feedback: for example, based on electroencephalography (EEG), eye tracking or manual responses. We used rtfMRI for two reasons. First, in combination with advanced analytical techniques, fMRI may provide more direct access to internal brain states. For instance, we sought to identify which specific kind of information a participant was attending to over time rather than whether they were attentive in general (often called alertness, arousal or mindfulness), as is reflected in pupil size19 and response time variability20. Second, by using fMRI, we not only gain a sensitive neural measure for feedback but also the ability to characterize the neural mechanisms that support attention training. We take advantage of this opportunity by considering both how training alters the brain and which brain regions provide useful feedback signals for training. We do not claim that this is the only or best approach for training attention, but simply that it may prove valuable because of its sensitivity, its ability to generate neuroscientific data that can help constrain our interpretation, and its potential to lay the foundation for further advances in the use of other methods.
This study involved three sessions on different days: behavioral pre-training, rtfMRI training and behavioral post-training (Supplementary Fig. 1). Participants performed the same sustained attention task in all sessions, viewing blocks of face/scene composite stimuli. Before each block, they were cued to attend to one task-relevant category (for example, scenes) and were instructed to ignore the other, task-irrelevant category (in this case, faces). Within the task-relevant category, they responded (‘go’ trial) if the image was from a specified target subcategory that appeared with high frequency throughout the study (for example, indoor scenes; 90% of trials). They withheld their response (‘no-go’ trial) for the other, infrequent lure subcategory (in this case, outdoor scenes; 10%)9,20. Sustained attention was assessed behaviorally using signal detection measures. The average false alarm rate from the behavioral pre-training session was 0.31 (s.e.m. = 0.03). In other words, college-aged adults made 30% errors in an ostensibly trivial task, which demonstrates that sustained attention abilities were limited at the start of the study, as expected.
During the rtfMRI training session, each of several training runs contained eight blocks of the sustained attention task in a counterbalanced design. The first four, ‘stable’ blocks were used for MVPA training and the last four, ‘feedback’ blocks were used for neurofeedback. During the stable blocks, composite stimuli were presented with a mixture of 50% face and 50% scene. A whole-brain classifier was trained over a moving window of recent stable blocks to discriminate attention to faces versus scenes. This attentional manipulation is known to elicit distinct patterns of neural activity21,22. During feedback blocks, the trained classifier was used to decode in real time which category was being attended. The output was then used to update the mixture of the composite stimulus for the next trial (Fig. 1).
Figure 1. Real-time pipeline.
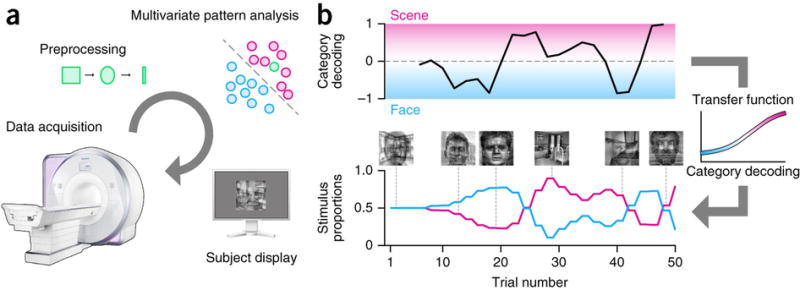
(a) During feedback blocks, each brain volume (green) was acquired, preprocessed with masking, smoothing and z-scoring, and analyzed during the next volume with a multivariate classifier trained on volumes from recent stable blocks in which faces (blue) or scenes (pink) were attended. The result was averaged with the results for the two preceding volumes and used to update the stimulus shown to the participant on trials in the subsequent volume. (b) The classifier output indicated how attentive the participant was to the task-relevant versus task-irrelevant categories. This output was converted to a mixture proportion using a sigmoidal transfer function: less attention to the task-relevant category resulted in a decrease in the proportion of that category’s image in the composite stimulus on the next trial. These values were updated throughout the block as attention fluctuated over time.
Results
Real-time neurofeedback
The classifier’s output would be useful for training attention only if it provided an accurate measurement of attentional state (that is, attention to face versus scene). To assess the validity of this measure, we performed n-fold cross-validation on the stable blocks. Note that bottom-up stimulation in these blocks was identical at the category level regardless of whether participants were instructed to attend to faces or to scenes. The average decoding accuracy was 0.78 (s.e.m. = 0.02), which was highly reliable relative to chance (0.50) across participants (P < 0.00001, bootstrap resampling). This robust decoding validated our measure of top-down attentional state.
As a further preliminary step, we sought to verify that the classifier’s output was meaningfully related to participants’ behavior (Fig. 2). Across participants, there was a strong positive correlation between decoding accuracy in the stable blocks and performance in the earlier behavioral pre-training session (r = 0.70, P = 0.000008, Spearman rank correlation). This relationship was also evident within participants23,24: behavioral accuracy on no-go trials—that is, whether participants correctly withheld their response or responded incorrectly—could be predicted using the classifier evidence for the task-relevant category from the brain volumes immediately preceding trial onset (correct rejection: mean evidence = 0.78, s.e.m. = 0.02; false alarm: mean evidence = 0.74, s.e.m. = 0.02; P < 0.00001). This effect remained robust after controlling for response time (RT) differences (Supplementary Figs. 2 and 3). This further confirmed that the classifier provided a predictive and behaviorally relevant measure of attention.
Figure 2. Brain-behavior relationship.
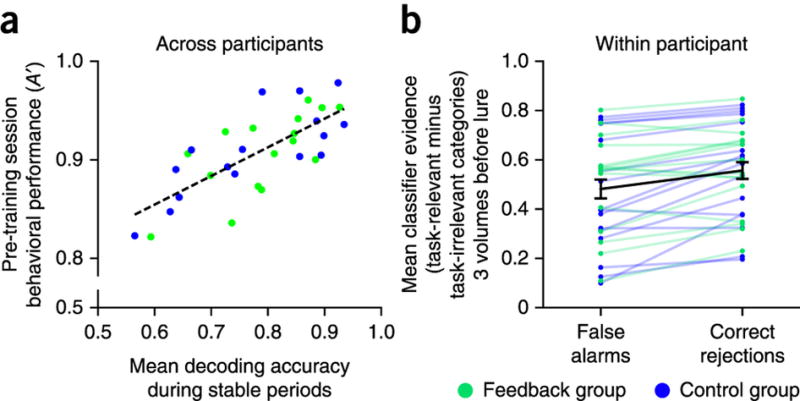
To verify that the classifier could provide useful feedback, we examined how predictive it was of behavior. (a) Across participants, average decoding accuracy from the stable blocks of the rtfMRI session (determined by offline MVPA with n-fold cross-validation) was highly correlated with behavioral performance in the pre-training session. (b) Within participants, there was greater classifier output for the task-relevant category than for the task-irrelevant category before correctly rejecting than before false alarming to a lure trial. Error bars represent ±1 s.e.m.
The feedback blocks used real-time classifier output to modulate the proportion of task-relevant versus task-irrelevant information in the composite stimuli. As outlined above, the proportion of the task-relevant stimulus on the next trial was increased when there was greater neural evidence of the task-relevant category in the preceding trial, whereas it was decreased when there was greater neural evidence of the task-irrelevant category (Supplementary Video 1). The motivation for weakening the task-relevant image when measures of attention waned was to amplify and externalize the consequences of the participant’s attentional state, providing them with an error signal, with the goal of increasing their self-monitoring ability. The opposite—strengthening the task-relevant image when attention lapsed—might have stabilized performance at that moment, but it may also have incentivized such lapses by making the task easier, thus undermining learning. The precise mapping between classifier output and mixture proportion was controlled by a sigmoidal transfer function (Supplementary Fig. 4).
Training effects in behavior
The rtfMRI neurofeedback produced a significant training effect: behavioral sensitivity improved from the pre-training session to the post-training session (P = 0.01; Fig. 3). This improvement was quantitatively related to what happened during the training session, as it could be predicted by the extent to which a participant’s neurofeedback became more positive over time (r = 0.78, P = 0.002). To further verify that improved sensitivity was the result of accurate neurofeedback, we collected data from 16 control participants who were each uniquely matched in age, gender and handedness to one of the 16 feedback participants. During the pre-training session, there was no difference between the groups in false alarm rate (P = 0.72) or sensitivity (P = 0.90). Control participants were given identical instructions and underwent the same procedure, except that, during the feedback blocks, their feedback was yoked to their matched participant in the experimental group, rather than to measures of their own attentional state. This yoking ensured that control participants were exposed to the same overall stimulus statistics and variations in task difficulty. Their sensitivity did not reliably increase from pre- to post-training (P = 0.26), and the change was weaker than in the feedback group (P = 0.04). This interaction reflected a reliable difference in the change in false alarm rate between groups (P = 0.007).
Figure 3. Change in behavior.
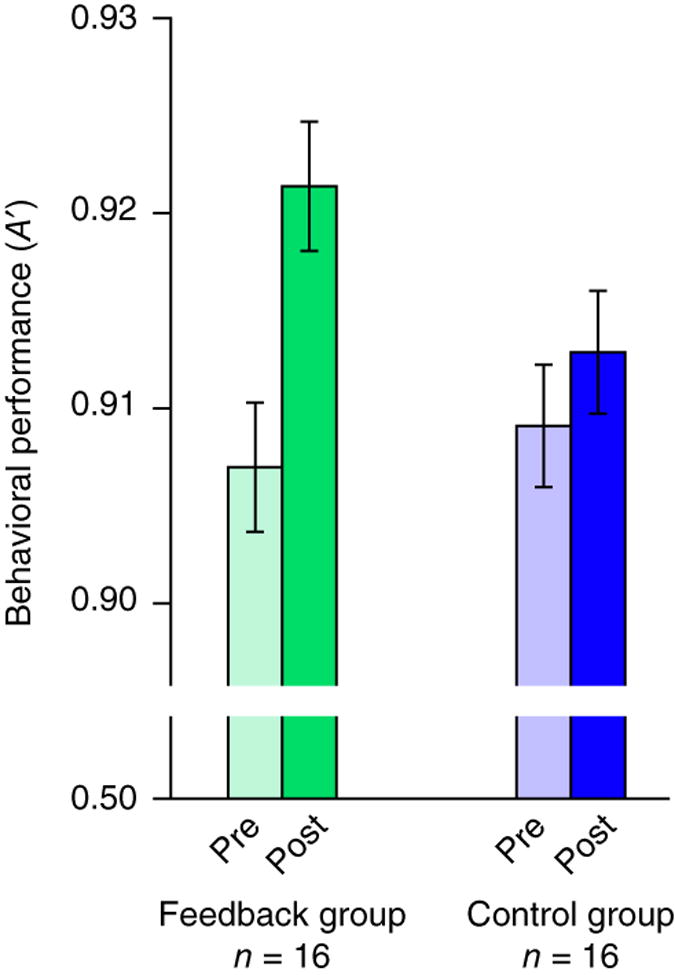
Behavioral performance in the sustained attention task, as indexed by a non-parametric measure of sensitivity (A′), is plotted for the pre-training and post-training sessions. Participants who received accurate neurofeedback about their attentional state improved as a result of training, even though the feedback was no longer present in the post-training session. Control participants who received neurofeedback from other participants’ brains did not improve. A reliable group difference in improvement shows that accurate feedback boosted performance above and beyond practice effects and stimulus exposure. Error bars represent ±1 within-subject s.e.m.
Rather than a benefit of accurate neurofeedback, the difference between groups could reflect a generic practice effect in the feedback group that was stymied by inaccurate neurofeedback in the control group. If so, then an improvement in sensitivity should be found even without feedback. We therefore ran a behavioral experiment with a new group of 16 participants who completed the same procedure but received only stable blocks. Unlike the feedback group, their sensitivity did not increase from pre- to post-training (P = 0.67), inconsistent with this alternative account. In addition, accurate neurofeedback may have been effective simply because it resonated with a participant’s attentional state and increased task engagement and motivation. If so, then feedback about any reliable measure of attention should be useful for training. We therefore ran a second behavioral experiment that was closely matched to the fMRI study, in which a new group of 16 participants received feedback based on RT (which was robustly related to attention; see Online Methods and Supplementary Fig. 2), along with a new group of 16 control participants who received yoked RT feedback. Unlike in the fMRI study, the change in sensitivity from pre- to post-training was not stronger in the feedback group than in the control group (P = 0.29), suggesting that not all correlates of attention are sufficient for training.
Training effects in the brain
One advantage of using whole-brain fMRI to provide feedback is that we could also gain insight into the neural changes induced by training. In particular, we hypothesized that learning via neurofeedback might strengthen and differentiate the two attentional states, such that they would become more discriminable in the brain from pre- to post-training. This might occur both in areas that represent attended stimulus features 21,22 and in areas that represent task goals and control attention25,26. Although MVPA over the whole brain can be hard to interpret27, this differentiation analysis tested for a very specific effect that would be hard to explain parsimoniously on the basis of generic confounds: namely, regions that showed an improvement in classification as a result of training that was greater for the feedback relative to control groups.
We trained and tested classifiers on the first and last run of the rtfMRI training session (stable blocks) to distinguish attention to faces versus scenes and measured the change in cross-validation accuracy. Whole-brain classification (the basis for neurofeedback) showed a greater increase in accuracy from pre- to post-training in the feedback group than in the control group (P = 0.01). This interaction was present when the same analysis was performed separately in an anatomical mask of the frontal lobe (P = 0.02) and occipital lobe (P = 0.04), and it was trending in the temporal and parietal lobes (P = 0.09 and 0.08, respectively). Searchlight analyses further identified specific areas where activity patterns showed this interaction (Fig. 4). The largest clusters were found in fusiform and parahippocampal gyri of ventral temporal cortex and in subcortical structures including the basal ganglia (striatum, globus pallidus) and amygdala (all P < 0.05, randomization test with threshold-free cluster correction).
Figure 4. Searchlight analyses.
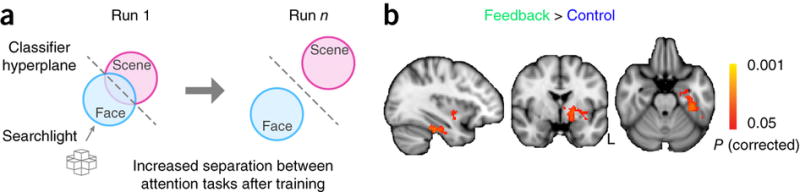
(a) Voxel-wise analyses were conducted to identify brain regions whose surrounding activity patterns for the two attentional states became more separable after neurofeedback training. We computed cross-validation accuracy for classifiers trained to decode face and scene attention from RT-residualized BOLD data using a sphere with a 1-voxel radius centered on each voxel. Increased separability was quantified as the difference in accuracy between the end (run n) and start (run 1) of the fMRI session. (b) A greater increase in classifier accuracy for the feedback group relative to the control group (P < 0.05, randomization test with threshold-free cluster correction; Montreal Neurological Institute (MNI) x, y, z coordinates in mm) was observed in left ventral temporal cortex (−34, −24, −25) and left basal ganglia (−18, −4, −5). Small clusters (not shown) were obtained in left lateral temporal cortex (−50, −45, −25; −51, −36, −20; −48, −42, −28) and left anterior temporal lobe (−26, 22, −32).
Contribution of specific brain systems
Beyond investigating the consequences of training in the brain, the fMRI data can also be used to infer which brain regions were involved in the training process itself. Specifically, we examined which regions contributed to the whole-brain feedback and how these contributions affected behavioral training. This analysis consisted of three steps. First, we identified neural signals that could have been used to provide more targeted feedback from particular brain regions. Second, for each participant, we correlated these signals with whole-brain classifier output to quantify the extent to which the actual feedback that the participant received reflected information that was present within these regions. Third, we related these correlations to individual differences in the behavioral training effect to assess which regions were most useful for training. In sum, if we had based the feedback on specific brain regions rather than the whole brain, how similar, and how useful, would this feedback have been?
Perhaps the simplest neural measure of when attention is allocated to faces versus scenes is the relative univariate activity of visual areas with selectivity for these categories, the fusiform face area (FFA) and the parahippocampal place area (PPA)21, respectively. This is analogous to the approach used in several previous rtfMRI studies, in which the average activity from one or more regions of interest (ROIs) was returned as feedback11,15,17. The difference in univariate activity for task-relevant versus task-irrelevant ROIs (for example, PPA minus FFA for scene attention) was weakly but reliably correlated with the difference in whole-brain multivariate evidence for these categories over time (mean r = 0.25, s.e.m. = 0.02; P < 0.00001). That is, on average, ~6% of variance in the whole-brain signal used for real-time feedback was explained by the relative activity levels of FFA and PPA. Individual differences in the size of the behavioral training effect were unrelated to this reliance on information in FFA versus PPA for feedback (r = −0.04, P = 0.89).
Information about visual categories is also represented outside peak category-selective areas, in patterns of activity distributed over regions of occipitotemporal cortex28. Likewise, under attentionally demanding conditions, distributed activity patterns over frontoparietal regions linked to cognitive control contain stimulus-specific information29. Therefore, classifiers applied to these ‘perceptual’ and ‘attentional’ networks of regions in occipitotemporal and frontoparietal cortices, respectively (constrained functionally, see Online Methods), provide additional neural measures of when attention was allocated to faces versus scenes (Fig. 5). The difference in multivariate evidence for task-relevant versus task-irrelevant categories in the whole brain was reliably correlated with the difference in multivariate evidence for these categories in the perceptual network (mean r = 0.77, s.e.m. = 0.02; P < 0.00001) and attentional network (mean r = 0.83, s.e.m. = 0.01; P < 0.00001), although the correlation with the attentional network was significantly stronger (P = 0.04).
Figure 5. Potential sources of feedback.
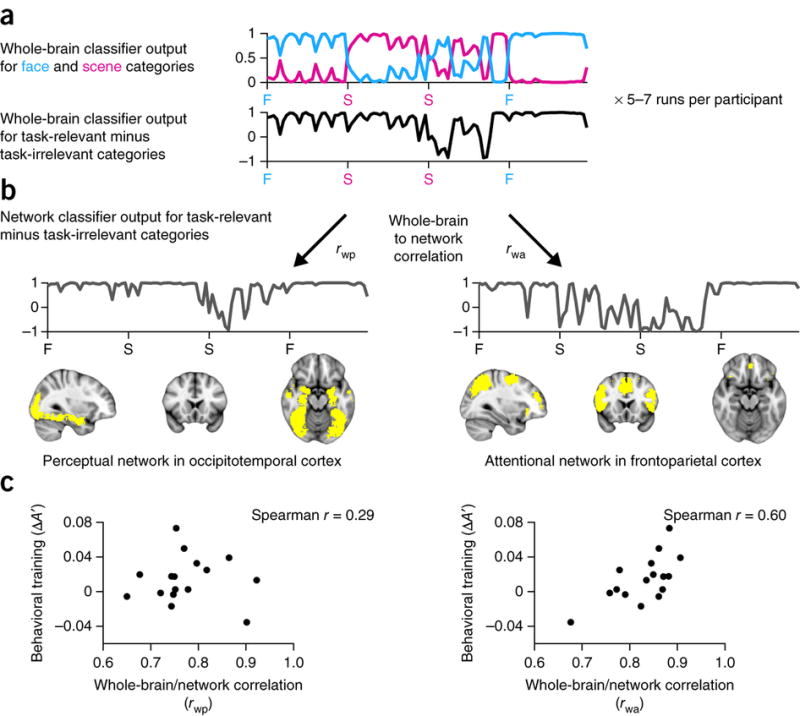
(a) Real-time whole-brain classifier output from the feedback blocks of a representative run for a single participant: evidence for each category (top) and evidence for the task-relevant minus task-irrelevant categories (bottom). (b) Offline classifier output for the same blocks from a perceptual network in occipitotemporal cortex (left) and an attentional network in frontoparietal cortex (right). The output from the whole-brain classifier was correlated with the outputs of the perceptual network classifier (rwp) and attentional network classifier (rwa) over time during the feedback blocks of each run. These correlations were averaged across runs within each participant to produce a measure of the extent to which the participant’s real-time feedback relied on information in each network. (c) This measure of reliance on each network was in turn correlated with the change in behavioral A′ from pre- to post-training to assess whether feedback from each network was useful for training.
To assess whether the information contained in each network served as useful feedback for training, we related individual differences in these whole-brain/network correlations to the size of the training effect across participants. Behavioral improvement was unrelated to reliance on the perceptual network (r = 0.29, P = 0.27) but positively related to reliance on the attentional network (r = 0.60, P = 0.02).
Discussion
We found that moment-to-moment feedback about attentional state could enhance sustained attention abilities. We used closed-loop neurofeedback from MVPA as a type of cognitive prosthetic, facilitating participants’ ability to detect neural signals that indicated an impending attentional lapse by displaying them visually in a form that was directly relevant to the task. In other words, we provided a neural error signal so that participants could learn to better monitor and evaluate the state of their attention.
MVPA has become widespread because of its ability to read out the informational contents of the brain14,30. However, classifiers exploit any predictive variance that distinguishes between classes, and they are thus susceptible to confounding factors27. Our design allowed us to assess whether whole-brain classifier output truly reflected attentional state—the cognitive variable of interest—using behavior as the yardstick: when provided as feedback, classifier output was useful for improving attention-dependent performance.
By using fMRI for cognitive training, we gained important insights about the underlying neural mechanisms. We first identified brain regions that were affected by training, including frontal cortex, ventral temporal cortex and basal ganglia (striatum and globus pallidus), which came to represent the attentional states more distinctively as a result of feedback. We interpret the increased neural separation in these regions as reflective of the two component processes in our sustained attention task. First, participants needed to select the image from the task-relevant category when confronted with a composite stimulus. Increased neural separation of face and scene attention in frontal cortex may reflect learning of better task or control representations for each category, which in turn enabled stronger top-down modulation of category-selective visual representations in ventral temporal cortex, biasing processing toward the task-relevant image and thereby facilitating its selection22,25,26,31,32. Second, participants needed to inhibit their prepotent response when the selected image came from the infrequent lure subcategory. Increased neural separation of face and scene attention in basal ganglia may reflect enhanced learning of different stimulus–response rules within each category, with the striatum directly gating responses to targets and indirectly blocking responses to lures via inhibitory projections to the globus pallidus25,33–35.
We next identified brain regions supporting the training process itself, simulating how feedback from these regions related to the real-time feedback. Univariate activity in the FFA and PPA was weakly correlated with whole-brain multivariate evidence, whereas multivariate evidence from a perceptual network in occipitotemporal cortex and multivariate evidence from an attentional network in frontoparietal cortex were strongly correlated. These results suggest that distributed activity patterns contributed more to the training effect than punctate responses in category-selective visual areas. We tested this more directly by exploiting variance in the training effect across participants. Training was predicted by the extent to which feedback relied on information in the attentional network, but not by reliance on information in the perceptual network or the relative activity levels of FFA and PPA. The importance of frontoparietal feedback can be interpreted as evidence that our attention training involved the reinforcement of task representations25,26, rewarding good states by reducing difficulty and punishing bad states by increasing difficulty. This interpretation is consistent with the observed multivariate changes in frontal cortex and basal ganglia, as these regions and their interaction are critical for feedback-based task learning36,37. It remains an open question whether feedback restricted to occipitotemporal cortex or to FFA and PPA (that is, without access to frontoparietal information) could lead to training.
The goal of our study was to derive basic science insights into the neural basis of top-down attention and the plasticity of attention-related behavior. In the future, the kind of approach we pursued may find potential applications for training sustained attention in occupational settings (for example, baggage screeners and truck drivers)38 and clinical disorders (for example, attention deficit hyperactivity disorder and negative attentional biases in depression)39,40.
Online Methods
Participants
Eighty adults (45 female, 75 right-handed, mean age = 20.3 years) participated in the study for monetary compensation. This included 16 participants in each of the following: the fMRI experimental group, the fMRI control group, the no-feedback behavioral group, the RT-feedback behavioral group, and the RT-control behavioral group. Each participant in the fMRI control and behavioral groups was matched as closely as possible to the demographics (age, gender and handedness) of a participant in the fMRI experimental group. Power analyses were not performed because of the use of a new paradigm and unknown behavioral and neural effect sizes. The sample size was chosen because it is fairly common for an fMRI study, especially one with multiple groups and sessions. Three additional fMRI participants were excluded because of technical problems with real-time data acquisition, one additional fMRI participant was excluded for falling asleep during several runs and one additional behavioral participant was excluded for low overall performance (3.2 s.d. below the mean in pre-training). For the fMRI participants, the experimenter was not blind to group assignment because of the complexity of data acquisition and analysis, especially the need to ensure that the real-time classification and feedback system was functioning. However, every fMRI participant received the same scripted instructions. All participants had normal or corrected-to-normal visual acuity and provided informed consent to a protocol approved by the Princeton University Institutional Review Board.
Stimuli
Images consisted of grayscale photographs of male and female faces and indoor and outdoor scenes. These images were combined into composite stimuli by averaging pixel intensities using various weightings (for example, 60% face, 40% scene). The stimuli were displayed on a projection screen at the back of the scanner bore (subtending 10 × 10° of visual angle) and viewed with a mirror attached to the head coil.
A fixation dot was superimposed on the images and presented during the inter-block intervals of each run, except when text instructions were displayed. Participants were instructed to fixate on this dot, they received practice doing so during their first session, and they were reminded about the importance of fixation before scanning. We did not use an eyetracker to ensure fixation because of the technical complexity of the real-time apparatus and analysis. Aside from this, eyetracking is rarely used in attention studies with overlapping face/scene stimuli22,41,42, and when it has been used, no differences in eye movements or position across categories were observed43. In fact, only one participant reported using an eye-movement strategy to perform the task, and this participant showed the smallest training effect of anybody in the feedback group.
Procedure
Participants completed three sessions on different days. The first day was a behavioral pre-training session with two runs of the sustained attention task. The second day was an fMRI session with several runs of the modified real-time neurofeedback version of the sustained attention task. The number of runs varied across participants, depending on how many they could complete within 2 h (range 6–9 runs). The third day was a behavioral post-training session, otherwise identical to the first session. We attempted to conduct the sessions on three consecutive days, but this was not always possible because of scanner availability and participants’ schedules. All participants completed the study within 5 d. The average number of days (and s.e.m.) between the first and second sessions was 1.19 (0.09) and between the second and third sessions was 1.25 (0.09).
Each task run contained eight blocks. Each block began with a text cue for 1 s that instructed participants which subcategory was the target to which they should respond and, by extension, which category was to be attended. Four of the blocks involved attending to faces and the other four involved attending to scenes. The target subcategories were held constant within each participant (for example, “male” and “indoor”) but were counterbalanced across participants. The cue was followed by 1 s of fixation and then a series of 50 trials. Each trial contained a composite face/scene image presented for 1 s with no inter-stimulus interval. Responses were recorded during the first 850 ms of stimulus presentation to allow computation time at the end of the trial. The trial structure followed a response inhibition task design9,20: 90% of images contained the target subcategory (for example, an indoor scene after an “indoor” cue) and required a response; the other 10% contained the non-target subcategory (in this case, an outdoor scene) to which responses needed to be withheld. The distribution of the subcategories was the same for the unattended category (for example, 90% male and 10% female after an “indoor” cue), although these images were irrelevant for determining whether to respond or not. After the last trial, there was a 4–6 s of fixation before the next block.
The first run of the rtfMRI session was identical to the runs of the behavioral sessions, with all composite stimuli being an equal mixture of face (50%) and scene (50%) images. Starting with the second run, the first four, ‘stable’ blocks kept the same equal mixture, but the final four, ‘feedback’ blocks had variable mixture proportions that depended on the participant’s attentional state. Text instructions appeared before the first feedback block to alert participants that neurofeedback was starting. Each of these blocks started with an equal mixture for the first three trials. The mixture proportions for the remaining trials were determined based on real-time MVPA of the fMRI data. They ranged from 17% to 98% of the task-relevant category (83% to 2% of the task-irrelevant category). For half of the participants, the last run of the rtfMRI session was identical to the first run, with all eight blocks using an equal mixture.
Data acquisition
Experiments were run using the Psychophysics Toolbox for Matlab (http://psychtoolbox.org/). Neuroimaging data were acquired with a 3T MRI scanner (Siemens Skyra) using a 16-channel head coil. We first collected a scout anatomical scan to align axial functional slices to the anterior commissure–posterior commissure line. Functional images were acquired using a gradient-echo, echo-planar imaging sequence (2 s repetition time, 28 ms echo time, 3 mm isotropic voxel size, 64 × 64 matrix, 192 mm field of view, 36 slices) that covered most of the brain. At the end of the fMRI session, a high-resolution magnetization-prepared rapid acquisition gradient-echo (MPRAGE) anatomical scan was acquired for offline spatial registration. To improve registration, an additional coplanar T1 fast low angle shot anatomical scan was also acquired.
Statistics
Because some of the data violated the assumption of normality needed for parametric tests, we used nonparametric tests throughout to determine statistical significance. Subject-level bootstrap resampling44 was used to assess random-effects reliability for comparisons of a small number of variables to chance or each other; one-sided tests were used for directional hypotheses and two-sided tests for non-directional hypotheses. Correlations between two variables were estimated with Spearman’s rank correlation after applying robust methods to eliminate the disproportionate influence of outliers in small samples45. Significance testing on voxel-wise brain maps was conducted with a permutation test in FSL’s “randomise” function46 and corrected for multiple comparisons using threshold-free cluster enhancement47. Each control participant was matched to one experimental participant in all respects except for the key manipulation (that is, on demographics, stimuli and number of runs), and so comparisons across groups were performed with a matched-pairs sample design.
Real-time analyses
Preprocessing
During the fMRI session, data were reconstructed on the scanner. Prospective acquisition correction and retrospective motion correction were applied. Each motion-corrected volume was transferred to a separate analysis computer in real time. A brain mask was applied to eliminate non-brain voxels. The volume was spatially smoothed in Matlab using a Gaussian kernel with full-width half-maximum (FWHM) = 5 mm. After each grouping of four stable blocks, the BOLD activity of every voxel was z-scored over time. The same normalization was applied during feedback blocks in real time, using the mean and standard deviation from the most recent four stable blocks.
Multivariate pattern analysis
During the fMRI session, we conducted MVPA using penalized logistic regression with L2-norm regularization (penalty = 1). The classifier was trained to distinguish top-down attention to faces and scenes from whole-brain activity patterns. The training examples for the classifier were obtained from a trailing window of stable blocks. For half of the participants, this trailing window included the twelve previous stable blocks and the classifier was trained during a 70-s fixation period between blocks 4 and 5 of the current run. For the other half, the trailing window did not include the stable blocks from the current run and the classifier was trained between runs; the fixation period between blocks 4 and 5 was reduced to 6 s. There were no reliable differences between these groups, and so they were analyzed together. For training the model, all regressors were shifted 4 s forward in time to adjust for the hemodynamic lag.
The trained model was tested in real time on brain volumes obtained during the feedback blocks. For each volume, the classifier estimated the extent to which the brain activity pattern matched the pattern for the two attentional states on which it was trained (from 0 to 1). The neurofeedback was based on the difference of classifier outputs for the task-relevant category minus task-irrelevant category. These outputs are perfectly anticorrelated in a two-class classifier, such that the difference ranged from −1 to 1. As a result of the anticorrelation, it is difficult to disentangle less attention to the task-relevant category from more attention to the task-irrelevant category (and vice versa). Differences of −1 and 1 should thus be interpreted in relative terms as more attention to the task-irrelevant and task-relevant categories, respectively. Note that if participants were not in either attentional state, the brain activity patterns would contain no signal that the classifier could identify and the classification would be driven by noise; the difference would then be 0 on average. We therefore interpret positive and negative values away from 0 as evidence of selective attention to one category of the composite stimulus.
Neurofeedback
The output of the classifier was used to determine the proportion of the images from the task-relevant and task-irrelevant categories in the composite stimulus on the next trial. The preprocessing and decoding of volume i were performed during volume i + 1 and the classifier output was used to update the stimulus mixture for the two trials in volume i + 2. This resulted in a minimum lag of 2 s (two trials) between data acquisition and feedback. Moreover, classifier output was averaged over a moving window of the preceding three volumes (i − 2, i − 1 and i for feedback in volume i + 2), meaning that feedback was based on brain states 2–8 s in the past. Because sustained attention fluctuates slowly20, we reasoned that this smoothing would provide a better estimate of attentional state by reducing high-frequency noise.
The average classifier output was mapped to a proportion of the task-relevant category using a sigmoidal transfer function (Supplementary Figs. 4 and 5). The maximum output value (0.98) meant that the task-irrelevant image could be almost completely absent from the composite stimulus. The minimum output value (0.17) meant that the task-relevant image was always present to some degree, even when participants had lapsed completely (giving them a foothold to recover). The inflection point of the logistic function was centered at an input greater than chance (0.60), based on the mean decoding accuracy of a group of pilot participants. This placed the sensitive range of the feedback closer to the typical real-time classifier output values. For follow-up analyses that assessed how the feedback changed over training, we computed the average proportion of the image from the task-relevant category in each training run and calculated the linear slope across runs for each participant.
Participants were aware of the feedback manipulation. Before the fMRI session, they were told that the images in the second half of most runs would change depending upon their attention, as measured from their brain. Specifically, the task would get easier if they were paying attention and it would get harder if they became inattentive. They were shown examples of how a composite stimulus could change on the basis of whether they were doing a good or bad job of paying attention. Critically, control participants received the exact same instructions. After the study, participants completed a debriefing questionnaire, which included the question: “Did you feel that you could control the image with your brain?” Overall, 11 of 16 participants in the feedback group reported feeling some degree of brain control, compared to 4 of 16 participants in the control group. Interestingly, the feedback that the control participants received was positively correlated on average with what they would have received on the basis of their own brain activity patterns (mean r = 0.29, s.e.m. = 0.04, P < 0.00001). This correlation suggests that their attentional state was affected by the sham feedback, which in turn determined what feedback they should have received next. Unlike the feedback participants, however, the control participants were only reacting to the feedback and not driving it.
Offline analyses
General procedures
Using FSL (http://fsl.fmrib.ox.ac.uk/), the data were temporally high-pass filtered (200 s period cut-off), motion corrected again, and spatially smoothed with a Gaussian kernel (5 mm FWHM). They were then transformed into standard Montreal Neurological Institute (MNI) space by linearly registering to the MPRAGE images and to the MNI152 standard brain. We conducted offline MVPA using the Princeton Multi-Voxel Pattern Analysis Toolbox (http://www.pni.princeton.edu/mvpa/), with z-scoring over time within each run and the same type of classifier as in the real-time analyses (penalized logistic regression using L2-norm regularization, penalty = 1).
Decoding accuracy
We assessed our ability to decode attentional state within individual participants by classifying the stable blocks, which were uncontaminated by stimulus-based feedback. (In fact, these data served as the training set for real-time classification, but were never subdivided into training and test sets so that classifier accuracy could be estimated with cross-validation.) We trained a classifier using the stable blocks from n − 1 runs and tested it on the left-out run, and then repeated n times. By averaging over these folds, we obtained a measure of how well we could decode the attentional state of each participant and assessed reliability in the group relative to chance (0.5). We interpreted this decoding accuracy as reflecting the neural separability of attentional states rather than the precision with which the classifier algorithm captured these states per se. That is, low decoding accuracy for a participant does not necessarily mean that his or her classifier itself was inaccurate, but rather that it was accurately tracking poor neural separation between attentional states. Such separation may be related to individual differences in attentional abilities, with poor separation reflecting weaker selection of task-relevant information and/or increased distraction by task-irrelevant information. To verify this interpretation, we correlated decoding accuracy across participants with behavioral sensitivity from the pre-training session. We used A′ to index sensitivity because of its robustness to the high hit rates that we expected to obtain because of the greater frequency of targets than lures48.
Predicting behavioral accuracy
For classifier output to provide useful feedback for training purposes, (1) it should be related to behavior on a trial-by-trial basis within participant and (2) this relationship should hold without artificially shifting trials back in time to correct for the hemodynamic lag (which cannot be done in real time). To judge whether these criteria were satisfied, we examined whether the classifier output before a lure trial (averaged over the three preceding volumes, as used to calculate feedback) predicted whether participants correctly withheld their response or incorrectly responded. This relationship was tested with a logistic regression (correct rejection = 1, false alarm = 0), whose slope was reliably positive at the group level (mean slope = 0.67, s.e.m. = 0.11, P < 0.00001). That is, more classifier evidence from volumes 2–8 s in the past — most influenced by neural events 6–12 s in the past, assuming a hemodynamic peak at 4 s — predicted behavioral accuracy on the current trial.
The average RT from the six trials during these volumes also predicted behavioral accuracy in a logistic regression (mean slope = 0.01, s.e.m. = 0.0009, P < 0.00001; Supplementary Fig. 2). To remove this confound, we averaged the two RTs from each volume, regressed this average out of the raw classifier output and behavioral accuracy across volumes, and then repeated the analysis above in the residuals (using partial correlation rather than logistic regression because behavioral accuracy was no longer binary). The positive relationship between classifier output and behavioral accuracy remained reliable (mean r = 0.06, s.e.m. = 0.01, P < 0.00001; Supplementary Fig. 3).
Changes in neural discriminability
We performed several analyses to examine whether attention training increased the separation between neural representations of the face and scene attentional states. We operationalized neural separation with decoding accuracy, comparing the first and last runs of the rtfMRI training session to assess training-induced changes. For each of these runs, we trained a classifier to decode attentional state from the stable blocks using a split-half cross-validation procedure. To ensure that classification was not confounded by RT, we averaged the two RTs in every volume of the stable blocks and regressed out the resulting RT time course from the brain data prior to analysis27. We calculated the difference in decoding accuracy as the last minus first run for each participant and assessed the reliability of this change at the group level, comparing feedback and control groups. This analysis was performed over the whole brain, within each of the 4 lobes (defined using the MNI atlas in FSL), and over spherical searchlights (1 voxel radius, 7 voxel maximum volume) centered on every voxel in the brain.
Simulated feedback
For the univariate analysis of FFA and PPA, we localized these areas within each participant by contrasting face and scene attention blocks in the first fMRI run (which had no feedback). FFA and PPA ROIs were defined as 5-mm spheres around the peak face- and scene-selective voxels in right and left lateral fusiform gyri and collateral sulci/parahippocampal gyri, respectively. We then collapsed over hemispheres and averaged the time series of the voxels in each bilateral ROI for all feedback blocks (starting in the second fMRI run). For each block, we calculated the difference over time between the task-relevant ROI (FFA and PPA for face and scene attention, respectively) and the task-irrelevant ROI (PPA and FFA for face and scene attention, respectively) and then concatenated these differences across blocks within run. To estimate how FFA and PPA activity related to the real-time feedback in each run, we correlated this ROI-derived time series with the difference in whole-brain classifier output for the task-relevant minus task-irrelevant categories (face minus scene evidence for face attention and scene minus face evidence for scene attention) from the same blocks and then averaged across runs. These FFA/PPA to whole-brain correlations were in turn correlated across feedback participants with the improvement in A′ from pre- to post-training.
For the multivariate analysis of perceptual and attentional networks, we first defined each network using functional and anatomical criteria. The functional criterion was based on forward-inference meta-analyses from http://neurosynth.org/ using the search terms “faces” OR “scenes” for the perceptual network and “attention” for the attentional network. The results were downloaded as voxel-wise masks and thresholded at z = 2.3. The anatomical criterion was based on the MNI atlas in FSL, which was used to generate binary masks of the occipital and temporal lobes for the perceptual network and the frontal and parietal lobes for the attentional network. Voxels that survived the intersection of the functional and anatomical masks were used to train a separate classifier for each network. Other than being performed offline rather than in real time, the rest of the classification procedure was identical to that of the whole-brain classifier, with training for each run based on a moving window of stable blocks and testing occurring volume by volume in the feedback blocks. The classifier output for each network was correlated with the whole-brain classifier output to estimate how much information in that network contributed to the real-time feedback in every run, and these correlations were averaged across runs within each participant. These network/whole-brain correlations were then correlated with the improvement in A′ from pre- to post-training across feedback participants to assess the usefulness of relying on information in the perceptual and attentional networks for training.
Behavioral control experiments
We recruited three behavioral control participants for each fMRI participant from the feedback group of the main study (total n = 48). They were all demographically matched to the fMRI participant in handedness, gender and age (±1 year). In addition, they received the same experimental design, in terms of stimulus order, block order, number of training runs, number of sessions and number of days between sessions. The training session was conducted in a behavioral testing room rather than the scanner. To emulate the contextual change experienced by the fMRI participants in switching environments between pre-/post-training and training, the pre- and post-training sessions were run in a different room in a different part of our building. Across the three groups of participants, we manipulated the nature of the feedback that they received during training. The assignment of control participants to each of these feedback conditions was randomized.
The no-feedback experiment (n = 16) was identical to the fMRI study, other than being conducted outside the scanner and replacing all feedback blocks with stable blocks. That is, the stimulus mixture proportion remained constant at 50% for both categories during all blocks. As a result of removing the feedback, participants also did not receive instructions about how to interpret the varying stimulus proportions and there was no separate, yoked control group.
The RT-feedback experiment was identical to the fMRI study, other than being conducted outside the scanner and having the feedback controlled by RT rather than whole-brain classifier output. This experiment contained two between-subject conditions, the RT-feedback group (n = 16) and the RT-control group (n = 16). Participants were assigned in matched pairs, with the RT-control participant in each pair receiving feedback yoked to that generated by the matched RT-feedback participant. Thus, by definition, the RT-feedback participant was run before their match. However, the RT-feedback and RT-control participants from different pairs were interleaved and run in the same cohort. Participants in both groups received the same instructions, which were slightly modified from the fMRI study to remove scanner-related references. Not only were participants blind to their condition, but the experimenter was also blind (other than the first and last participants, who were necessarily RT-feedback and RT-control participants, respectively). A different researcher conducted participant recruitment and scheduling, resulting in a double-blind procedure. (Note that because of the lack of feedback in the no-feedback experiment, the experimenter was aware of whether a participant ended up in that particular group.)
The feedback regime for the RT-feedback condition was very similar to the fMRI experiment, using RT (instead of fMRI category evidence) as a measure of attentional state. During feedback blocks, the proportion of the task-relevant category increased when participants responded slowly and decreased when they responded quickly. We chose this mapping because RT was faster on trials preceding false alarms than correct rejections (Supplementary Fig. 2), consistent with habitual responding and worse sustained attention9. More specifically, the feedback was based on the participant’s deviation from their average RT, calculated over a trailing window of stable blocks (the same set as used for training data in the fMRI classifier). The stimulus mixture proportion was adjusted using the average of the RTs from the previous six trials, which was equivalent to the three brain volumes that were used for feedback in the fMRI version. A sigmoidal transfer function transformed this value into a stimulus mixture proportion.
Supplementary Material
Acknowledgments
This work was supported by NIH grant R01EY021755, NSF grant BCS1229597, NSF fellowship DGE1148900, and the John Templeton Foundation. The opinions expressed in this publication are those of the authors and do not necessarily reflect the views of these funding agencies.
Footnotes
Author Contributions
M.T.dB., J.D.C., K.A.N., and N.B.T-B. designed the experiment, discussed the data and wrote the paper. M.T.dB. and R.F.L. developed data acquisition and analysis tools. M.T.dB. collected and analyzed the data. All authors read and commented on the manuscript.
A Supplementary Methods Checklist is available.
References
- 1.Chun MM, Golomb JD, Turk-Browne NB. A taxonomy of external and internal attention. Annu Rev Psychol. 2011;62:73–101. doi: 10.1146/annurev.psych.093008.100427. [DOI] [PubMed] [Google Scholar]
- 2.Mackworth NH. The breakdown of vigilance during prolonged visual search. Q J Exp Psychol. 1948;1:6–21. [Google Scholar]
- 3.Redelmeier DA, Tibshirani RJ. Association between cellular-telephone calls and motor vehicle collisions. N Engl J Med. 1997;336:453–458. doi: 10.1056/NEJM199702133360701. [DOI] [PubMed] [Google Scholar]
- 4.Czeisler CA, et al. Modafinil for excessive sleepiness associated with shift-work sleep disorder. N Engl J Med. 2005;353:476–486. doi: 10.1056/NEJMoa041292. [DOI] [PubMed] [Google Scholar]
- 5.Dinges DF, Powell JW. Microcomputer analyses of performance on a portable, simple visual RT task during sustained operations. Behav Res Methods Instrum Comput. 1985;17:652–655. [Google Scholar]
- 6.Sarter M, Givens B, Bruno JP. The cognitive neuroscience of sustained attention: Where top-down meets bottom-up. Brain Res Rev. 2001;35:146–160. doi: 10.1016/s0165-0173(01)00044-3. [DOI] [PubMed] [Google Scholar]
- 7.Wolfe JM, Horowitz TS, Kenner NM. Rare items often missed in visual searches. Nature. 2005;435:439–440. doi: 10.1038/435439a. [DOI] [PMC free article] [PubMed] [Google Scholar]
- 8.Johnson KA, et al. Dissociation in performance of children with ADHD and high-functioning autism on a task of sustained attention. Neuropsychologia. 2007;45:2234–2245. doi: 10.1016/j.neuropsychologia.2007.02.019. [DOI] [PMC free article] [PubMed] [Google Scholar]
- 9.Robertson IH, Manly T, Andrade J, Baddeley BT, Yiend J. ‘Oops!’: Performance correlates of everyday attentional failures in traumatic brain injured and normal subjects. Neuropsychologia. 1997;35:747–758. doi: 10.1016/s0028-3932(97)00015-8. [DOI] [PubMed] [Google Scholar]
- 10.Drew T, Vogel EK. Neural measures of individual differences in selecting and tracking multiple moving objects. J Neurosci. 2008;28:4183–4191. doi: 10.1523/JNEUROSCI.0556-08.2008. [DOI] [PMC free article] [PubMed] [Google Scholar]
- 11.Weiskopf N, et al. Principles of a brain-computer interface (BCI) based on real-time functional magnetic resonance imaging (fMRI) IEEE Trans Biomed Eng. 2004;51:966–970. doi: 10.1109/TBME.2004.827063. [DOI] [PubMed] [Google Scholar]
- 12.LaConte SM. Decoding fMRI brain states in real-time. NeuroImage. 2011;56:440–454. doi: 10.1016/j.neuroimage.2010.06.052. [DOI] [PubMed] [Google Scholar]
- 13.Sulzer J, et al. Real-time fMRI neurofeedback: Progress and challenges. NeuroImage. 2013;76:386–399. doi: 10.1016/j.neuroimage.2013.03.033. [DOI] [PMC free article] [PubMed] [Google Scholar]
- 14.Norman KA, Polyn SM, Detre GJ, Haxby JV. Beyond mind-reading: Multi-voxel pattern analysis of fMRI data. Trends Cogn Sci. 2006;10:424–430. doi: 10.1016/j.tics.2006.07.005. [DOI] [PubMed] [Google Scholar]
- 15.deCharms RC, et al. Control over brain activation and pain learned by using real-time functional MRI. Proc Natl Acad Sci U S A. 2005;102:18626–18631. doi: 10.1073/pnas.0505210102. [DOI] [PMC free article] [PubMed] [Google Scholar]
- 16.Shibata K, Watanabe T, Sasaki Y, Kawato M. Perceptual learning incepted by decoded fMRI neurofeedback without stimulus presentation. Science. 2011;334:1413–1415. doi: 10.1126/science.1212003. [DOI] [PMC free article] [PubMed] [Google Scholar]
- 17.Yoo JJ, et al. When the brain is prepared to learn: Enhancing human learning using real-time fMRI. NeuroImage. 2012;59:846–852. doi: 10.1016/j.neuroimage.2011.07.063. [DOI] [PMC free article] [PubMed] [Google Scholar]
- 18.Hinds O, et al. Roles of default-mode network and supplementary motor area in human vigilance performance: Evidence from real-time fMRI. J Neurophysiol. 2013;109:1250–1258. doi: 10.1152/jn.00533.2011. [DOI] [PubMed] [Google Scholar]
- 19.Yoss RE, Moyer NJ, Hollenhorst RW. Pupil size and spontaneous pupillary waves associated with alertness, drowsiness, and sleep. Neurology. 1970;20:545–554. doi: 10.1212/wnl.20.6.545. [DOI] [PubMed] [Google Scholar]
- 20.Rosenberg M, Noonan S, DeGutis J, Esterman M. Sustaining visual attention in the face of distraction: A novel gradual-onset continuous performance task. Atten Percept Psychophys. 2013;75:426–439. doi: 10.3758/s13414-012-0413-x. [DOI] [PubMed] [Google Scholar]
- 21.O’Craven KM, Downing PE, Kanwisher N. fMRI evidence for objects as the units of attentional selection. Nature. 1999;401:584–587. doi: 10.1038/44134. [DOI] [PubMed] [Google Scholar]
- 22.Al-Aidroos N, Said CP, Turk-Browne NB. Top-down attention switches coupling between low-level and high-level areas of human visual cortex. Proc Natl Acad Sci U S A. 2012;109:14675–14680. doi: 10.1073/pnas.1202095109. [DOI] [PMC free article] [PubMed] [Google Scholar]
- 23.Weissman DH, Roberts KC, Visscher KM, Woldorff MG. The neural bases of momentary lapses in attention. Nat Neurosci. 2006;9:971–978. doi: 10.1038/nn1727. [DOI] [PubMed] [Google Scholar]
- 24.Leber AB, Turk-Browne NB, Chun MM. Neural predictors of moment-to-moment fluctuations in cognitive flexibility. Proc Natl Acad Sci. 2008;105:13592–13597. doi: 10.1073/pnas.0805423105. [DOI] [PMC free article] [PubMed] [Google Scholar]
- 25.Miller EK, Cohen JD. An integrative theory of prefrontal cortex function. Annu Rev Neurosci. 2001;24:167–202. doi: 10.1146/annurev.neuro.24.1.167. [DOI] [PubMed] [Google Scholar]
- 26.Noudoost B, Chang MH, Steinmetz NA, Moore T. Top-down control of visual attention. Curr Opin Neurobiol. 2010;20:183–190. doi: 10.1016/j.conb.2010.02.003. [DOI] [PMC free article] [PubMed] [Google Scholar]
- 27.Todd MT, Nystrom LE, Cohen JD. Confounds in multivariate pattern analysis: Theory and rule representation case study. NeuroImage. 2013;77:157–165. doi: 10.1016/j.neuroimage.2013.03.039. [DOI] [PubMed] [Google Scholar]
- 28.Haxby JV, et al. Distributed and overlapping representations of faces and objects in ventral temporal cortex. Science. 2001;293:2425–2430. doi: 10.1126/science.1063736. [DOI] [PubMed] [Google Scholar]
- 29.Woolgar A, Hampshire A, Thompson R, Duncan J. Adaptive coding of task-relevant information in human frontoparietal cortex. J Neurosci. 2011;31:14592–14599. doi: 10.1523/JNEUROSCI.2616-11.2011. [DOI] [PMC free article] [PubMed] [Google Scholar]
- 30.Turk-Browne NB. Functional interactions as big data in the human brain. Science. 2013;342:580–584. doi: 10.1126/science.1238409. [DOI] [PMC free article] [PubMed] [Google Scholar]
- 31.Reddy L, Kanwisher NG, VanRullen R. Attention and biased competition in multi-voxel object representations. Proc Natl Acad Sci U S A. 2009;106:21447–21452. doi: 10.1073/pnas.0907330106. [DOI] [PMC free article] [PubMed] [Google Scholar]
- 32.Baldauf D, Desimone R. Neural mechanisms of object-based attention. Science. 2014;344:424–427. doi: 10.1126/science.1247003. [DOI] [PubMed] [Google Scholar]
- 33.O’Reilly R, Frank M. Making working memory work: A computational model of learning in the prefrontal cortex and basal ganglia. Neural Comput. 2006;18:283–328. doi: 10.1162/089976606775093909. [DOI] [PubMed] [Google Scholar]
- 34.Kravitz AV, et al. Regulation of parkinsonian motor behaviours by optogenetic control of basal ganglia circuitry. Nature. 2010;466:622–626. doi: 10.1038/nature09159. [DOI] [PMC free article] [PubMed] [Google Scholar]
- 35.Wiecki TV, Frank MJ. A computational model of inhibitory control in frontal cortex and basal ganglia. Psychol Rev. 2013;120:329–355. doi: 10.1037/a0031542. [DOI] [PubMed] [Google Scholar]
- 36.Foerde K, Shohamy D. The role of the basal ganglia in learning and memory: Insight from Parkinson’s disease. Neurobiol Learn Mem. 2011;96:624–636. doi: 10.1016/j.nlm.2011.08.006. [DOI] [PMC free article] [PubMed] [Google Scholar]
- 37.Frank MJ, Badre D. Mechanisms of hierarchical reinforcement learning in corticostriatal circuits 1: Computational analysis. Cereb Cortex. 2012;22:509–526. doi: 10.1093/cercor/bhr114. [DOI] [PMC free article] [PubMed] [Google Scholar]
- 38.Biggs AT, Mitroff SR. Different predictors of multiple-target search accuracy between nonprofessional and professional visual searchers. Q J Exp Psychol 2006. 2014;67:1335–1348. doi: 10.1080/17470218.2013.859715. [DOI] [PubMed] [Google Scholar]
- 39.Disner SG, Beevers CG, Haigh EAP, Beck AT. Neural mechanisms of the cognitive model of depression. Nat Rev Neurosci. 2011;12:467–477. doi: 10.1038/nrn3027. [DOI] [PubMed] [Google Scholar]
- 40.Shallice T, et al. Executive function profile of children with attention deficit hyperactivity disorder. Dev Neuropsychol. 2002;21:43–71. doi: 10.1207/S15326942DN2101_3. [DOI] [PubMed] [Google Scholar]
- 41.Chadick JZ, Gazzaley A. Differential coupling of visual cortex with default network or frontal-parietal network based on goals. Nat Neurosci. 2011;14:830–832. doi: 10.1038/nn.2823. [DOI] [PMC free article] [PubMed] [Google Scholar]
- 42.Moore KS, Yi DJ, Chun M. The effect of attention on repetition suppression and multivoxel pattern similarity. J Cogn Neurosci. 2013;25:1305–1314. doi: 10.1162/jocn_a_00387. [DOI] [PubMed] [Google Scholar]
- 43.Serences JT, Schwarzbach J, Courtney SM, Golay X, Yantis S. Control of object-based attention in human cortex. Cereb Cortex. 2004;14:1346–1357. doi: 10.1093/cercor/bhh095. [DOI] [PubMed] [Google Scholar]
- 44.Efron B, Tibshirani R. Bootstrap methods for standard errors, confidence intervals, and other measures of statistical accuracy. Stat Sci. 1986;1:54–75. [Google Scholar]
- 45.Pernet CR, Wilcox RR, Rousselet GA. Robust correlation analyses: False positive and power validation using a new open source Matlab toolbox. Front Psychol. 2013;3:606. doi: 10.3389/fpsyg.2012.00606. [DOI] [PMC free article] [PubMed] [Google Scholar]
- 46.Nichols TE, Holmes AP. Nonparametric permutation tests for functional neuroimaging: A primer with examples. Hum Brain Mapp. 2002;15:1–25. doi: 10.1002/hbm.1058. [DOI] [PMC free article] [PubMed] [Google Scholar]
- 47.Smith SM, Nichols TE. Threshold-free cluster enhancement: Addressing problems of smoothing, threshold dependence and localisation in cluster inference. NeuroImage. 2009;44:83–98. doi: 10.1016/j.neuroimage.2008.03.061. [DOI] [PubMed] [Google Scholar]
- 48.Donaldson W. Measuring recognition memory. J Exp Psychol Gen. 1992;121:275–277. doi: 10.1037//0096-3445.121.3.275. [DOI] [PubMed] [Google Scholar]
Associated Data
This section collects any data citations, data availability statements, or supplementary materials included in this article.