

Abstract
Joint models for longitudinal and survival data are particularly relevant to many cancer clinical trials and observational studies in which longitudinal biomarkers (eg, circulating tumor cells, immune response to a vaccine, and quality-of-life measurements) may be highly associated with time to event, such as relapse-free survival or overall survival. In this article, we give an introductory overview on joint modeling and present a general discussion of a broad range of issues that arise in the design and analysis of clinical trials using joint models. To demonstrate our points throughout, we present an analysis from the Eastern Cooperative Oncology Group trial E1193, as well as examine some operating characteristics of joint models through simulation studies.
INTRODUCTION
Cancer studies often collect time-to-event data and repeated measurements of longitudinal data for each subject. The longitudinal data, such as circulating tumor cells, immune response to a vaccine, a genetic biomarker, or a health outcome, can be important predictors or surrogates of a time to event, such as relapse-free survival or overall survival. Classical models such as the linear mixed model for longitudinal data and the Cox proportional hazards model for time-to-event data do not consider dependencies between these two different data types (longitudinal and time-to-event data). A powerful method that takes into account the dependency and association between longitudinal data and time-to-event data is joint models for longitudinal and time-to-event data. Joint models for longitudinal and time-to-event data are models that bring these two data types together (simultaneously) into a single model so that one can infer the dependence and association between the longitudinal biomarker and time to event to better assess the effect of a treatment. As a result of the rapid development of clinical and genetic biomarkers in clinical trials, joint modeling has gained its popularity in recent years because it reduces bias in estimates of the treatment effects and provides improvements of efficiency in the assessment of treatment effects and other prognostic factors. Specifically, joint models for longitudinal and survival data are frequently used in quality-of-life (QOL) studies, where it is of interest to examine the association between a patient's QOL and a time-to-event end point. In cancer vaccine trials, immunologic measures such as immunoglobulin G or immunoglobulin M response are often measured longitudinally, and it is of interest to examine their association with time to event. Recent studies suggested that circulating tumor cells are associated with poor patient prognosis and outcomes in patients treated for metastatic cancer and have been used as a surrogate for progression-free survival and overall survival. These types of longitudinal measures themselves are treated as important outcomes, and therefore statistical methods that can model both the longitudinal and the time-to-event components jointly are becoming increasingly essential in most cancer clinical trials.
The early development of joint models for longitudinal and survival data was primarily motivated from HIV/AIDS clinical trials, in particular, joint modeling of survival data and longitudinal CD4 counts. These articles include DeGruttola and Tu,1 Tsiatis et al,2 Faucett and Thomas,3 Faucett et al,4 LaValley and DeGruttola,5 Wulfsohn and Tsiatis,6 Pawitan and Self,7 Taylor et al,8 Brown et al,9 Wang and Taylor,10 and Chi and Ibrahim.11 Other approaches considering a multivariate longitudinal measure include Henderson et al,12 Xu and Zeger,13,14 and Song et al.15
Articles on joint modeling of time-to-event and quality-of-life data in a cancer context include Chi and Ibrahim,11,16 and Kirkwood et al.17,18 Articles on cancer vaccine (immunotherapy) trials include Ibrahim et al,19 Brown and Ibrahim,20,21 and Chen et al.22 Joint modeling in other types of biomedical applications include Schluchter23 and Hogan and Laird.24 An excellent general review article on joint modeling of longitudinal and survival data is given in Tsiatis and Davidian.25 Ibrahim et al26 also give an overview of joint modeling methods in their book. Joint models for longitudinal and survival data in which the survival component of the model is a cure rate model are also useful in cancer research. Law et al,27 Brown and Ibrahim,21 and Chen et al22 consider such models for cancer clinical trials.
WHY SHOULD WE DO JOINT MODELING?
Joint models are increasingly used in clinical trials because (1) they provide more efficient estimates of the treatment effects on the time to event, (2) they provide more efficient estimates of the treatment effects of the longitudinal marker, and (3) they reduce bias in the estimates of the overall treatment effect, that is, the treatment effect on survival and the longitudinal marker. These properties were recently demonstrated in Chen et al (manuscript submitted for publication), as well as in the analysis of the E1193 trial and the simulation studies given here. A less biased estimate leads to a more accurate estimate of the treatment effect. For example, if a particular drug reduces the hazard of a particular disease by 30%, then a joint model may lead to an estimated hazard ratio of 0.75, whereas a conventional model (eg, a Cox model) that does not incorporate the longitudinal data into the analysis may yield a hazard ratio of 0.80. In this case, we say that the estimate based on the joint model is less biased than the Cox model estimate because 0.75 is closer to the true hazard ratio of 0.70. Moreover, joint models typically lead to estimates with a smaller SE than the Cox model estimate of the treatment effect. It was shown in the simulation studies of Chen et al (manuscript submitted for publication) that when the true hazard ratio is 0.67 and the longitudinal effect is moderately correlated with the time to event, the treatment effect was estimated as 0.76 with an SE of 0.063 in a 400-subject study. When the joint model is used, the estimate is 0.67 (unbiased) with a smaller SE of 0.051. This is promising because a smaller SE implies a more precise estimate. As a result, joint models are now increasingly used and often preferred over the Cox model alone because they yield more accurate and more precise estimates of the treatment effect. This phenomenon also has major implications on the design of a study. Greater efficiency implies higher power and smaller sample sizes in designing clinical trials. Thus incorporating the longitudinal data into the design of a study has the potential of yielding lower sample sizes with higher power compared with that of conventional designs based on time-to-event data alone (Chen et al, manuscript submitted for publication).
THE STRUCTURE OF A JOINT MODEL
There are two basic components of a joint model: the longitudinal component and the time-to-event (survival) component. The longitudinal component consists of a model for the longitudinal biomarkers. This model typically consists of a linear mixed model; in other words, it consists of a linear model with random effects. This linear mixed model has the structure
 |
where Yij is the observed outcome for the ith subject at the jth time point. The quantity εij is a random error term and is usually assumed to be normally distributed. The quantity Xij is typically called the trajectory function of the model. The trajectory function is typically specified as a linear function of time tij and a treatment indicator Zi, given by Xij = θ0i + θ1i × tij + γZi, or as a quadratic function of time. The quantities θ0i and θ1i are assumed to be random and have a multivariate normal distribution. The coefficient γ assesses the treatment effect on the longitudinal marker. The survival component of the joint model typically consists of a parametric model, such as an exponential model or a Weibull model. The longitudinal and survival components of the joint model are typically linked (joined) through the trajectory function. Specifically, the hazard function of the survival model at time t can be written as:
 |
where α is the direct treatment effect on the time to event. The parameter β measures the association between the longitudinal marker and the time to event. Figure 1 shows the underlying causal diagram for joint modeling. The diagram focuses on testing the direct treatment effect on survival, which is assessed by the estimate of α, and the effect of the longitudinal process on survival, which is assessed by the estimate of β. In this joint model, we see that there are three types of treatment effects: (1) γ, which is the treatment effect on the longitudinal marker; (2) α, which is the treatment effect on the time to event; and (3) βγ + α, which we call the overall treatment effect. Our inferential goal is then to estimate the parameters, α, β, and γ, and design clinical trials based on these joint models using prespecified values of α, β, and γ (see Chen et al, manuscript submitted for publication). A value of β = 0 means that there is no association between the longitudinal marker and the event time, which implies that information from the longitudinal marker does not improve on the estimate of the survival treatment effect α compared with an analysis based on the time-to-event data alone. In this case, no joint modeling is needed and one may ignore the longitudinal data in carrying out the survival analysis. A value of β less than 0 implies that the hazard decreases, which in turn implies that increases in the longitudinal marker yield increases in the time to event.
Fig 1.
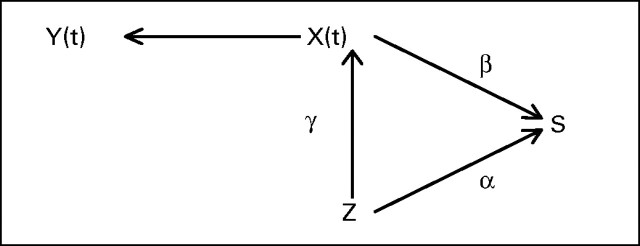
Causal diagram. Y(t), observed longitudinal data; X(t), trajectory function; S, survival; Z, treatment; α, treatment effect on survival; γ, treatment effect on longitudinal process; β, effect of longitudinal process on survival.
Although other joint modeling formulations have been proposed in the literature, we focus here on the model described above, as it is the earliest developed joint model and leads to a straightforward interpretation of the overall treatment effect. It allows the trajectory to be different for different treatment groups through the coefficient γ. For example, if treatment is negatively associated with the longitudinal marker, such as circulating tumor cells, for example, the trajectory will decrease more steeply over time in the treatment group compared with the trajectory of the marker in the control group. Its effect on the time to event, such as relapse-free survival, is measured by β. For example, if β = 0.5, it means that the hazard will increase by 0.5 per unit increase in the trajectory in any treatment group. Hsieh et al28 examined the robustness and efficiency of the estimates from this joint model through simulation studies and concluded that the estimates were both robust and efficient. One limitation of this model is that it assumes a common trajectory structure in both treatment groups. If the trajectory structure is very different, such as a linear function of time in one treatment group, and a quadratic function of time in another treatment group, it will be necessary to fit a different joint model for each group.
DESIGN AND ANALYSIS STRATEGIES IN JOINT MODELS
One of the natural strategies to consider in the joint analysis of longitudinal and survival data is to incorporate the longitudinal measures directly into the Cox model as time-varying covariates and then proceed with the Cox model analysis. However, because the longitudinal measures typically have a great deal of random error from subject to subject, this approach will lead to highly biased (typically attenuated) and inefficient estimates of the treatment effect. One of the first approaches that posited a linear mixed model for the longitudinal data is the two-stage approach described in Tsiatis et al,2 where a linear mixed model is fit to the longitudinal data, and then the fitted trajectory function is inserted into the Cox model as a time-varying covariate at the second stage. This approach is certainly better than using the raw longitudinal data as time-varying covariates in the Cox model, but it still leads to potentially biased and inefficient estimates. Many articles on joint modeling have now emerged since the Tsiatis et al2 article, where estimates are computed based on a joint model rather than a two-stage model.
Incorporating longitudinal information into the design of a time-to-event study is also greatly beneficial because it may lead to higher power and lower sample size as compared with designing a study based on time-to-event data alone. In a recent article, Chen et al (manuscript submitted for publication) derive sample size formulas on the basis of joint models and show that higher power is obtained in settings where the longitudinal marker is highly correlated with the time to event and treatment. For example, if the true hazard ratio is 0.7 between treatment and control, this will require a total of 283 events to achieve 85% power using a one-sided .025 level score test. If we do not incorporate the longitudinal information into the model, this will result in a hazard ratio of 0.73, thus requiring a total of 363 events to achieve similar power. Therefore, if the longitudinal marker and time-to-event outcome have sufficiently high correlation, a joint model leads to an increased hazard ratio between control and treatment arms, thus requiring fewer subjects for a given desired power.
SPECIFIC EXAMPLES IN WHICH JOINT MODELS ARE USED
QOL
The collection of QOL data in cancer clinical trials has become increasingly common, particularly when the survival benefit of a treatment is anticipated to be small or modest. In fact, one might argue that for a patient, improvement in QOL is often more important than any modest survival benefit in treatment decisions. Therefore, it is of great interest in these studies to characterize the association between time to event and QOL through joint modeling and to understand the trade-offs between QOL and survival. A specific chemotherapy may prolong survival or relapse, but the QOL in that prolonged period may be poor, and thus the clinician must decide whether such a benefit is worth it for these patients.
Joint Modeling Analysis of E1193
As a specific example, we consider Eastern Cooperative Oncology Group trial E1193; the goal in this study was to examine the association between QOL and overall survival time for the patients on the study. E1193 was a phase III cancer clinical trial of doxorubicin, paclitaxel, and the combination of doxorubicin and paclitaxel as front-line chemotherapy for metastatic breast cancer. Patients receiving single-agent doxorubicin or paclitaxel crossed over to the other agent at time of progression. QOL was assessed using the Functional Assessment of Cancer Therapy–Breast scale (Brady et al29). The Functional Assessment of Cancer Therapy–Breast includes five general subscales (physical, social, relationship with physician, emotional, and functional), as well as a breast cancer–specific subscale. The maximum possible score is 148 points. A higher score is indicative of better QOL. In this subset analysis, we analyzed overall survival after entry to the cross-over phase (survival after disease progression) and its association with treatment and QOL, which was measured at two time points during this phase.
A total of 252 patients entered the cross-over phase and had at least one QOL measurement, 124 patients crossed over from paclitaxel to doxorubicin (median survival is 13.0 months in this subgroup), and 128 patients crossed over from doxorubicin to paclitaxel (median survival is 14.9 months in this subgroup). The data we used are quite mature; only two subjects who crossed over to doxorubicin and six subjects who crossed over to paclitaxel were censored. However, a substantial proportion (35%) of patients had only one QOL measurement. If missing data are informative, it can lead to biased estimates of the QOL effect and the treatment effect in classical models. However, this specific issue is beyond the scope of this present article and will be taken up elsewhere. A few QOL measurements seemed to be outliers and this may be due to data errors. We decided not to exclude them, however, because one of the advantages of using a joint model is its ability to reduce bias resulting from incomplete or error-prone data.
To get a feel for what the trajectories look like, we plotted the trajectory function for the E1193 study. Figure 2 shows the linear trajectory Xij for each subject. We see from this plot that these trajectories typically have a lot of noise, and hence treating them as random is a key part of the analysis. To compare results from different analysis strategies, we applied the Cox model with the treatment covariate only, the two-stage model incorporating the two QOL measurements, and the joint model of section 3 to examine the treatment effect and the association between QOL and overall survival. We refer the reader to the article by Wulfsohn and Tsiatis6 for more mathematical details on this joint model. Because there are only two QOL measurements, we assumed the QOL trajectory is a linear function of time. To satisfy the normality assumption for the longitudinal QOL data, we transformed the observed QOL to QOL1/2. We tested the treatment-by-time interaction term in a separate mixed model based on the QOL data alone, and the interaction term was not significant. As a result, it is reasonable to assume that QOL1/2 follows a trajectory of the form θ0i + θ1i t + γTreatment in the two-stage model and the joint model. Results are reported in Table 1.
Fig 2.

Trajectory function for E1193 study. QOL, quality of life.
Table 1.
Parameter Estimates With SEs for the E1193 Data
| Parameter | Cox Model With Treatment Only |
Two-Stage Model |
Joint Model |
|||
|---|---|---|---|---|---|---|
| Parameter Estimate | SE | Parameter Estimate | SE | Parameter Estimate | SE | |
| Overall treatment (α̂ + β̂γ̂) | −0.251 | 0.130 | −0.261 | 0.130 | −0.277 | 0.141 |
| Treatment effect on survival (α̂) | −0.245 | 0.136 | ||||
| Treatment effect on QOL (γ̂) | 0.083* | 0.129 | 0.073 | 0.129 | ||
| QOL's effect on survival (β̂) | −0.277 | 0.071 | −0.445 | 0.118 | ||
Abbreviation: QOL, quality of life.
Obtained from the first stage model with both intercept and time of measurement included in the trajectory function.
From Table 1, we see that the overall treatment effect is estimated as −0.251 (equivalent to a hazard ratio of 0.779) in a Cox model without incorporating the QOL data. The overall treatment effect is estimated as −0.261 (hazard ratio of 0.771) in the two-stage model and estimated as −0.277 (hazard ratio of 0.756) in the joint model. This is consistent with the results of the simulation studies reported in Chen et al (manuscript submitted for publication). The joint modeling approach typically gives unbiased and larger estimates of the treatment effect when the longitudinal data (QOL in this analysis) is associated with survival. The estimates of β in the two-stage model and the joint model, denoted β̂, are similar and consistent with the findings in Wulfsohn and Tsiatis,6 where they reported a slightly larger β̂ and SE in the joint model as compared with the two-stage model. For the E1193 data, β̂ = −0.277 (SE = 0.071) in the two-stage model, and β̂ = −0.445 (SE = 0.118) in the joint model.
Simulation Studies
To examine the operating characteristics and evaluate the performance of the proposed joint modeling approach and two commonly used (naive) approaches on the assessment of the treatment effect, 12 sets of simulation studies with different values of α = (0, 0.5), β = (0, 0.25, 0.5), and γ = (0, 0.5) were performed. For each set of simulations, 1,000 replications were used. For each replication, 400 subjects were generated, with 200 each in the treatment and control arms. The true longitudinal trajectory was simulated as Xij = θ0i + θ1i × tij + γZi, where θ0i ∼ N(0,1), θ1 ∼ N(0,0.52), and the (moderate) correlation between (θ0i, θ1i) is 0.3. The observed longitudinal data were simulated from the model Yi (tj) = N (Xi(tj), σe2) with σe2 = 0.52. The time of measurement for the longitudinal data is fixed at tj = (0, 0.5, 1.0, 1.5, 2.0, 2.5) years after enrollment, with a maximum of six measurements. The survival time is generated from equation 2 with a constant baseline hazard of λ(t) = 0.25 (median survival = 2.77 years) using an inverse probability method. We assume uniform right censoring for the survival time in the interval1,3 to allow a minimum follow-up time of 1 year. We fit three models for each simulation: (1) a Cox model (denoted as model A) without the longitudinal trajectory; (2) a Cox model using the observed longitudinal data as a time-dependent covariate (denoted as model B); (3) the joint model discussed in equations 1 and 2 (Wulfsohn and Tsiatis6).
Table 2 presents the bias, SEs, 95% CI coverage probabilities, and type I and II error rates for the estimation of the treatment effect on survival (ie, α), comparing the two naive approaches and the joint model. First, Table 2 suggests that ignoring the longitudinal process in the proportional hazards model (model A) could result in a biased estimate of the treatment effect on survival with a less than nominal level of 95% for the CI coverage probability when the effect of treatment on the longitudinal process (ie, γ) and the effect of the longitudinal process on survival (ie, β) are not equal to zero under the null hypothesis (ie, α = 0) or when the effect of the longitudinal process on survival (ie, β) is not equal to zero under the alternative hypothesis (ie, α ∼ 0). For example, when β = 0.5 and γ = 0.5, the estimate of α is positively biased by 0.206 with an empirical 95% CI coverage probability equal to 0.567 under the null hypothesis of α = 0, whereas it is positively biased by 0.115 with an empirical 95% CI coverage probability equal to 0.838 under the alternative hypothesis corresponding to α = 0.5. Second, Table 2 also suggests that both the Cox model B and the joint model give nearly unbiased estimates for the treatment effect on survival (ie, α) and a very close nominal level of 95% for the CI coverage probability. Finally, the SEs for the estimate of α are similar for the three approaches based on the simulations we have considered here.
Table 2.
Comparison of the Estimation of the Direct Treatment Effect on Survival (α)
| α | β | γ | Cox Model A |
Cox Model B |
Full Joint Model |
|||||||||
|---|---|---|---|---|---|---|---|---|---|---|---|---|---|---|
| Bias | SE | 95% CP | Type I/II Error* | Bias | SE | 95% CP | Type I/II Error* | Bias | SE | 95% CP | Type I/II Error* | |||
| 0 | 0 | 0 | −0.004 | 0.161 | 0.958 | 0.042 | −0.004 | 0.161 | 0.958 | 0.042 | −0.004 | 0.161 | 0.962 | 0.038 |
| 0 | 0 | 0.5 | −0.004 | 0.161 | 0.958 | 0.042 | −0.005 | 0.164 | 0.960 | 0.040 | −0.004 | 0.163 | 0.959 | 0.041 |
| 0 | 0.25 | 0 | 0.000 | 0.133 | 0.957 | 0.043 | 0.000 | 0.133 | 0.955 | 0.045 | 0.000 | 0.133 | 0.949 | 0.051 |
| 0 | 0.25 | 0.5 | 0.120 | 0.131 | 0.863 | 0.137 | 0.012 | 0.133 | 0.949 | 0.051 | 0.000 | 0.132 | 0.947 | 0.053 |
| 0 | 0.5 | 0 | 0.000 | 0.118 | 0.957 | 0.043 | 0.000 | 0.118 | 0.953 | 0.047 | 0.000 | 0.119 | 0.951 | 0.049 |
| 0 | 0.5 | 0.5 | 0.206 | 0.116 | 0.567 | 0.433 | 0.026 | 0.118 | 0.950 | 0.050 | 0.000 | 0.118 | 0.946 | 0.054 |
| 0.5 | 0 | 0 | 0.001 | 0.149 | 0.964 | 0.065 | 0.002 | 0.149 | 0.965 | 0.068 | 0.003 | 0.149 | 0.964 | 0.067 |
| 0.5 | 0 | 0.5 | 0.001 | 0.149 | 0.964 | 0.065 | 0.001 | 0.152 | 0.967 | 0.085 | 0.002 | 0.149 | 0.961 | 0.077 |
| 0.5 | 0.25 | 0 | −0.023 | 0.126 | 0.956 | 0.027 | −0.003 | 0.127 | 0.954 | 0.018 | 0.002 | 0.127 | 0.953 | 0.016 |
| 0.5 | 0.25 | 0.5 | 0.095 | 0.125 | 0.900 | 0.003 | 0.010 | 0.127 | 0.957 | 0.014 | 0.001 | 0.125 | 0.950 | 0.014 |
| 0.5 | 0.5 | 0 | −0.089 | 0.115 | 0.888 | 0.040 | −0.016 | 0.116 | 0.953 | 0.009 | 0.004 | 0.117 | 0.954 | 0.010 |
| 0.5 | 0.5 | 0.5 | 0.115 | 0.114 | 0.838 | 0.000 | 0.010 | 0.116 | 0.956 | 0.006 | 0.002 | 0.114 | 0.948 | 0.009 |
Abbreviation: 95% CP, 95% CI coverage probability.
Type I or II error rate based on 1,000 simulations.
Table 3 presents bias, SEs, 95% CI coverage probabilities, and type I and II error rates for the association between the longitudinal process and survival (ie, β), comparing the joint model with the naive approach that treats the error-prone longitudinal data as a time-varying covariate in the Cox model. First, Table 3 suggests that the naive approach gives biased estimates of β and a less than nominal level of 95% for the CI coverage probability when β ∼ 0, whereas the joint modeling approach gives unbiased estimates. For example, when α = 0.5 and γ = 0.5, the estimate of β is biased toward the null by −0.071 with an empirical 95% CI coverage probability equal to 0.668 under the alternative hypothesis when β = 0.5. Second, Table 3 also suggests that the joint model gives nearly unbiased estimates for the effect of the longitudinal process on survival (ie, β) and a very close to the nominal level of 95% for the CI coverage probability. Finally, the joint modeling approach gives slightly smaller SEs for the estimates of β and smaller type II error rates compared with the naive approach that treats the observed error-prone longitudinal biomarkers as time-dependent covariates (Cox model B). Based on the 12 scenarios that we have considered, the average SE for the estimate of β for Cox model B and the joint model are 0.053 and 0.042, respectively, suggesting that the joint model is more efficient.
Table 3.
Comparison of the Estimation of the Longitudinal Data Effect on Survival (β)
| α | β | γ | Cox Model B |
Full Joint Model |
||||||
|---|---|---|---|---|---|---|---|---|---|---|
| Bias | SE | 95% CP | Type I/II Error* | Bias | SE | 95% CP | Type I/II Error* | |||
| 0 | 0 | 0 | 0.002 | 0.062 | 0.945 | 0.055 | 0.000 | 0.045 | 0.955 | 0.045 |
| 0 | 0 | 0.5 | 0.002 | 0.062 | 0.945 | 0.055 | 0.000 | 0.045 | 0.955 | 0.045 |
| 0 | 0.25 | 0 | −0.023 | 0.051 | 0.933 | 0.002 | 0.003 | 0.038 | 0.947 | 0.000 |
| 0 | 0.25 | 0.5 | −0.024 | 0.051 | 0.925 | 0.007 | 0.003 | 0.038 | 0.948 | 0.000 |
| 0 | 0.5 | 0 | −0.063 | 0.050 | 0.733 | 0.000 | 0.005 | 0.043 | 0.952 | 0.000 |
| 0 | 0.5 | 0.5 | −0.066 | 0.049 | 0.720 | 0.000 | 0.004 | 0.044 | 0.954 | 0.000 |
| 0.5 | 0 | 0 | 0.001 | 0.057 | 0.951 | 0.049 | 0.001 | 0.041 | 0.948 | 0.052 |
| 0.5 | 0 | 0.5 | 0.001 | 0.057 | 0.951 | 0.049 | 0.001 | 0.041 | 0.948 | 0.052 |
| 0.5 | 0.25 | 0 | −0.027 | 0.049 | 0.922 | 0.002 | 0.002 | 0.037 | 0.954 | 0.000 |
| 0.5 | 0.25 | 0.5 | −0.028 | 0.049 | 0.924 | 0.003 | 0.002 | 0.038 | 0.946 | 0.000 |
| 0.5 | 0.5 | 0 | −0.068 | 0.049 | 0.713 | 0.000 | 0.005 | 0.044 | 0.954 | 0.000 |
| 0.5 | 0.5 | 0.5 | −0.071 | 0.049 | 0.668 | 0.000 | 0.004 | 0.045 | 0.956 | 0.000 |
Abbreviation: 95% CP, 95% CI coverage probability.
Type I or II error rate based on 1,000 simulations.
DISCUSSION
In this article, we have discussed advantages and applications of joint models for longitudinal and survival data in cancer clinical trials. We reanalyzed data from a cancer clinical trial investigating the treatment effect with and without incorporation of the longitudinal QOL marker. When the longitudinal data are associated with treatment, the overall treatment effect is an aggregated effect of time-to-event and the longitudinal process. In the E1193 analysis, we found a small treatment effect directly on QOL (the estimate of γ is 0.073 from the joint model). The estimate of the hazard ratio changed from 0.779 when the QOL effect was not incorporated to 0.756 when using the joint model. It has been shown that when the longitudinal data are not associated with treatment (γ = 0), ignoring the longitudinal data will still lead to attenuated estimates of the treatment effect due to fitting an incorrect model (Horowitz,30 Abbring et al31). This phenomenon is not commonly known in clinical trials. The degree of attenuation depends on the degree of the association between the longitudinal data and time-to-event data (β). Furthermore, the estimate of the treatment effect remains unbiased when there is no association between the longitudinal marker and the time to event. Use of a joint modeling analysis strategy leads to the correction of bias and increase in power for estimating the direct treatment effect α and the overall treatment effect βγ + α. However, joint modeling is not yet commonly used in designing cancer clinical trials or in the primary analysis of clinical trials. Most applications of joint modeling in the literature focus more heavily on research issues, and in particular, on estimating the effect of the longitudinal outcome on time to event. When the purpose of the clinical trial is to investigate the effect of the longitudinal outcome on time to event, the joint modeling approach leads to unbiased and more efficient estimates of the longitudinal effect when the correct model for the time-to-event data is used. Chen et al (manuscript submitted for publication) provided a sample size formula and addressed various design issues. The power was found to be related to the covariance matrix of the random effects and the truncated moments of the event time. However, the covariance matrix of the random effects is not known in practice. Its estimate, however, can be used for sample size determination. Frequency and timing of the data collection can also have a significant impact on sample size when the measurement error is relatively large. Therefore, data collection strategies and planning are important when carrying out a joint model study design.
Footnotes
Authors' disclosures of potential conflicts of interest and author contributions are found at the end of this article.
AUTHORS' DISCLOSURES OF POTENTIAL CONFLICTS OF INTEREST
The author(s) indicated no potential conflicts of interest.
AUTHOR CONTRIBUTIONS
Conception and design: Joseph G. Ibrahim
Financial support: Joseph G. Ibrahim
Administrative support: Joseph G. Ibrahim
Provision of study materials or patients: Joseph G. Ibrahim
Collection and assembly of data: Joseph G. Ibrahim, Haitao Chu, Liddy M. Chen
Data analysis and interpretation: Joseph G. Ibrahim, Haitao Chu, Liddy M. Chen
Manuscript writing: Joseph G. Ibrahim, Haitao Chu, Liddy M. Chen
Final approval of manuscript: Joseph G. Ibrahim, Haitao Chu, Liddy M. Chen
REFERENCES
- 1.De Gruttola V, Tu XM. Modeling progression of CD4-lymphocyte count and its relationship to survival time. Biometrics. 1994;50:1003–1014. [PubMed] [Google Scholar]
- 2.Tsiatis AA, DeGruttola V, Wulfsohn MS. Modeling the relationship of survival to longitudinal data measured with error: Applications to survival and CD4 counts in patients with AIDS. J Am Stat Assoc. 1995;90:27–37. [Google Scholar]
- 3.Faucett CJ, Thomas CC. Simultaneously modelling censored survival data and repeatedly measured covariates: A Gibbs sampling approach. Stat Med. 1996;15:1663–1685. doi: 10.1002/(SICI)1097-0258(19960815)15:15<1663::AID-SIM294>3.0.CO;2-1. [DOI] [PubMed] [Google Scholar]
- 4.Faucett CJ, Schenker N, Taylor JMG. Survival analysis using auxiliary variables via multiple imputation, with applications to AIDS clinical trials data. Biometrics. 2002;58:37–47. doi: 10.1111/j.0006-341x.2002.00037.x. [DOI] [PubMed] [Google Scholar]
- 5.LaValley MP, DeGruttola V. Model for empirical Bayes estimators of longitudinal CD4 counts. Stat Med. 1996;15:2289–2305. doi: 10.1002/(SICI)1097-0258(19961115)15:21<2289::AID-SIM449>3.0.CO;2-I. [DOI] [PubMed] [Google Scholar]
- 6.Wulfsohn MS, Tsiatis AA. A joint model for survival and longitudinal data measured with error. Biometrics. 1997;53:330–339. [PubMed] [Google Scholar]
- 7.Pawitan Y, Self S. Modeling disease marker processes in AIDS. J Am Stat Assoc. 1993;83:719–726. [Google Scholar]
- 8.Taylor JMG, Cumberland WG, Sy JP. A stochastic model for analysis of longitudinal AIDS data. J Am Stat Assoc. 1994;89:727–736. [Google Scholar]
- 9.Brown ER, Ibrahim JG, DeGruttola V. A flexible B-spline model for multiple longitudinal biomarkers and survival. Biometrics. 2005;61:64–73. doi: 10.1111/j.0006-341X.2005.030929.x. [DOI] [PubMed] [Google Scholar]
- 10.Wang Y, Taylor JMG. Jointly modelling longitudinal and event time data, with applications to AIDS studies. J Am Stat Assoc. 2001;96:895–905. [Google Scholar]
- 11.Chi Y, Ibrahim JG. A new class of joint models for longitudinal and survival data accomodating zero and non-zero cure fractions: A case study of an International Breast Cancer Study Group trial. Stat Sin. 2007;17:445–462. [Google Scholar]
- 12.Henderson R, Diggle P, Dobson A. Joint modelling of longitudinal measurements and event time data. Biostatistics. 2000;1:465–480. doi: 10.1093/biostatistics/1.4.465. [DOI] [PubMed] [Google Scholar]
- 13.Xu J, Zeger SL. Joint analysis of longitudinal data comprising repeated measures and times to events. Appl Stat. 2001;50:375–387. [Google Scholar]
- 14.Xu J, Zeger SL. The evaluation of multiple surrogate endpoints. Biometrics. 2001;57:81–87. doi: 10.1111/j.0006-341x.2001.00081.x. [DOI] [PubMed] [Google Scholar]
- 15.Song X, Davidian M, Tsiatis AA. An estimator for the proportional hazards model with multiple longitudinal covariates measured with error. Biostatistics. 2002;3:511–528. doi: 10.1093/biostatistics/3.4.511. [DOI] [PubMed] [Google Scholar]
- 16.Chi Y-Y, Ibrahim JG. Joint models for multivariate longitudinal and multivariate survival data. Biometrics. 2006;62:432–445. doi: 10.1111/j.1541-0420.2005.00448.x. [DOI] [PubMed] [Google Scholar]
- 17.Kirkwood JM, Ibrahim JG, Sondak VK, et al. The role of high-and low-dose interferon alfa-2b in high-risk melanoma: First analysis of intergroup trial E1690/S9111/C9190. J Clin Oncol. 2000;18:2444–2458. doi: 10.1200/JCO.2000.18.12.2444. [DOI] [PubMed] [Google Scholar]
- 18.Kirkwood JM, Ibrahim JG, Sosman JA, et al. High-dose interferon Alfa-2b significantly prolonged relapse-free and overall survival compared with the GM2-KLH/QS-21 vaccine in patients with resected stage IIB-III melanoma: Results of intergroup trial E1694/S9512/C509801. J Clin Oncol. 2001;19:2370–2380. doi: 10.1200/JCO.2001.19.9.2370. [DOI] [PubMed] [Google Scholar]
- 19.Ibrahim JG, Chen M-H, Sinha D. Bayesian methods for joint modeling of longitudinal and survival data with applications to cancer vaccine studies. Stat Sin. 2004;14:863–883. [Google Scholar]
- 20.Brown ER, Ibrahim JG. A Bayesian semiparametric joint hierarchical model for longitudinal and survival data. Biometrics. 2003;59:221–228. doi: 10.1111/1541-0420.00028. [DOI] [PubMed] [Google Scholar]
- 21.Brown ER, Ibrahim JG. Bayesian approaches to joint cure rate and longitudinal models with applications to cancer vaccine trials. Biometrics. 2003;59:686–693. doi: 10.1111/1541-0420.00079. [DOI] [PubMed] [Google Scholar]
- 22.Chen M-H, Ibrahim JG, Sinha D. A new joint model for longitudinal and survival data with a cure fraction. J Multivar Anal. 2004;91:18–34. [Google Scholar]
- 23.Schluchter MD. Methods for the analysis of informatively censored longitudinal data. Stat Med. 1992;11:1861–1870. doi: 10.1002/sim.4780111408. [DOI] [PubMed] [Google Scholar]
- 24.Hogan JW, Laird NW. Model-based approaches to analyzing incomplete longitudinal and failure time data. Stat Med. 1997;16:239–257. doi: 10.1002/(sici)1097-0258(19970215)16:3<259::aid-sim484>3.0.co;2-s. [DOI] [PubMed] [Google Scholar]
- 25.Tsiatis AA, Davidian M. Joint modeling of longitudinal and time-to-event data: An overview. Stat Sin. 2004;14:809–834. [Google Scholar]
- 26.Ibrahim JG, Chen M-H, Sinha D. Bayesian Survival Analysis. New York, NY: Springer-Verlag; 2001. [Google Scholar]
- 27.Law NJ, Taylor JMG, Sandler H. The joint modeling of a longitudinal disease progression marker and the failure time process in the presence of cure. Biostatistics. 2002;3:547–563. doi: 10.1093/biostatistics/3.4.547. [DOI] [PubMed] [Google Scholar]
- 28.Hsieh F, Tseng Y-K, Wand J-L. Joint modeling of survival and longitudinal data: Likelihood approach revisited. Biometrics. 2006;62:1037–1043. doi: 10.1111/j.1541-0420.2006.00570.x. [DOI] [PubMed] [Google Scholar]
- 29.Brady MJ, Cella DF, Mo F, et al. Reliability and validity of the Functional Assessment of Cancer Therapy–Breast (FACT-B) quality of life instrument. J Clin Oncol. 1997;15:974–986. doi: 10.1200/JCO.1997.15.3.974. [DOI] [PubMed] [Google Scholar]
- 30.Horowitz JL. Semiparametric estimation of a proportional hazard model with unobserved heterogeneity. Econometrica. 1999;67:1001–1028. [Google Scholar]
- 31.Abbring JH, Van den Berg GJ. The unobserved heterogeneity distribution in duration analysis. Biometrika. 2007;94:87–99. [Google Scholar]