

Abstract
Autophagy assures cellular homeostasis, and gains increasing importance in cancer, where it impacts on carcinogenesis, propagation of the malignant phenotype and development of resistance. To date, its tissue-based analysis by immunohistochemistry remains poorly standardized. Here we show the feasibility of specifically and reliably assessing the autophagy markers LC3B and p62 (SQSTM1) in formalin fixed and paraffin embedded human tissue by immunohistochemistry. Preceding functional experiments consisted of depleting LC3B and p62 in H1299 lung cancer cells with subsequent induction of autophagy. Western blot and immunofluorescence validated antibody specificity, knockdown efficiency and autophagy induction prior to fixation in formalin and embedding in paraffin. LC3B and p62 antibodies were validated on formalin fixed and paraffin embedded cell pellets of treated and control cells and finally applied on a tissue microarray with 80 human malignant and nonneoplastic lung and stomach formalin fixed and paraffin embedded tissue samples. Dot-like staining of various degrees was observed in cell pellets and 18/40 (LC3B) and 22/40 (p62) tumors, respectively. Seventeen tumors were double positive for LC3B and p62. P62 displayed additional significant cytoplasmic and nuclear staining of unknown significance. Interobserver-agreement for grading of staining intensities and patterns was substantial to excellent (kappa values 0.60-0.83). In summary, we present a specific and reliable IHC staining of LC3B and p62 on formalin fixed and paraffin embedded human tissue. Our presented protocol is designed to aid reliable investigation of dysregulated autophagy in solid tumors and may be used on large tissue collectives.
Key words: Immunohistochemistry, immunofluorescence, formalin fixed paraffin embedded tissue, LC3B, p62, cancer
Introduction
Under stress conditions such as nutrient-shortage cells activate an alternative source of energy that enables continuous cell survival.1,2 This process is known as macroautophagy (hereafter referred to as autophagy) and allows recycling of long-lived proteins and organelles to maintain cellular homeostasis.3,4 A hallmark of autophagy is the formation of double-membrane cytosolic vacuoles, the so-called autophagosomes, in which proteins and organelles are engulfed. Later, the autophagosomes fuse with lysosomes to degrade and recycle their content. The process of autophagy is regulated by a series of autophagy-related genes (ATGs).5 Two ubiquitin-like conjugation systems are crucial for autophagosome formation and cargo recruitment, namely the ATG12-ATG5-ATG16 and the ATG8 conjugation system.6 The latter one is mediating the lipidation of ATG8 family members including the human homologoues LC3A-C and GABARAPs.7 LC3B is the most widely used marker to monitor autophagy.8,9 Lipidated LC3B (LC3B-II) is incorporated into the outer and inner autophagosomal membrane9 and thereby allows for detection of different stages of autophagic vesicles. An increasing number of studies found that autophagy can be highly selective. Selectivity is achieved by autophagy receptors that on the one hand are able to recognize ligand bound cargo and on the other hand interact with the autophagy machinery.10 One of the best-studied autophagy receptors is p62, also known as sequestosome1 (SQSTM1), which is involved in autophagy-dependent elimination of many different cargos including ubiqutinated protein aggregates and bacteria. Because of its interaction with LC3, p62 is constantly degraded via autophagy and autophagy inhibition leads to the accumulation of p62 positive aggregates.11 Based on these properties monitoring degradation of p62 is used to measure autophagic flux under certain conditions.8 At a physiological level and due to its homeostatic function, autophagy is implicated in several diseases as e.g. neurodegeneration.12-14 In the context of cancer, autophagy is seen as a double-edged sword. Under normal conditions autophagy is tumor-suppressive due to its role in removal of damaged organelles and toxic protein aggregates. In this function autophagy prevents genome instability.15 In cancer cells, however, autophagy may promote tumorigenesis and resistance to therapy due to its pro-survival role under stress conditions.16 In the last years, knowledge about the functional regulation of autophagy has greatly increased. Unfortunately, investigation of autophagy in mammalian tissue apt to deliver additional information about the role of autophagy and its deregulation in diseases, is still hampered by lack of suitable and standardized methodology.8 A seminal study on the immunohistochemical analysis of autophagy in murine tissue of a conditional Atg7 knock-out mouse model by Martinet et al. concluded that LC3 expression is too low for reliable detection and that p62 also accumulated in autophagy-deficient liver tissue.17 Detection of autophagosomes by electron microscopy is still regarded as the gold standard to detect autophagy in tissue. Yet, this method is time and cost consuming and restricted to the application on non-formalin fixed and paraffin embedded (non-FFPE) tissue for best results.17,18 In contrast, most pathology archives - where human tissue would be available for disease specific studies - offer only FFPE tissue. Since immunohistochemistry (IHC) can be easily applied on FFPE tissue, a robust and reliable immunostaining technique for measuring autophagy would be a valuable tool for the investigation of this highly important cellular mechanism. Thus, we were aiming at establishing a reliable method for detecting autophagy markers in human tissue sections, particularly in tissue microarrays. Although several antibodies against these proteins are available, which are now widely used for analysing human tissue, there is still ample discussion about the reliability of the immunoreactions, the specificity of the antibodies, and finally the correct interpretation of the staining results. Therefore, the aim of this work was to develop a robust and specific IHC staining protocol for the detection of LC3B and p62 in human FFPE tissue with special emphasis on its specificity for autophagy and the interpretation and the possibility of categorization of the staining results.
Materials and Methods
Patient tissue samples: Cell lines, culture and treatment conditions
The human non-small cell lung cancer cell line H1299 was directly obtained from Leibniz-Institute DSMZ-German collection of Microorganisms and Cell Cultures and cultured in RPMI-1640 (Sigma-Aldrich, Buchs, Switzerland) supplemented with 10% FBS (Sigma-Aldrich, product number: F7524, Lot number: 012M3396) and antibiotics. For starvation experiments cells were seeded and the next day washed with PBS before the addition of EBSS (#E2888, Sigma-Aldrich). Cells were starved for 6 h and Bafilomycin A1 (BML-CM110, Enzo-Life Sciences, Lausen, Switzerland) was added for the last two hours at a final concentration of 200 nM.
Generation of knockdown cell lines
H1299 cells were transduced with several lentiviral vectors (pLKO.1) each of them expressing a small hairpin (sh)RNA targeting the LC3B or p62 mRNA (LC3B: NM_022818.2-247s1c1NM and 022818.2-292s1c1; p62: NM_003900.2-967s1c1, NM_003900.2-788s1c1, Sigma-Aldrich) at different regions. Lentivirus production was performed as described previously.19 We used the SHC002 control lentiviral vector (Sigma-Aldrich) as a non-targeting control. Two days after transduction, cells were selected with 1.5 g/mL puromycin (Sigma-Aldrich) for 2 days before lowering puromycin concentration to 0.5 g/mL for another 5 days.
Primary antibodies
Anti-LC3B antibodies were purchased from Cell Signaling (rabbit monoclonal, clone D11, #3686, Lausen, Switzerland) and Novus Biologicals (rabbit polyclonal, #NB600-1384, LuBioScience, Luzern, Switzerland). The p62/SQSTM1 antibodies were obtained from Sigma (mouse monoclonal, clone 2C11, #WH0008878M1, Leiden, The Netherlands) and MBL (rabbit polyclonal, #PM0045, LabForce, Nunningen, Switzerland). Anti-GAPDH was purchased from Millipore (MAB374; Millipore, Zug, Switzerland).
Western blotting
Cells were washed in PBS before lysis in urea buffer (8 M urea, 0.5% tritonX) containing protease inhibitor (complete midi, Roche Diagnostics, Rotkreuz, Switzerland). After sonication samples were centrifuged at 14,000 rcf and the supernatant was transferred to a new tube. Protein concentration was determined using the Bradford protein assay (BioRad, Cressier, Switzerland). Thirty µg of total protein were denatured in Laemmle buffer at 95°C for 5 min (BioRad), loaded on a 4-20% pre-cast gel (BioRad) and transferred onto a PVDF membrane using the Trans-Blot® Turbo™ Transfer system (BioRad). For p62, GAPDH and LC3B membranes were blocked during 1 h at room temperature (RT) using 5% milk, before incubation with the respective antibody. p62 and LC3B were diluted 1:1000 whereas GAPDH was diluted 1:5000. Membranes were incubated o/n at 4°C. Secondary antibodies were DyLight®650 conjugated goat anti-rabbit or DyLight®550 conjugated goat anti-mouse (LabForce, Muttenz, Switzerland). Secondary antibodies were diluted 1:1000 in 5% milk and incubated 3 h at RT. Data was acquired using the ChemiDoc™ MP system (BioRad).
Immunofluorescence
Cells were seeded onto cover-slides the day before starting experiments. After treatment as described above, cells were washed in PBS, prefixed in 4% paraformaldehyde for 15 seconds, fixed and permeabilized in ice-cold 100% methanol for 10 min at -20°C. Slides were air dried and washed with PBS before incubation for 1 h at RT with the primary antibodies (anti-LC3B/Cell Signaling 1:200 and anti-p62/Sigma 1:200 in PBS/1%BSA/0.1% Tween). Slides were washed twice with PBS 0.1% Tween and once with PBS and incubated for 1 h at RT with the respective secondary antibodies which were either FITC conjugated anti-rabbit and Cy3-conjugated anti-mouse (#115-166-003, Jackson Immunore search, Suffolk, UK). Secondary antibodies were diluted 1:130 in PBS/1% BSA/0.1% Tween. Images were taken on a confocal microscope Olympus FluoView1000 at 63x objective magnification. The number of LC3B and p62 positive dots was quantified using ImageJ software (1.64r; NIH, Bethesda, MD, USA). To count the dots a modified version of the plugin was used as already described.20
Embedding of cells for immunohistochemical staining
Cells were washed in PBS and pelleted by centrifugation. Three-four drops of plasma (Blood Transfusion Service, Bern, Switzerland) were added to the cells and coagulation was initiated by addition of 1-2 drops of thrombin (Diagnotec, Liestal, Switzerland). After incubation for 2 min the pellet was transferred into an embedding cassette. Samples were fixed in 4% paraformaldehyde overnight at RT before they were embedded in paraffin in the routine pathology laboratory.
Tissue microarray
Selected FFPE tissue of 20 non-small cell lung carcinomas and 20 gastric adenocarcinomas including corresponding non-neoplastic tissue was retrieved from the archive of the Institute of Pathology, University of Bern. Cases were randomly chosen according to abundant tissue availability. A tissue microarray (TMA) was constructed as previously described.21 Two punches were transferred to the TMA acceptor block from each pellet (0.6 mm punches) or tissue (1 mm punches), respectively.
Immunohistochemical staining
The TMA was sectioned at 4 µm. After deparaffination, rehydration, and antigen retrieval, immunohistochemical staining was performed using an automated immunostainer (Bond RX, Leica Biosystems, Heerbrugg, Switzerland) as follows: LC3B/Cell Signaling dilution 1:6000 for cell pellets and 1:3000 for tissue, tris buffer 95°C for 30 min, LC3/Novus dilution 1:6000 for cell pellets and 1:3000 for tissue, tris buffer 95°C for 30 min, p62/SQSTM1/MBL dilution 1:12000 for cell pellets and 1:8000 for tissue, citrate buffer 100°C for 30 min and p62/SQSTM1/Sigma dilution 1:40000 for both cell pellets and tissue, tris buffer 95°C for 30 min. Visualization was performed using the Bond Polymer Refine Detection kit (Leica Biosystems) as instructed by the manufacturer.
Statistical analysis
The SPSS 21 software (SPSS Inc, Chicago, IL, USA) was used for descriptive and comparative statistical analysis. Associations between staining patterns were evaluated using simple cross tabs (χ²-test and Fisher’s exact test). Interobserver agreement was determined by using kappa values. The significance level was set at 0.05.
Results
Specific LC3B and p62 staining in FFPE cell pellets
Several LC3 antibodies show cross-reactivity between LC3A or B isoforms, and we decided to use a highly specific LC3B antibody (Anti-LC3B, rabbit monoclonal, clone D11) and a cross-reactive LC3A/B antibody (rabbit polyclonal, #NB600-1384) for comparison.17,22 In order to test the specificity of the LC3B antibodies, H1299 lung cancer cells were transduced with lentiviral plasmids encoding shRNAs to target LC3B mRNA. Control and H1299 LC3B knockdown (shLC3B) cells were subjected to starvation and Bafilomycin A1 was added to assess autophagic flux.8 Knockdown efficiency and autophagy induction were determined by western blot analysis (Figure 1A). LC3B-II levels markedly increased in control cells upon starvation and were further enhanced after addition of Bafilomycin A1, indicating activated autophagic flux in the control cells (Figure 1A, left panel). In comparison, LC3B levels were significantly decreased in H1299 LC3B knockdown cells (Figure 1A, right panel). In line with the LC3B western blot data we found a significant increase in the number of LC3B positive dots under starvation as assessed by immunofluorescence microscopy. The number of LC3B dots further increased when blocking lysosome acidification with Bafilomycin A1, suggesting enhanced autophagic flux (Figure 1 B,C). H1299 LC3B depleted cells (Figure 1C, lower panel) displayed significantly fewer dots under control as well as starvation conditions. In agreement with the results of the immunofluorescence and western blot analysis, IHC staining of FFPE control cells showed a weak cytoplasmic but also a distinct and differentiated punctuated staining with starved cells displaying an increased number of LC3B positive dots with both antibodies used. LC3B depleted cells showed only a very weak staining with slightly stronger staining when using the cross-reactive LC3 antibody, reinforcing the specificity of the antibody on FFPE tissue (Figure 1C, right panel).
Figure 1.
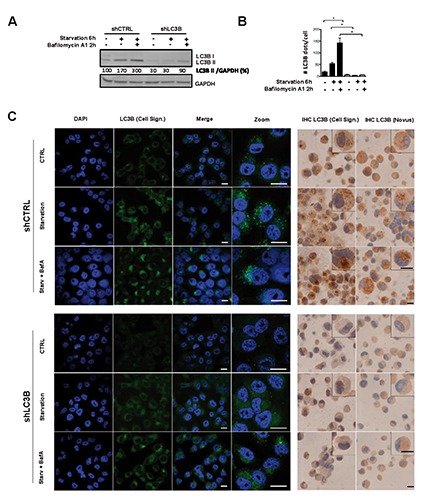
Validation of immunohistochemical staining for LC3B. Autophagy was induced by starvation in EBSS media, and autophagic flux blocked using the late autophagy inhibitor Bafilomycin A1. A) LC3B Western blot analysis of H1299 LC3B knockdown (shLC3B) and control (shCTRL) cells upon starvation and autophagy inhibition; GAPDH protein expression is shown as a loading control; band quantification was done using ImageJ software. B) Quantification of LC3B positive dots from immunofluorescent staining as depicted in C; quantification was performed using ImageJ software; the non-parametric Mann-Whitney-U was used to compare different groups: *p<0.05. C) Immunofluorescent staining (left panel) and immunohistochemistry (right panel) of LC3B in H1299 control and LC3B depleted cells treated as described above; for immunofluorescence analysis the LC3B/Cell Signaling antibody was used, and nuclei were counterstained using DAPI; for immunohistochemical staining two different LC3B antibodies (Cell Signaling and Novus) were applied. Scale bars: 20 µm.
p62 knockdown efficiency was lower than for LC3B as appreciated by western blot analysis, immunocyto- and immunohistochemistry (Figure 2 A,B). In agreement with the notion that p62 is degraded via autophagy, total p62 levels slightly decreased under starvation and increased over basal levels when flux was blocked with Bafilomycin A1 (Figure 2A). In line with these results, immunofluorescence showed an increase of p62 positive aggregates in starved cells treated with Bafilomycin A1 (Figure 2B and C, left panel). Accumulation of p62 under Bafilomycin A1 treatment was also found in p62 knockdown cells, but to a lesser extent as shown by quantification of p62 dots (Figure 2B) and western blot analysis (Figure 2A). As with LC3B knockdown cells, H1299 p62 depleted cells were fixed and embedded in paraffin and stained for p62 using IHC. IHC staining applying two different p62 antibodies clearly showed an increase in p62 dot formation only in SHC002 control cells upon starvation and Bafilomycin A1 treatment and not in H1299 p62 knockdown cells (Figure 2C, right panel).
Figure 2.
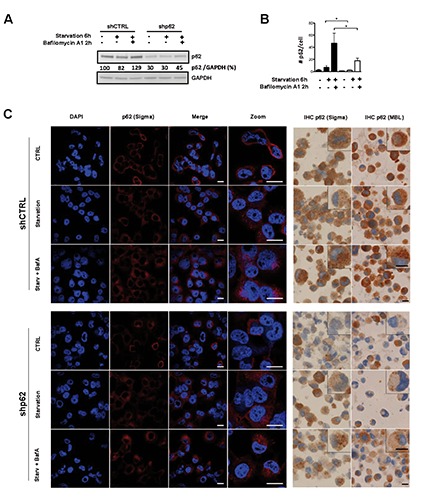
Validation of immunohistochemical staining for p62. Autophagy was induced by starvation in EBSS media, and autophagic flux blocked using the late autophagy inhibitor Bafilomycin A1. A) p62 western blot analysis of H1299 p62 knockdown (shp62) compared to control (shCTRL) cells; GAPDH is shown as a loading control; band quantification was done using ImageJ software. B) Quantification of p62 positive dots from immunofluorescent staining; quantification was performed as described in materials and methods; the non-parametric Mann-Whitney-U was used to compare different groups: *P<0.05. C) Immunofluorescent staining (left panel) and immunohistochemistry (right panel) of p62 in H1299 control and p62 depleted cells treated as described above; for immunofluorescence analysis the p62/Sigma antibody was used, and nuclei were counterstained using DAPI; two different p62 antibodies (Sigma and MBL) were used for immunohistochemical staining. Scale bars: 20 µm.
Application of LC3B and p62 staining on FFPE tissue
We applied our findings from FFPE cancer cell pellets to FFPE human tissue. Strong and partly dot-like LC3B staining was observed in peripheral nerves, perivascular smooth muscle cells and macrophages (Figure 3 A-C, G-I). Gastric zymogen granules stained faintly positive for LC3B/Cell Signaling and p62/MBL (Figure 3E). Nuclear p62 staining was present in the foveolar mucous neck cells, and extended towards the surface, particularly in samples hosting inflammation (Figure 3 D-F). In lung, type II pneumocytes stained strongly for p62 (Figure 3C). Unequivocal LC3B staining was not present. All 5 cases of captured bronchial epithelium showed weak cytoplasmic staining and dot-like staining for LC3B and p62 in 5 to 50% of cells (Figure 3 B-C). In both lung and gastric carcinomas, we found varying dot-like staining ranging from absent or only very few dots to abundant, partly aggregate like dots in most of the cells (Figure 3 J-M). Faint background cytoplasmic staining was observed in 15 cases (25%) for LC3B, which was negligible for further analysis. In contrast, p62 showed cytoplasmic staining in all cases at various degrees and nuclear staining in half of the cases. Unambiguous evaluation of p62 dot-like staining was hindered in some cases by additional strong cytoplasmic staining.
Figure 3.
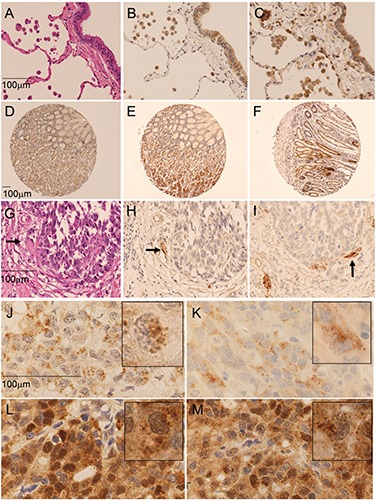
Staining of LC3B and p62 in neoplastic and non-neoplastic lung and gastric tissue. A-C) Non-neoplastic lung tissue: hematoxylin and eosin stain (A); cytoplasmic and dot-like staining of macrophages and bronchial epithelium for LC3B/Cell signaling (B) and p62/Sigma (40x) (C). D-F) Non-neoplastic gastric tissue: nuclear staining of p62/Sigma in the foveolar mucous neck region (D) and accentuated in inflamed tissue (F). E) additional staining of zymogen granula by p62/MBL (10x). G-I) LC3B positivity of nerve tissue (arrow), adjacent to a negative gastric cancer infiltrate: hematoxylin and eosin (G); LC3B/Cell Signaling (H); LC3B/Novus (40x) (I). Dot like staining of lung carcinoma for LC3B/Cell Signaling (J), LC3B/Novus (K), p62/MBL (L) and p62/Sigma (100x) (M). Inserts show magnification of positive cells (score 3 according to Table 1). Images were taken on a Zeiss Axioskop microscope and corrected for brightness. Objective magnifications are reported. Scale bars: 100 µm.
According to our observations we divided the dot like staining patterns into an intensity score from 0-3 for quantitative evaluation as follows: score 0, no dots or barely visible dots in <5% of the cells; score 1, detectable dots in 5-25% of cells; score 2, readily detectable dots in 25-75% of cells; score 3, dots in >75% of cells. Diffuse cytoplasmic staining was assessed as absent or presenting only faint background staining (score 0), weak (score 1) or strong (score 2). Nuclear staining was reported as present (>10% of nuclei) or absent. The immunohistochemical stainings were independently scored by two pathologists (SB and RL) on a Zeiss Axioskop microscope at 40x objective magnification. Interobserver agreement for the evaluation of dot like LC3B staining had a kappa value of 0.74 using the Cell signaling antibody (substantial agreement), and 0.60 for the Novus antibody (moderate to substantial agreement). For the p62/Sigma antibody the kappa values were as follows: dot like staining 0.65 (substantial agreement); cytoplasmic staining 0.83 (excellent) and nuclear 0.75 (substantial). The kappa values for the MBL antibody were only fair to moderate (0.3, 0.42 and 0.56, respectively). We selected the antibodies with the better interobserver agreements for further studies, presuming staining results to have a greater potential for unambiguous and reproducible evaluation. In a second round, discrepancies were discussed on a multihead microscope and final scores were determined. Using this approach for LC3B (Cell Signaling) dot-like staining, 22 cases (37.3%) were classified as score 0, 8 cases (13.6%) as score 1 and 5 cases each (8.5%) as score 2 and 3. The results for p62 (Sigma) were as follows: score 0, 12 cases (20.3%); score 1, 8 cases (13.6%); score 2, 4 cases (6.8%) and score 3 (including also the cases with strong cytoplasmic staining), 16 cases (27.1%) (Table 1). Eleven cases were both LC3B and p62 negative, and 17 cases had detectable dots for both LC3B and p62 (Fisher s exact test = 0.004; Table 2). There was no association between p62 nuclear and dot-like/cytoplasmic staining, and no significant difference between gastric and lung cancers with regard to the distribution of staining patterns.
Table 1.
Correlation between LC3B and p62 (χ2=0.057).
| LC3B | Total | |||||
|---|---|---|---|---|---|---|
| Score 0 | Score 1 | Score 2 | Score 3 | |||
| p62 | Score 0 | 11 | 1 | 0 | 0 | 12 |
| Score 1 | 3 | 3 | 1 | 1 | 8 | |
| Score 2 | 1 | 1 | 0 | 2 | 4 | |
| Score 3* | 1 | 3 | 4 | 2 | 16 | |
| Total | 11 | 8 | 5 | 5 | 40 | |
*Including strong cytoplasmic staining.
Table 2.
Correlation of the presence of dots with LC3B and p62 staining (Fisher’s exact test = 0.004).
| LC3B dots | Total | |||
|---|---|---|---|---|
| Absent (score 0) | Present (score 1-3) | |||
| P62 dots | Absent (score 0) | 11 | 1 | 12 |
| Present (score 1-3*) | 11 | 17 | 28 | |
| Total | 22 | 18 | 40 | |
*Including strong cytoplasmic staining.
Discussion
The application of LC3B and p62 IHC for monitoring autophagy has generally been regarded to represent a possible tool for studying autophagy.18,23,24 However, the appropriate usage of IHC on tissue has been a topic of discussion in recent papers, especially in view of numerous studies, which had been using this technique without caution.24-26 Consistent with our observations on cell lines, where autophagy was experimentally induced, Martinet et al.17 pointed out that granular cytoplasmic staining without detectable puncta or dots may not truly reflect autophagy. They also discuss the limitation of IHC for the usage of monitoring autophagy at basal or low levels,17 reflected in our study by generally lower quantities of dots in tissue compared to starved and Bafilomycin A1 treated cells. In line with our results, others have reported LC3B and partly also p62 positive dot like staining in tissue samples featuring chloroquine induced myopathic muscle fibers,27,28 hepatic steatosis29 or various cancer types.30 In the latter paper, a detailed protocol for IHC is provided that is comparable to our approach. Similarly, Holt et al.31 present another protocol for LC3B IHC, but both groups describe an in-house approach, which may not be feasible in other laboratories. Our aim was to design a valid staining protocol and scoring system with special emphasis on reproducibility and applicability on scoring large tumor collectives of FFPE tissue. For that reason we took advantage of an automatic immunostainer routinely used in pathology laboratories and opted to set specific thresholds for evaluation of dot-like staining to assure reproducibility and feasibility evaluating large tissue collectives.
We observed similar patterns for both autophagy markers, LC3B and p62, as recently described in oral squamous cell carcinomas.32 Yet, it is highly important that distinct LC3B and p62 staining can also be observed in normal nerves and macrophages, which can serve as internal positive controls, but also seriously confound staining results. Careful histopathologic examination is therefore mandatory to elude misinterpretation. The observed strong diffuse cytoplasmic staining for p62 might hamper evaluation of fine cytoplasmic dots. The significance of diffuse cytoplasmic and nuclear p62 staining for assessment of autophagy is not clear. While others interpret both staining patterns as surrogates for autophagy,32 we prefer to restrict autophagy assessment to dot-like staining patterns, analogous to LC3B, based on our preceding cell line experiments. Another critical issue is the interpretation of the biological significance of LC3B and p62 positive dots. Dot like staining patterns do not necessarily indicate high levels of active, ongoing autophagy. Autophagosomes, visualized as dots, may accumulate due to induction of autophagy itself, or due to inhibition of autophagy and the resulting lack of autophagosome degradation upon fusion with lysosomes.31 Thus, autophagosome accumulation due to a defective autophagy pathway may account for some positive cases and would warrant the application of additional markers in order to achieve a more comprehensive dataset of the expression of autophagy related biomarkers. In fact, although there was a positive correlation between LC3B and p62 staining, some cases showed single positivity for LC3B or p62. LC3B can be incorporated into protein aggregates independently of functional autophagy under certain stress stimuli.8 Thus, some LC3B positive structures might not reflect autophagosomes. Accordingly, although p62 is a well-known autophagy cargo, the levels of p62 are controlled transcriptionally by various non-autophagic stimuli that may lead to a misinterpretation of autophagic flux.3 On the other hand, our functional autophagy experiments in cancer cells strongly support the relation between autophagy and dot like staining of the two markers. Specificity of antibodies should always be taken into account. IHC staining patterns using two commercially available LC3B antibodies were highly comparable in our cell lines. Of note though, LC3B antibody from Cell Signaling is specific for LC3B,17 whereas the antibody purchased from Novus Biologicals cross-reacts with LC3A.22
At present, data about the expression of other human ATG8 homologues, i.e., GATE16/GABARAP in human tissue are scarce. Only one study has addressed the expression of GABARAP in colon cancer.33 Data from the human protein atlas (http://www.proteinatlas.org/)34 show expression of GABARAP1 and GAPARAP2/GATE16 in samples of neoplastic and non-neoplastic human tissue in various levels. Descriptive or comparative studies about these proteins on larger case collections, however, are lacking. Therefore, despite all caveats and problematic issues, staining for LC3B and p62 may be the best way to assess differences in the autophagy pathway in large human tissue collectives, where electron microscopy is not feasible, as long as we lack other more precise markers to monitor autophagic flux in tissue. Combining functional cell line experiments and IHC on tissue will provide further insights into the deregulation of autophagy in pathological conditions.
In summary, we developed a specific and reliable LC3B and p62 IHC staining protocol for human FFPE tissue, which can be applied on an automatic staining system widely available in pathology laboratories. Preceding functional cell line experiments with LC3B and p62 knockdown and subsequent induction of autophagy followed by Western blot, immunofluorescence and immunohistochemistry analyses of the cell pellets indicate that only dot-like staining patterns should be regarded as autophagy-related. The specificity of the antibodies for LC3B and p62 was tested by Western blot as a prerequisite for a reliable immunohistochemical staining protocol.35 The reproducibility of the staining and the proposed evaluation system were confirmed by a high degree of interobserver accordance between two pathologists. Application of IHC staining was performed on a tissue microarray with human malignant and non-neoplastic lung and stomach tissue samples. Distinct dot like staining patterns for LC3B and p62 were observed within the tumors in various degrees, but in general in higher levels compared to the corresponding non-neoplastic tissue. Applying LC3B and p62 IHC on single tissue samples and tissue collections may be a valuable tool for determining the impact of autophagy on human diseases where tissue based analyses are demanded.
Acknowledgments
The authors thank Deborah Shan for her excellent technical assistance. The authors acknowledge the Translational Research Unit of the Institute of Pathology for excellent technical support on this project. This study was supported by grants from the Stiftung für Klinisch-Experimentelle Tumorforschung Bern to MPT, the Bernese Cancer League to SB and the Swiss Cancer League to RL.
References
- 1.Gozuacik D, Kimchi A. Autophagy and cell death. Curr Top Dev Biol 2007;78:217-45. [DOI] [PubMed] [Google Scholar]
- 2.Galluzzi L, Morselli E, Vicencio JM, Kepp O, Joza N, Tajeddine N, et al. Life, death and burial: multifaceted impact of autophagy. Biochem Soc Trans 2008;36(Pt 5):786-90. [DOI] [PubMed] [Google Scholar]
- 3.Mizushima N, Levine B, Cuervo AM, Klionsky DJ. Autophagy fights disease through cellular self-digestion. Nature 2008;451:1069-75. [DOI] [PMC free article] [PubMed] [Google Scholar]
- 4.Scarlatti F, Granata R, Meijer AJ, Codogno P. Does autophagy have a license to kill mammalian cells? Cell Death Differ 2009;16:12-20. [DOI] [PubMed] [Google Scholar]
- 5.Gozuacik D, Kimchi A. Autophagy as a cell death and tumor suppressor mechanism. Oncogene 2004;23:2891-906. [DOI] [PubMed] [Google Scholar]
- 6.Shpilka T, Mizushima N, Elazar Z. Ubiquitin-like proteins and autophagy at a glance. J Cell Sci 2012;125(Pt 10):2343-8. [DOI] [PubMed] [Google Scholar]
- 7.Shpilka T, Weidberg H, Pietrokovski S, Elazar Z. Atg8: an autophagy-related ubiquitin-like protein family. Genome Biol 2011;12:226. [DOI] [PMC free article] [PubMed] [Google Scholar]
- 8.Klionsky DJ, Abdalla FC, Abeliovich H, Abraham RT, Acevedo-Arozena A, Adeli K, et al. Guidelines for the use and interpretation of assays for monitoring autophagy. Autophagy 2012;8:445-544. [DOI] [PMC free article] [PubMed] [Google Scholar]
- 9.Kabeya Y, Mizushima N, Ueno T, Yamamoto A, Kirisako T, Noda T, et al. LC3, a mammalian homologue of yeast Apg8p, is localized in autophagosome membranes after processing. EMBO J 2000;19:5720-8. [DOI] [PMC free article] [PubMed] [Google Scholar]
- 10.Mijaljica D, Nazarko TY, Brumell JH, Huang WP, Komatsu M, Prescott M, et al. Receptor protein complexes are in control of autophagy. Autophagy 2012;8:1701-5. [DOI] [PMC free article] [PubMed] [Google Scholar]
- 11.Komatsu M, Ichimura Y. Physiological significance of selective degradation of p62 by autophagy. FEBS Lett 2010;584:1374-8. [DOI] [PubMed] [Google Scholar]
- 12.Choi AM, Ryter SW, Levine B. Autophagy in human health and disease. N Engl J Mede 2013;368:651-62. [DOI] [PubMed] [Google Scholar]
- 13.Hara T, Nakamura K, Matsui M, Yamamoto A, Nakahara Y, Suzuki-Migishima R, et al. Suppression of basal autophagy in neural cells causes neurodegenerative disease in mice. Nature 2006;441:885-9. [DOI] [PubMed] [Google Scholar]
- 14.Komatsu M, Waguri S, Chiba T, Murata S, Iwata J, Tanida I, et al. Loss of autophagy in the central nervous system causes neurodegeneration in mice. Nature 2006; 441:880-4. [DOI] [PubMed] [Google Scholar]
- 15.Chen HY, White E. Role of autophagy in cancer prevention. Cancer Prev Res (Phila) 2011;4:973-83. [DOI] [PMC free article] [PubMed] [Google Scholar]
- 16.Mathew R, White E. Autophagy, stress, and cancer metabolism: what doesn’t kill you makes you stronger. Cold Spring Harb Symp Quant Biol 2011;76:389-96. [DOI] [PubMed] [Google Scholar]
- 17.Martinet W, Schrijvers DM, Timmermans JP, Bult H, De Meyer GR. Immunohistochemical analysis of macroautophagy: recommendations and limitations. Autophagy 2013;9:386-402. [DOI] [PMC free article] [PubMed] [Google Scholar]
- 18.Barth S, Glick D, Macleod KF. Autophagy: assays and artifacts. J Pathol 2010; 221:117-24. [DOI] [PMC free article] [PubMed] [Google Scholar]
- 19.Tschan MP, Vonlanthen S, Cajot JF, Peters UR, Oppliger E, Betticher DC, et al. Different p16INK4a and p14ARF expression patterns in acute myeloid leukaemia and normal blood leukocytes. Leuk Lymphoma 2001;42:1077-87. [DOI] [PubMed] [Google Scholar]
- 20.Dagda RK, Zhu J, Kulich SM, Chu CT. Mitochondrially localized ERK2 regulates mitophagy and autophagic cell stress: implications for Parkinson’s disease. Autophagy 2008;4:770-82. [DOI] [PMC free article] [PubMed] [Google Scholar]
- 21.Zlobec I, Koelzer VH, Dawson H, Perren A, Lugli A. Next-generation tissue microarray (ngTMA) increases the quality of biomarker studies: an example using CD3, CD8, and CD45RO in the tumor microenvironment of six different solid tumor types. J Transl Med 2013;11:104. [DOI] [PMC free article] [PubMed] [Google Scholar]
- 22.Zois CE, Giatromanolaki A, Sivridis E, Papaiakovou M, Kainulainen H, Koukourakis MI. “Autophagic flux” in normal mouse tissues: focus on endogenous LC3A processing. Autophagy 2011;7:1371-8. [DOI] [PubMed] [Google Scholar]
- 23.Tanida I, Waguri S. Measurement of autophagy in cells and tissues. Methods Mol Biol 2010;648:193-214. [DOI] [PubMed] [Google Scholar]
- 24.He Y, Zhao X, Subahan NR, Fan L, Gao J, Chen H. The prognostic value of autophagy-related markers beclin-1 and microtubule-associated protein light chain 3B in cancers: a systematic review and meta-analysis. Tumour Biol 2014;35:7317-26. [DOI] [PubMed] [Google Scholar]
- 25.Choi J, Jung W, Koo JS. Expression of autophagy-related markers beclin-1, light chain 3A, light chain 3B and p62 according to the molecular subtype of breast cancer. Histopathology 2013;62:275-86. [DOI] [PubMed] [Google Scholar]
- 26.Giatromanolaki A, Sivridis E, Mendrinos S, Koutsopoulos AV, Koukourakis MI. Autophagy proteins in prostate cancer: relation with anaerobic metabolism and Gleason score. Urol Oncol 2014;32:39e11-8. [DOI] [PubMed] [Google Scholar]
- 27.Daniels BH, McComb RD, Mobley BC, Gultekin SH, Lee HS, Margeta M. LC3 and p62 as diagnostic markers of drug-induced autophagic vacuolar cardiomyopathy: a study of 3 cases. Am J Surg Pathol 2013;37:1014-21. [DOI] [PubMed] [Google Scholar]
- 28.Lee HS, Daniels BH, Salas E, Bollen AW, Debnath J, Margeta M. Clinical utility of LC3 and p62 immunohistochemistry in diagnosis of drug-induced autophagic vacuolar myopathies: a case-control study. PloS ONE 2012;7:e36221. [DOI] [PMC free article] [PubMed] [Google Scholar]
- 29.Kashima J, Shintani-Ishida K, Nakajima M, Maeda H, Unuma K, Uchiyama Y, et al. Immunohistochemical study of the autophagy marker microtubule-associated protein 1 light chain 3 in normal and steatotic human livers. Hepatol Res 2014;44:779-87. [DOI] [PubMed] [Google Scholar]
- 30.Ladoire S, Chaba K, Martins I, Sukkurwala AQ, Adjemian S, Michaud M, et al. Immunohistochemical detection of cytoplasmic LC3 puncta in human cancer specimens. Autophagy 2012;8:1175-84. [DOI] [PMC free article] [PubMed] [Google Scholar]
- 31.Holt SV, Wyspianska B, Randall KJ, James D, Foster JR, Wilkinson RW. The development of an immunohistochemical method to detect the autophagy-associated protein LC3-II in human tumor xenografts. Toxicol Pathol 2011;39:516-23. [DOI] [PubMed] [Google Scholar]
- 32.Liu JL, Chen FF, Lung J, Lo CH, Lee FH, Lu YC, et al. Prognostic significance of p62/SQSTM1 subcellular localization and LC3B in oral squamous cell carcinoma. Br J Cancer 2014. 26;111:944-54. [DOI] [PMC free article] [PubMed] [Google Scholar]
- 33.Miao Y, Zhang Y, Chen Y, Chen L, Wang F. GABARAP is overexpressed in colorectal carcinoma and correlates with shortened patient survival. Hepatogastroenterology 2010;57:257-61. [PubMed] [Google Scholar]
- 34.Uhlén M, Fagerberg L, Hallström BM, Lindskog C, Oksvold P, Mardinoglu A, et al. Tissue-based map of the human proteome. Science 2015;347:1260419. [DOI] [PubMed] [Google Scholar]
- 35.Schuster C, Malinowsky K, Liebmann S, Berg D, Wolff C, Tran K, et al. Antibody validation by combining immunohistochemistry and protein extraction from formalin-fixed paraffin-embedded tissues. Histopathology 2012;60:E37-50. [DOI] [PubMed] [Google Scholar]