Abstract
Ozone therapy is a modestly invasive procedure based on the regeneration capabilities of low ozone concentrations and used in medicine as an alternative/adjuvant treatment for different diseases. However, the cellular mechanisms accounting for the positive effects of mild ozonization are still largely unexplored. To this aim, in the present study the effects of low ozone concentrations (1 to 20 µg O3/mL O2) on structural and functional cell features have been investigated in vitro by using morphological, morphometrical, cytochemical and immunocytochemical techniques at bright field, fluorescence and transmission electron microscopy. Cells exposed to pure O2 or air served as controls. The results demonstrated that the effects of ozone administration are dependent on gas concentration, and the cytoskeletal organization, mitochondrial activity and nuclear transcription may be differently affected. This suggests that, to ensure effective and permanent metabolic cell activation, ozone treatments should take into account the cytological and cytokinetic features of the different tissues.
Key words: Ozone, in vitro culture, epithelial cells, cell nucleus, cytoskeleton, mitochondria, heat shock proteins
Introduction
Ozone therapy is a modestly invasive procedure based on the regeneration capabilities of low ozone concentrations and used in medicine as an alternative/adjuvant treatment for different diseases, among which arthritis, heart and vascular diseases, asthma, emphysema, multiple sclerosis (reviews in1-3). Ozone treatment has also been proposed to improve metabolic activities in elderly.4-6
Despite ozone has been applied for therapy since the end of the 18th century, the cellular mechanisms accounting for the positive effects of ozone treatment, especially at low concentrations, are still largely unexplored (for a scientific overview of ozone therapy, see7). Molecular evidence shed light on some biological mechanisms responsible for the dose-dependent effects of ozone treatment: high dosages stimulate severe oxidative stress (via activation of nuclear transcriptional factor kappa B, resulting in inflammatory response and tissue injury); on the contrary, low ozone concentrations induce a moderate oxidative stress which activates the nuclear factor erythroid 2-related factor 2 as well as several antioxidant enzymes (e.g., superoxide dismutases, glutathione peroxidase, glutathione transferases, catalase, heat shock proteins), thus protecting cells from oxidation and suppressing inflammatory responses (review in8). Although some biological effects of ozone administration in vivo are likely mediated by blood factors, a direct cellular influence cannot be excluded, especially when ozone is administered by injection in a tissue or by contact with an epithelium. However, knowledge of the effects of low ozone concentrations on cell dynamics and organelles’ structure and function is still lacking.
In order to identify the cellular mechanisms responsible for the regeneration capabilities of mild ozonization, in the present study the effects of low ozone concentrations on structural and functional cell features have been investigated by using morphological, morphometrical, cytochemical and immunocytochemical techniques at bright field, fluorescence and transmission electron microscopy. An in vitro cell system has been employed to allow analyses under controlled experimental conditions.
Materials and Methods
Cell culture and ozone treatment
HeLa cells (5×10⁴) were grown on 75 cm2 plastic flasks (Corning Inc., Corning, NY, USA) in DMEM (Dulbecco Modified Eagles Medium) supplemented with 10% (v/v) fetal calf serum, 1% (w/v) glutamine, 100 U of penicillin and 100 g/mL streptomycin (Celbio, Milan, Italy), at 37°C in a 5% CO2 humidified atmosphere. When subconfluent, the cells were trypsinized (0.25% trypsin containing 0.05% ethylene diamino tetraacetic acid (EDTA) in phosphate-buffered saline, PBS) and exposed in suspension to O2-O3 gas mixtures with different O3 concentrations (1, 10 and 20 µg O3/mL O2) using an OZO2 FUTURA apparatus (Alnitec s.r.l., Cremosano, CR, Italy) which generates O3 from medical-grade O2, and allows photometric real-time control of gas flow rate and O3 concentration. The experimental procedure was set up according as previsously described:9 in detail, for each sample, 4×10⁵ cells were suspended in 1 mL medium into a 10 mL polypropylene (O3 resistant) syringe (Terumo Medical Corporation, Somerset, NJ, USA); an equal volume of gas was then collected in the syringe (thus having the final gas pressure corresponding to the atmospheric one) through a sterile filter (Alnitec s.r.l.) in order to avoid contamination. The sample was gently and continuously mixed with the gas mixture for 10 min: it has been ascertained that during this period of time cell samples react with the ozone dose totally.9 Cells exposed to pure O2 under the same experimental conditions were used to discriminate the effect of O3 while cells exposed to air (CTR) served as controls. After treatment, the cells were seeded in 6 or 12 multiwell plastic microplates (Corning) and analysed at increasing times after seeding in order to evaluate some fundamental features of cell morphology and function (see below) (for fluorescence microscopy, the cells were planted on glass coverslips placed on the wells’ bottom).
Cell viability and proliferation
To determine the effect of gas exposure on cell survival, 2×10⁴ cells/well were seeded on 12 multiwell plastic microplates. The fraction of dead cells was estimated after different times from the treatment after staining for 2 min with 0.1% Trypan blue in the culture medium. Using a Leica DM IL inverted microscope equipped with 20x objective lens, the cells were counted at increasing times in 15 randomly chosen microscope fields and the percentage of dead (Trypan blue-positive) cells was estimated. Data were expressed as the mean of three independent experiments ± standard error (SE).
To evaluate cell growth, 5×10⁴ cells/well were seeded on 6 multiwell plastic microplates and the total cell number was estimated after different times from the treatment. The cells were detached by mild trypsinization and counted in a Burker hemocytometer. Data were expressed as the mean of three independent experiments ± standard error (SE). In order to evaluate S-phase cells, 24 h and 48 h after treatment cells grown on coverslips were pulse-labeled with 20 µM Bromodeoxyuridine (BrdU, Sigma-Aldrich, St. Louis, MO, USA) for 30 min at 37°C, then fixed with 70% ethanol and incubated for 20 min at room temperature in 2 N HCl, to denature DNA partially; after neutralization with 0.1 M sodium tetraborate (pH 8.2) for 3 min, samples were washed in PBS, permeabilized for 15 min in PBS containing 0.1% bovine serum albumin and 0.05% Tween-20, and incubated for 1 h with a mouse monoclonal antibody recognizing BrdU (BD, Franklin Lakes, NJ, USA) diluted 1:20. After two washings with PBS, samples were incubated for 1 h with an Alexafluor 488-conjugated anti-mouse secondary antibody (Molecular Probes, Invitrogen, Milan, Italy), diluted 1:200. The cell samples were washed with PBS, stained for 10 min with 1 µg/mL Hoechst 33342 in PBS, and finally mounted in PBS:glycerol (1:1) to be observed and scored in fluorescence microscopy (see below). The percentage of apoptotic cells (identified by chromatin morphology) was also estimated in these samples. Data were expressed as the mean of three independent experiments ± standard error (SE).
Cell adhesion and flattening
To test the ability of HeLa cells to restore their typical morphology after the treatment in suspension, 2×10⁴ cells/well were seeded on 12-multiwell plastic microplates; using a Leica DM IL inverted microscope equipped with 40x objective lens, the adherent cells were counted at increasing times (30 min, 1 h, 2 h, 4 h, 6 h) in 15 randomly chosen microscope fields. The percentage of flattened cells was also calculated. Results were expressed as the mean ± SE of three independent experiments.
In order to visualise the cytoskeletal microfilament arrangement, 24 h after treatment and seeding on glass coverslips, some HeLa cells were fixed with 4% (v/v) formaldehyde (30 min at room temperature) and 70% (v/v) ethanol in water (30 min at -20°C), rehydrated with PBS, incubated with Alexa 594-conjugated phalloidin (Molecular Probes, Invitrogen) diluted 1:40 in PBS for 1 h at room temperature, stained for DNA with Hoechst 33342 (0.1 g/mL in PBS for 10 min), rinsed in PBS, counterstained with Trypan blue, washed in PBS and finally mounted in a 1:1 PBS:glycerol mixture.
In situ detection of Reactive Oxygen Species
The intracellular sites of the Reactive Oxygen Species (superoxide anion radical and possibly singlet oxygen; ROS) production were visualised by the cytochemical method based on a 3,3’-Diaminobenzidine (DAB)-Mn2+-Co2+ reaction.10 Briefly, 30 min and 5 h post-treatment HeLa cells were incubated for 30 min in a medium containing 12.5 mM DAB, 5 mM MnCl2 and 40 mM CoCl2 dissolved in 10% w/v polyvinyl alcohol, in 100 mM Tris-maleate buffer pH 8.0 at 37°C. The cells were then extensively rinsed in hot (60°C) distilled water and finally mounted in PBS:glycerol (1:1). As a positive control of the cytochemical reaction HeLa cells treated with 9.8 M H2O2 for 2 h at 37°C were treated as above. The samples were observed at differential interference contrast (DIC) using an Olympus BX51 microscope. Data were expressed as the mean of three independent experiments ± standard error (SE).
Mitochondrial membrane potential
The changes in the mitochondrial membrane potential were monitored using JC-1 (5,5V,6,6V-tetrachloro-1,1V,3,3V-tetraethylbenzimidazolcarbocyanine iodide) (Invitrogen, Carlsbad, CA, USA). When administered to living cells, JC-1 accumulates in the mitochondria where it emits either red or green fluorescence, depending on the mitochondrial membrane potential, the red signal indicating polarized mitochondria, and the green signal the depolarized ones;11 therefore, the shift from red to green fluorescence is considered a reliable indication of a drop in the mitochondrial membrane potential. HeLa cells were harvested by mild trypsinisation after 24 h post-treatment, and incubated in culture medium with 2 µM JC-1 for 20 min at 37°C in the dark.
Cells were washed in PBS at 37°C and measured on a 10 color, 3 laser (Blue Solid State Diode: 488 nm, 22 mW; Red Solid State Diode: 638 nm, 25 mW; Violet Solid State Diode: 405 nm, 40 mW), Navios flow cytometer (Beckman Coulter Inc., Brea, CA, USA). When exited at 488 nm, JC-1 monomers emit green fluorescence (FL1 channel) with a maximum at 530 nm, whereas JC-1 aggregates emit orange-red fluorescence (FL2 channel) with a maximum at 595 nm. In order to evaluate cellular autofluorescence and FL2/FL2 spectral fluorescence compensation we prepared three controls tube as follow: JC-1 unloaded cells in PBS (control for autofluorescence), JC-1 loaded cells treated with 70% ethanol in PBS (positive green and negative red fluorescence), JC-1 loaded, untreated cells in PBS (double positive red and green fluorescence). All acquired data files were analyzed using the Kaluza software, version 1.3 (Beckman Coulter). Cell doublets were excluded using side scatter peak (high) versus side scatter integral (area).
Immunofluorescence microscopy
For immunolabelling at fluorescence microscopy, the cells were treated for 15 min with PBS containing 0.1% bovine serum albumin and 0.05% Tween-20, and then incubated for 2 h at room temperature with the primary antibodies. After washing with PBS, samples were incubated for 1 h with Alexafluor 488-conjugated anti-mouse or Alexafluor 594-conjugated anti-rabbit or Alexafluor 594-conjugated anti-human secondary antibodies (Molecular Probes, Invitrogen), diluted 1:200. Cells were washed with PBS, stained for 5 min with Hoechst 33342 in PBS, and finally mounted in PBS:glycerol (1:1). Mouse monoclonal antibodies directed against Hsp70 (Abcam, Cambridge, UK) or mitochondrial Hsp70 (mtHsp70; Enzo Life Sciences, Farmingdale, NY, USA), and a human autoimmune serum recognizing the mitochondrial 70 kDa E2 sub-unit of the pyruvate dehydrogenase complex12 were used as primary antibodies. Dual immunolabellings were also performed.
An Olympus BX51 microscope equipped with a 100W mercury lamp (Olympus Italia S.r.l., Milan, Italy) was used under the following conditions: 450-480 nm excitation filter (excf), 500 nm dichroic mirror (dm), and 515 nm barrier filter (bf) for Alexa 488 and for JC-1; 540 nm excf, 580 nm dm, and 620 nm bf for Alexa 594; 330-385 nm excf, 400 nm dm, and 420 nm bf, for Hoechst 33342. Images were recorded with an Olympus Magnifire digital camera system (Olympus Italia S.r.l.).
Ultrastructural morphology and immunocytochemistry
Cells from three independent experiments were processed for transmission electron microscopy 24 h after treatment. For conventional morphology, cells were fixed with 2.5% (v/v) glutaraldehyde and 2% (v/v) paraformaldehyde in 0.1M Sörensen phosphate buffer, pH 7.4, at 4°C for 1 h, washed, post-fixed with 1% OsO4 at 4°C for 30 min, dehydrated with acetone and embedded in Epon. For immunoelectron microscopy, cells were fixed with 4% paraformaldehyde in 0.1 M Sörensen phosphate buffer at 4°C for 1 h, washed, treated with 0.5M NH4Cl in PBS, dehydrated with ethanol and embedded in LRWhite resin. In order to evaluate RNA transcription rate, some cells were pulse-labelled with 10 mM BrU (5-bromouridine, Sigma-Aldrich) for 10 min at 37°C, and then fixed and processed for immunoelectron microscopy as above. Ultrathin sections from Epon-embedded samples were conventionally stained with lead citrate and observed. A morphometrical analysis was carried out in fifty mitochondria (x28,000) per sample: mitochondrial area and the ratio between inner and outer membranes (estimating the extension of cristae independently of mitochondrial size) were considered. Ultrathin sections from LRWhite-embedded samples were processed for immunocytochemistry as follows: they were floated for 3 min on normal goat serum diluted 1:100 in PBS and then incubated for 17 h at 4°C with the primary antibody diluted in PBS containing 0.1% bovine serum albumin (Fluka, St. Louis, MO, USA) and 0.05% Tween 20. The following mouse monoclonal antibodies were used: anti-Hsp70 (Abcam), anti-mtHsp70 (Enzo Life Sciences) and anti-BrdU (BD; cross-reacting with BrU13, thus allowing to identify the BrU molecules incorporated in the newly transcribed RNAs). After rinsing, sections were floated on normal goat serum, and then reacted for 30 min at room temperature with the specific secondary 12 nm gold-conjugated antibody (Jackson Immuno Research Laboratories, West Grove, PA, USA) diluted 1:10 in PBS. The sections were finally rinsed, air-dried and weakly stained with uranyl acetate. Quantitative assessment of immunolabelling was carried out for all antibodies by estimating the gold grain density over selected compartments on sections treated in the same run. Cytoplasmic, mitochondrial, nucleoplasmic and nucleolar areas were measured on twenty randomly selected electron micrographs (x28,000) per compartment from each sample. For background evaluation, samples processed in the absence of the primary antibody were considered. The gold grains present over the selected areas were counted and the labelling density was expressed as number of gold grains/μm2.
All samples were observed in a Philips Morgagni transmission electron microscope (FEI Company Italia Srl, Milan, Italy) operating at 80kV and equipped with a Megaview II camera (FEI Company Italia Srl) for digital image acquisition.
Statistics
Results for each measured variable were pooled according to the experimental group and the mean±standard error of the mean (SE) value calculated. Statistical comparisons were performed by the one way-Anova test and post-hoc pairwaise comparisons.
Results
Cell viability and proliferation
The Trypan blue test demonstrated that dead cells were lower than 1.5% in all samples at the different post-treatment times considered (Figure 1a); although higher values were found for cells treated with 20 µg O3/mL, no significant difference was demonstrated. Accordingly, a similar pattern was found for the apoptotic cell percentage based on chromatin morphology after Hoechst 33342 staining (Figure 1b). The number of cells was similar in the samples from all the different treatments, after both 24 h and 48 h (Figure 2a). Accordingly, BrdU incorporation did not show significant difference among samples 24 h and 48 h after treatment (Figure 2 b,c).
Figure 1.
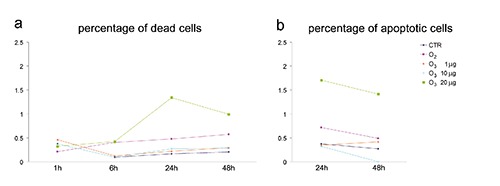
Effect of O3 exposure on cell death and apoptosis. a) Mean values of dead cell and b) apoptotic cell percentage. The values are not significantly different from each other, although 20 µg O3/mL-treated cells show higher percentages; SE values have been omitted to improve graph readability.
Figure 2.
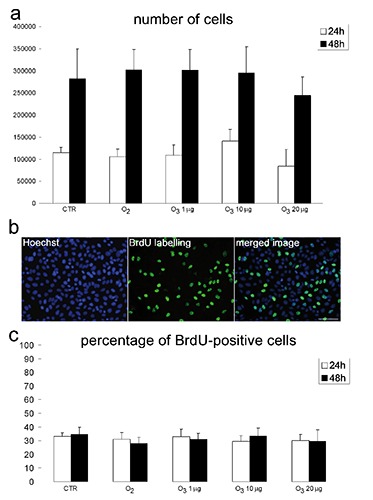
Effect of O3 exposure on cell proliferation. a) Mean values±SE of cell number 24 h and 48 h post-treatment; no significant difference has been found among experimental groups at the same time. b) Representative fluorescence micrographs of HeLa cells after BrdU incorporation; scale bar: 50 µm. c) Mean values±SE of BrdU-positive cell percentage 24 h and 48 h post-treatment; no significant difference has been found among experimental groups.
Cell adhesion and flattening
CTR cells and O2-treated samples showed similar values of adherent cells at all the post-treatment times considered. HeLa cells treated with 10 µg O3/mL showed significantly higher values, whereas significantly lower values were observed for cells treated with 20 µg O3/mL compared to the CTR and O2-treated samples. HeLa cells treated with 1 µg O3/mL showed significantly higher values than CTR and O2-treated samples after 30 min and 1 h, but for longer times the values became similar each other (Figure 3a). The percentage of flat cells was generally similar in CTR, O2-treated, 1 µg O3/mL-treated and 20 µg O3/mL-treated samples at 30 min, 1 h and 2 h after treatment; after 4 h and 6 h, O2-treated cells showed lower values. Cells treated with 10 µg O3/mL showed significantly higher values at all post-treatment times (Figure 3b). Fluorescent phalloidin labelling of actin confirmed that, 24 h from treatment, cytoskeletal microfilaments of cells treated with 10 µg O3/mL were more distended than those of all the other conditions (Figure 3c).
Figure 3.
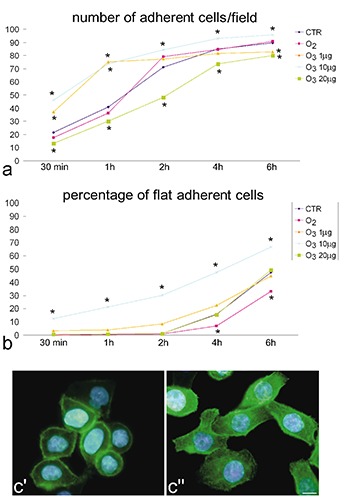
Effect of O3 exposure on cell adhesion. a) Mean values of the number of adherent cells per optical field and b) percentage of flat adherent cells, evaluated at increasing times after post-treatment seeding; asterisks indicate values significantly different from CTR; SE values have been omitted to improve graph readability. c’, c’‘) Fluorescence micrographs of CTR and 10 µg O3/mL-treated cells 24 h after treatment and seeding; cytoskeletal actin was labelled with FITC-conjugated phalloidin (green); nuclear DNA was stained with Hoechst (blue); O3 10 µg O3/mL-treated cells are apparently flatter and the actin filaments more organized: scale bar: 10 µm.
In situdetection of Reactive Oxygen Species
The cytochemical method based on a DAB-Mn2+-Co2+ reaction demonstrated that positive cells were less than 0.1% in all samples after both 30 min and 5 h post-treatment (not shown). Positive control cells treated with 9.8 M H2O2 showed diffuse and granular blue staining both in the cytoplasm and nucleus (not shown). On the basis of the results obtained for cell viability and kinetic cell features, only the ozone treatments inducing positive performance (1 and 10 µg O3/mL) were further investigated for their effects on mitochondrial and nuclear function by means of cytometry, fluorescence microscopy and transmission electron microscopy.
Mitochondrial membrane potential
Flow cytometric analysis of mitochondrial JC-1 incorporation demonstrated that all cell samples showed similar values of red and green fluorescence, thus revealing similar amounts of polarised and depolarised mitochondria (Figure 4).
Figure 4.
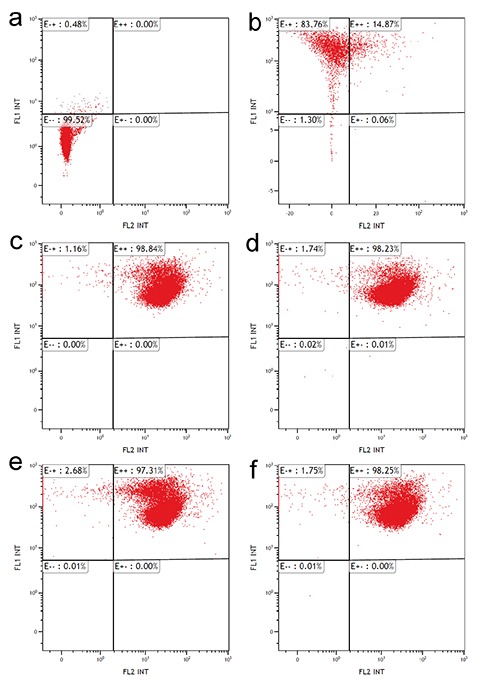
Effect of O3 exposure on mitochondrial membrane potential: flow cytometry of mitochondrial staining with JC-1. Autofluorescence control (a), negative red positive green fluorescence control (b), double positive red/green fluorescence control (air-treated cells) (c), cells exposed to O2 (d), cells exposed to 1 µg O3/mL (e), and 10 µg O3/mL (f). Note the similar fluorescence distribution in c,d,e and f.
Immunofluorescence microscopy
Immunolabelling for Hsp70 showed a punctuate distribution of the protein in the cell nucleoplasm and a diffuse labelling in the cytoplasm, whereas the nucleolus was always devoid of signal. No evident differences were observed in signal distribution among samples. Labelling with the antiserum recognizing the mitochondrial 70 kDa E2 subunit of the pyruvate dehydrogenase complex allowed visualization of all cell mitochondria; labelling for mtHsp70 mostly matched that for pyruvate dehydrogenase complex and did not demonstrate evident differences among the samples (not shown).
Ultrastructural morphology and immunocytochemistry
Ultrastructural observations revealed similar morphological features in control, O2-treated, 1 µg O3/mL-treated and 10 µg O3/ mL-treated HeLa cells after 24 h post-treatment. The only evident morphological difference concerned mitochondria of O3-treated cells: in fact, in 1 µg O3/ mL-treated cells the mitochondria appeared small and poor in cristae, whereas in 10 µg O3/ mL-treated cells the mitochondria showed well developed abundant cristae (Figure 5 a-d). Morphometric evaluations confirmed these observations (Figure 5 e,f). Immunocytochemical analyses demonstrated BrU incorporation in perichromatin fibrils and the nucleolar dense fibrillar component of all cell samples (Figure 6 a,b); quantitative evaluation revealed a significantly higher labelling density in both nucleoplasm and nucleolus of 10 µg O3/mL-treated cells in comparison to the other samples (Figure 6 c,d). Labelling for Hsp70 protein was found in the cytoplasm as a scattered signal while in the cell nucleus the labelling was specifically located in the perichromatin fibrils of all cell samples; in addition, in 10 µg O3/ml-treated cells some nucleolar labelling was also observed (Figure 7 a,b). Quantitative evaluation demonstrated significant differences in labelling density among samples; in particular, 10 µg O3/mL-treated cells showed lower cytoplasmic values and higher nucleoplasmic and nucleolar values in comparison to controls (Figure 7 c-e). Labelling for mtHsp70 protein was found inside mitochondria and as a weak scattered signal through the cytoplasm of all cell samples (Figure 8 a,b); quantitative evaluation demonstrated significantly higher density of gold particles in the mitochondria of 10 µg O3/mL-treated cells in comparison to the other samples (Figure 8c), whereas the cytoplasmic labelling did not significantly change among samples (1.27±0.04 in CTR, 1.85±0.07 in O2-treated cells, 1.44±0.03 in 1 µg O3/mL-treated cells, and 1.76±0.06 in 10 µg O3/mL-treated cells).
Figure 5.
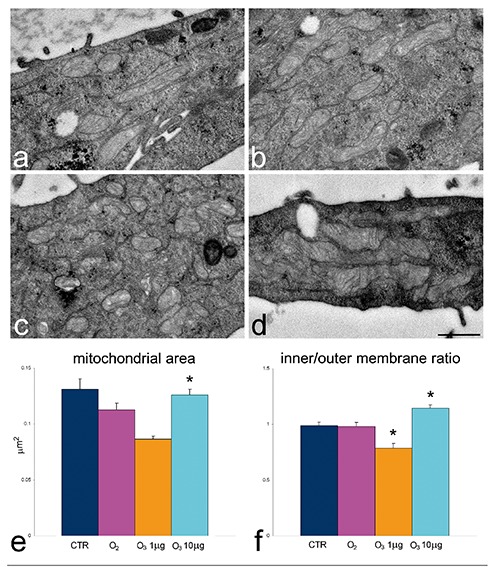
Effect of O3 exposure on mitochondrial ultrastructure: transmission electron micrographs of CTR (a), O2 (b), 1 µg O3/mL-(c) and 10 µg O3/mL- (d) treated. In 1 µg O3/mL-treated cells mitochondria are small and contain scarce cristae whereas in 10 µg O3/mL-treated cells mitochondria are large with well developed cristae; scale bar: 500 nm. e,f) Mean±SE values of mitochondrial area and inner/outer membrane ratio; asterisks indicate values significantly different from each other.
Figure 6.
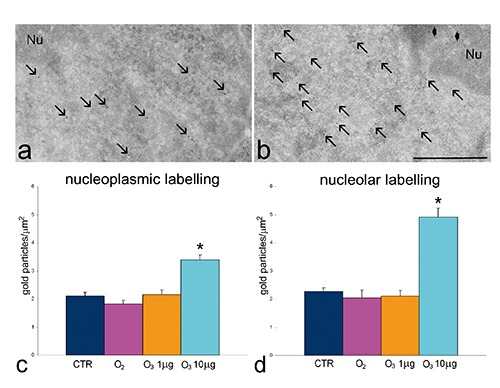
Effect of O3 exposure on RNA transcription: representative transmission electron micrographs of CTR (a) and 10 µg O3/mL-treated cells (b) labelled for BrU; BrU molecules have been incorporated in perichromatin fibrils (arrows) and in the nucleolar dense fibrillar component (arrowheads); Nu, nucleolus; scale bar: 500 nm. c,d) Mean±SE values of BrU labelling density evaluated on nucleoplasm and nucleoli of cells incubated with BrU 24 h post-treatment; asterisks indicate values significantly different from each other.
Figure 7.
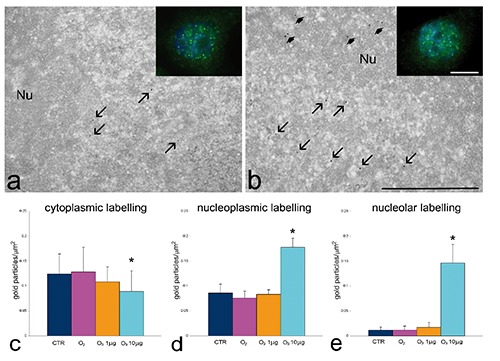
Effect of O3 exposure on Hsp70 cell distribution: representative fluorescence (insets) and transmission electron micrographs of CTR (a) and 10 µg O3/mL-treated (b) cells labelled for Hsp70; the signal occurs in both cytoplasm and nuclei; perichromatin fibrils (arrows) and nucleoli (Nu, arrowheads) show specific labelling; scale bar: 500 nm; inset scale bar: 10 µm. c-e) Mean±SE values of anti-Hsp70 labelling density evaluated on cytoplasm, nucleoplasm and nucleoli of cells 24 h post-treatment; asterisks indicate values significantly different from each other.
Figure 8.
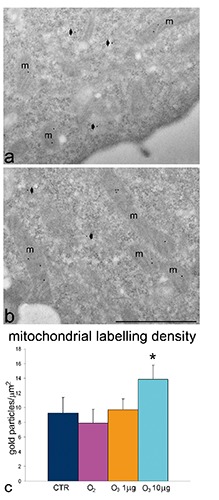
Effect of O3 exposure on mtHsp70 cell distribution: representative transmission electron micrographs of CTR (a) and 10 µg O3/mL-treated (b) cells labelled for mtHsp70. The mitochondria (m) show specific labelling; some diffuse signal is present in the cytoplasm (arrowheads); scale bar: 500 nm. c) Mean±SE values of anti-mtHsp70 labelling density evaluated on mitochondria 24 h post-treatment; asterisk indicates value significantly different from each other.
Samples processed in the absence of primary antibodies revealed a negligible signal for all the probes used (not shown).
Discussion
In this study, the cytochemical and immunocytochemical approach used for investigating in situ the cellular response to low ozone concentrations provided original information on multiple effects on cytoplasmic and nuclear pathways which could account for the regenerative therapeutic potential. It is also worth underlying that, using an in vitro model, it was possible to investigate the direct effects of mild ozonization on some cellular mechanisms, excluding the confusing influence of the organismic reaction occurring in animal models in vivo. Moreover, the reliability of the whole experimental procedure was guaranteed by choosing a well-established technique for cell ozonization.9 Interestingly, under our experimental conditions, oxygen exposure did not induce any significant effect in comparison to treatment with air, demonstrating that the cellular responses observed after treatment with the O2-O3 gas mixtures was actually due to ozone.
Our results demonstrated that exposure of HeLa cells to ozone concentrations ranging from 1 to 20 µg/mL did not induce significant alterations of their proliferation or death rate when compared to samples exposed to either O2 or air. On the other hand, ozone exposure proved to remarkably affect the capability of HeLa cells to restore, after the treatment in suspension, their typical morphology as flat cells adhering to the substrate, and this effect was manifestly related to the gas concentration. In fact, when compared to air or O2-treated samples, 20 µg O3/mL-treated cells showed a significantly reduced adhering and flattening ability, whereas exposure to 10 µg O3/mL significantly improved adhesion/flattening; 1 µg O3/mL had positive effects after short time but subsequently cell performance reverted to the control level.
It has been reported that ROS may affect in a dose-dependent manner the dynamics of cytoskeletal proteins (actin and myosin), high levels inducing protein depolymerization while low levels promoting polymerization and remodelling.14-16 In our experiments, ROS production was found to be minimal (as detected by the enzyme-histochemical approach used) with no consequence on cell viability; however, the effect on the polymerization of cytoskeletal proteins may likely depend on small local changes in ROS amounts. It can be thus hypothesised that, in our experimental model, exposure to 10 µg O3/mL led to an efficient reorganization of cytoskeletal elements, thus rapidly allowing cells to adhere and flatten, whereas 1 µg O3/mL treatment was only able to activate short-term positive effects; conversely, 20 µg O3/mL led to hindering of cytoskeletal reorganization after cell seeding. It has been reported17,18 that ozone exposure may increase in a dose-dependent manner the negative charges of the cell membrane, and this could also influence cell adhesion. It is, therefore, tempting to speculate that the effects of low ozone concentrations on the properties of the cell membrane and cytoskeleton may account for the observed positive effects of ozone therapy on wound healing.19-21
We found that the structure and functional features of mitochondria were significantly affected by mild ozonization (10 and 1 µg O3/mL) in comparison to the air- or O2-treated samples. Mitochondria are known to be very sensitive to even mild oxidative stress (recent review in22) and thus they represent an expected target for ozone. In particular, oxidative stress can induce mitochondrial fission, and ozone is known to cause alterations of the mitochondrial respiratory chain enzymes.23,24 However, low ROS concentrations can activate protective responses such as the expression of mtHsp70,25 a member of the HSP70 protein family whose expression is affected by ozone exposure26 and which is involved in multiple mitochondrial and extra-mitochondrial functions (reviews in27,28). We actually observed that 10 µg O3/mL-treatment increased mitochondrial cristae length and mtHsp70 protein content, while 1 µg O3/mL-treatment led to a decrease in mitochondrial size and cristae length, and did not affect mtHsp70. On the other hand, no significant modification of mitochondrial membrane potential was found under our experimental conditions.
Hsp70, another protein implicated in the response to stress (including heat shock and oxidative stress), was found to undergo intracellular redistribution in HeLa cells after 10 µg O3/ml-treatment. Hsp70 was already reported to be involved in ozone-induced response in vivo and in vitro,29-31 and in our model system we found that Hsp70 accumulated in the nucleoplasm (though maintaining the usual distribution in the perichromatin fibrils, i.e., the pre-mRNA transcription site32), and was also found in the nucleolus, which is usually devoid of this protein. This is consistent with reports in the literature on the accumulation of Hsp70 in nuclear and nucleolar transcriptional sites, as a response to various stresses,33-36 and with our observation that exposure to 10 µg O3/mL increased RNA transcription, as demonstrated by BrU incorporation in both nucleoplasm and nucleolus. Accordingly, ozone treatment has been demonstrated to activate expression of specific genes (review in8). It is worth noting that, at the concentrations used in this study, ozone exposure proved to preserve the normal ultrastructural features of cell organelles; in fact, no sign of degeneration was ever observed, and the morphological modifications occurring in mitochondria should be considered as the consequence of functional changes and not of organelle damage.
Taken together, our results demonstrate that, in our experimental model, 10 µg O3/mL-treatment induces positive and long-lasting cellular responses in cytoskeletal organization and mitochondrial activation, as well as in nuclear transcription. On the other hand, 1 µg O3/mL-treatment seems to represent a stimulus able to activate some transient responses only. Ozone is an instable gas that rapidly decomposes to normal dioxygen; this implies that ozone can induce long-lasting positive biological effects through a cascade of finelytuned molecular events acting onto different cellular components and metabolic pathways. Our results confirm that the effects of ozone administration are dependent on gas concentration, and demonstrate that the nucleus and the cytoplasmic organelles may be differently affected. We are well aware that these data have been obtained in an in vitro cell model and cannot be directly translated to the application in vivo for therapy; nonetheless, the evidence from the present experiments suggests that protocols of ozone administration may be developed to predictively ensure effective and permanent metabolic cell activation.
References
- 1.Re L, Mawsouf MN, Menéndez S, León OS, Sánchez GM, Hernández F. Ozone therapy: clinical and basic evidence of its therapeutic potential. Arch Med Res 2008;39:17-26. [DOI] [PubMed] [Google Scholar]
- 2.Elvis AM, Ekta JS. Ozone therapy: A clinical review. J Nat Sc Biol Med 2011;2:66-70. [DOI] [PMC free article] [PubMed] [Google Scholar]
- 3.Bocci V. How a calculated oxidative stress can yield multiple therapeutic effects. Free Radic Res 2012;46:1068-75. [DOI] [PubMed] [Google Scholar]
- 4.Bocci V, Zanardi I, Travagli V. Potentiality of oxygen-ozone therapy to improve the health of aging people. Curr Aging Sci 2010; 3:177-87. [DOI] [PubMed] [Google Scholar]
- 5.El-Sawalhi MM, Darwish HA, Mausouf MN, Shaheen AA. Modulation of age-related changes in oxidative stress markers and energy status in the rat heart and hippocampus: a significant role for ozone therapy. Cell Biochem Funct 2013;31:518-25. [DOI] [PubMed] [Google Scholar]
- 6.Shehata NI, Abd-Elgawad HM, Mawsouf MN, Shaheen AA. The potential role of ozone in ameliorating the age-related biochemical changes in male rat cerebral cortex. Biogerontology 2012;13:565-81. [DOI] [PubMed] [Google Scholar]
- 7.SCO3- International Scientific Committee of Ozonetherapy. (Madrid, 2012). Ozone therapy and its scientific foundations. Available from: http://www.isco3.org [Google Scholar]
- 8.Sagai M, Bocci V. Mechanisms of action involved in ozone therapy: is healing induced via a mild oxidative stress? Med Gas Res 2011;1:29. [DOI] [PMC free article] [PubMed] [Google Scholar]
- 9.Larini A, Bianchi L, Bocci V. The ozone tolerance: I) Enhancement of antioxidant enzymes is ozone dose-dependent in Jurkat cells. Free Radical Res 2003;37:1163-8. [DOI] [PubMed] [Google Scholar]
- 10.Freitas I, Griffini P, Bertone V, Bertone R, Fenoglio C, Milliery R, et al. In situ detection of reactive oxygen species and nitric oxide production in normal and pathological tissues: improvement by differential interference contrast. Exp Gerontol 2002;37:591-602. [DOI] [PubMed] [Google Scholar]
- 11.Reers M, Smith TW, Chen LB. J-aggergate formation of a carbocyanine as a quantitative fluorescent indicator of membrane potential. Biochemistry 1991;30:4480-6. [DOI] [PubMed] [Google Scholar]
- 12.Bottone MG, Soldani C, Veneroni P, Avella D, Pisu M, Bernocchi G. Cell proliferation, apoptosis and mitochondrial damage in rat B50 neuronal cells after cisplatin treatment. Cell Prolif 2008;41:506-20. [DOI] [PMC free article] [PubMed] [Google Scholar]
- 13.Jensen PO, Larsen J, Christiansen J, Larsen JK. Flow cytometric measurement of RNA synthesis using bromouridine labelling and bromodeoxyuridine antibodies. Cytometry 1993;14:455-8. [DOI] [PubMed] [Google Scholar]
- 14.Sakai J, Li J, Subramanian KK, Mondal S, Bajrami B, Hattori H, et al. Reactive oxygen species (ROS)-induced actin glutathionylation controls actin dynamics in neutrophils. Immunity 2012;37:1037-49. [DOI] [PMC free article] [PubMed] [Google Scholar]
- 15.Taulet N, Delorme-Walker VD, Der-Mardirossian C. Reactive oxygen species regulate protrusion efficiency by controlling actin dynamics. PLoS ONE 2012;7:e41342. [DOI] [PMC free article] [PubMed] [Google Scholar]
- 16.Muliyil S, Narasimha M. Mitochondrial ROS regulates cytoskeletal and mitochondrial remodeling to tune cell and tissue dynamics in a model for wound healing. Dev Cell 2014;28:239-52. [DOI] [PubMed] [Google Scholar]
- 17.Travagli V, Zanardi I, Silvietti A, Bocci V. A physicochemical investigation on the effects of ozone on blood. Int J Biol Macromol 2007;41:504-11. [DOI] [PubMed] [Google Scholar]
- 18.Artis AS, Aydogan S, Sahin MG. The effects of colorectally insufflated oxygen-ozone on red blood cell rheology in rabbits. Clin Hemorheol Microcirc 2010;45:329-36. [DOI] [PubMed] [Google Scholar]
- 19.Jacinto A, Martinez-Arias A, Martin P. Mechanisms of epithelial fusion and repair. Nat Cell Biol 2001;3:E117-23. [DOI] [PubMed] [Google Scholar]
- 20.Cowin AJ, Hatzirodos N, Teusner JT, Belford DA. Differential effect of wounding on actin and its associated proteins, paxillin and gelsolin, in fetal skin explants. J Invest Dermatol 2003;120:1118-29. [DOI] [PubMed] [Google Scholar]
- 21.Lees JG, Ching YW, Adams DH, Bach CT, Samuel MS, Kee AJ, et al. Tropomyosin regulates cell migration during skin wound healing. J Invest Dermatol 2013;133:1330-9. [DOI] [PubMed] [Google Scholar]
- 22.Mailloux RJ, Jin X, Willmore WG. Redox regulation of mitochondrial function with emphasis on cysteine oxidation reactions. Redox Biol 2014;2:123-39. [DOI] [PMC free article] [PubMed] [Google Scholar]
- 23.Madej P, Plewka A, Madej JA, Plewka D, Mroczka W, Wilk K, et al. Ozone therapy in induced endotoxemic shock. II. The effect of ozone therapy upon selected histochemical reactions in organs of rats in endotoxemic shock. Inflammation 2007;30:69-86. [DOI] [PubMed] [Google Scholar]
- 24.Lintas G, Molinari F, Simonetti V, Franzini M, Liboni W. Time and time-frequency analysis of near-infrared signals for the assessment of ozone autohemotherapy long-term effects in multiple sclerosis. Conf Proc IEEE Eng Med Biol Soc 2013;2013:6171-4. [DOI] [PubMed] [Google Scholar]
- 25.Liu Y, Liu W, Song X-D, Zuo J. Effect of GRP75/mthsp70/PBP74/mortalin overexpression on intracellular ATP level, mitochondrial membrane potential and ROS accumulation following glucose deprivation in PC12 cells. Mol Cell Biochem 2005;268:45–51. [DOI] [PubMed] [Google Scholar]
- 26.Wu R, Zhao YH, Plopper CG, Chang MM, Chmiel K, Cross JJ, et al. Differential expression of stress proteins in nonhuman primate lung and conducting airway after ozone exposure. Am J Physiol 1999;277:L511-22. [DOI] [PubMed] [Google Scholar]
- 27.Wadhwa R, Taira K, Kaul SC. An Hsp70 family chaperone, mortalin/mthsp70/PBP74/Grp75: what, when, and where? Cell Stress Chaperones 2002;7:309-16. [DOI] [PMC free article] [PubMed] [Google Scholar]
- 28.Flachbartová Z, Kovacech B. Mortalin - a multipotent chaperone regulating cellular processes ranging from viral infection to neurodegeneration. Acta Virol 2013;57:3-15. [DOI] [PubMed] [Google Scholar]
- 29.Cardile V, Jiang X, Russo A, Casella F, Renis M, Bindoni M. Effects of ozone on some biological activities of cells in vitro. Cell Biol Toxicol 1995;11:11-21. [DOI] [PubMed] [Google Scholar]
- 30.Bocci V, Aldinucci C, Mosci F, Carraro F, Valacchi G. Ozonation of human blood induces a remarkable upregulation of heme oxygenase-1 and heat stress protein-70. Mediators Inflamm 2007;2007:26785. [DOI] [PMC free article] [PubMed] [Google Scholar]
- 31.Bauer AK, Rondini EA, Hummel KA, Degraff LM, Walker C, Jedlicka AE, et al. Identification of candidate genes downstream of TLR4 signaling after ozone exposure in mice: a role for Heat-Shock Protein 70. Environ Health Perspect 2011; 119:1091-7. [DOI] [PMC free article] [PubMed] [Google Scholar]
- 32.Fakan S. Ultrastructural cytochemical analyses of nuclear functional architecture. Eur J Histochem 2004;48:5-14. [PubMed] [Google Scholar]
- 33.Nollen EA, Salomons FA, Brunsting JF, van der Want JJ, Sibon OC, Kampinga HH. Dynamic changes in the localization of thermally unfolded nuclear proteins associated with chaperone-dependent protection. Proc Natl Acad Sci USA 2001;98:12038-43. [DOI] [PMC free article] [PubMed] [Google Scholar]
- 34.Kotoglou P, Kalaitzakis A, Vezyraki P, Tzavaras T, Michalis LK, Dantzer F, et al. Hsp70 translocates to the nuclei and nucleoli, binds to XRCC1 and PARP-1, and protects HeLa cells from single-strand DNA breaks. Cell Stress Chaperones 2009;14:391-406. [DOI] [PMC free article] [PubMed] [Google Scholar]
- 35.Ba ski P, Mahboubi H, Kodiha M, Shrivastava S, Kanagaratham C, Stochaj U. Nucleolar targeting of the chaperone hsc70 is regulated by stress, cell signaling, and a composite targeting signal which is controlled by autoinhibition. J Biol Chem 2010;285:21858-67. [DOI] [PMC free article] [PubMed] [Google Scholar]
- 36.Khalouei S, Chow AM, Brown IR. Localization of heat shock protein HSPA6 (HSP70B’) to sites of transcription in cultured differentiated human neuronal cells following thermal stress. J Neurochem 2014;131:743-54. [DOI] [PubMed] [Google Scholar]


