

Abstract
Phylogenetics is the study of the evolutionary relatedness among groups of organisms. Molecular phylogenetics uses sequence data to infer these relationships for both organisms and the genes they maintain. With the large amount of publicly available sequence data, phylogenetic inference has become increasingly important in all fields of biology. In the case of natural product research, phylogenetic relationships are proving to be highly informative in terms of delineating the architecture and function of the genes involved in secondary metabolite biosynthesis. Polyketide synthases and nonribosomal peptide synthetases provide model examples in which individual domain phylogenies display different predictive capacities, resolving features ranging from substrate specificity to structural motifs associated with the final metabolic product. This chapter provides examples in which phylogeny has proven effective in terms of predicting functional or structural aspects of secondary metabolism. The basics of how to build a reliable phylogenetic tree are explained along with information about programs and tools that can be used for this purpose. Furthermore, it introduces the Natural Product Domain Seeker, a recently developed Web tool that employs phylogenetic logic to classify ketosynthase and condensation domains based on established enzyme architecture and biochemical function.
1. INTRODUCTION
1.1. A short introduction to phylogeny
All life on earth is united by a shared evolutionary history. Phylogenetics is the study of that history based on the principles of common ancestry and descent. In the premolecular age, organismal phylogenies were generally created based on morphological character states. With the advent of DNA sequencing, molecular phylogenetics has become the standard for inferring evolutionary relationships. In general, molecular methods are considered far superior since the actions of evolution are ultimately reflected in genetic sequences. The analysis of DNA and protein sequences also provides unprecedented opportunities to infer gene phylogenies, which in many cases may not be congruent with the phylogenies of the organisms in which the genes reside. These incongruences can be due to different rates of gene evolution and, more dramatically, to the process of horizontal gene transfer (HGT), which is now widely recognized as a major force driving bacterial evolution (Ochman, Lerat, & Daubin, 2005).
With the enormous advances being made in next generation sequencing technologies, the analysis of DNA and amino acid sequence data, loosely defined as bioinformatics, has become increasingly important in all fields of biology (Mak, 2010). In natural product research, bioinformatic tools have been developed for a variety of applications including the in silico analysis of secondary metabolite biosynthetic gene clusters and the small molecules they produce. Online tools such as the nonribosomal peptide synthetases (NRPS)/polyketide synthases (PKS) database (Yadav, Gokhale, & Mohanty, 2009), NP searcher (Li, Ung, Zajkowski, Garneau-Tsodikova, & Sherman, 2009), and antiSMASH (Medema et al., 2011) have made biosynthetic gene analysis highly accessible. Many of these tools have been reviewed (Bachmann & Ravel, 2009) and will not be discussed in detail here. In general, they are based on the identification of DNA and amino acid sequence similarities and the assumption that these similarities imply similar function. An additional approach is to put sequences into an evolutionary context using phylogenetic methods. The advantage of this approach is that similar sequences can have a diversity of functions that can be resolved based on evolutionary relationships (Eisen, 1998).
Phylogenetic analyses are usually displayed graphically in so-called phylogenetic trees, where each branch of the tree represents one organism or gene (Fig. 8.1). Contemporary phylogenetic concepts were first developed in the 1960s and 1970s (O'Malley & Koonin, 2011) and, with the introduction of DNA sequence data, revolutionized our understanding of microbial evolution and systematics (Woese, 1987). In natural products chemistry, “species trees” based on phylogenetic markers have mainly been used to provide a more accurate identification of the source organism and, in some cases, to draw correlations between taxonomy and secondary metabolite production (Engene et al., 2011; Jensen, 2010; Larsen, Smedsgaard, Nielsen, Hansen, & Frisvad, 2005). During the past decade, the applications of molecular phylogeny have grown exponentially. Phylogeny is now routinely used to improve functional predictions, and “phylogenomics” has been adopted to trace the history of functional change (Eisen, 1998; Eisen & Fraser, 2003). The increased use of phylogenetics in natural product research has provided remarkable new insight into the evolution of the extraordinarily large and complex genes and gene pathways responsible for secondary metabolite biosynthesis.
Figure 8.1.
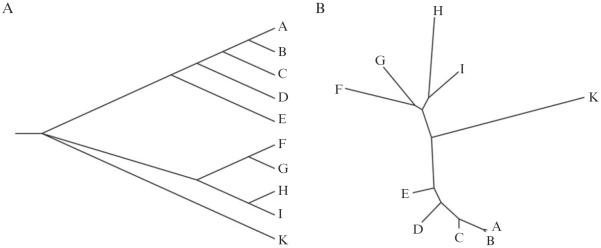
Phylogenetic trees. Molecular phylogenetic analyses are usually displayed in the form of trees. Examples include (A) a rooted rectangular tree or (B) an unrooted radial tree. Both maximum likelihood trees were generated using MEGA.
This chapter provides a short overview of the applications of phylogenetics in natural product research. The aims are to demonstrate the tremendous predictive powers of these methods in terms of identifying common biosynthetic capabilities and new biosynthetic paradigms. It is not intended to be a comprehensive review of phylogenetic methods or theory as provided elsewhere(Salemi & Vandamme, 2003; Schmitt & Barker, 2009). Instead, the goals are to provide a brief introduction on how to build and interpret a reliable phylogenetic tree. This is followed by a discussion of select bioinformatic tools with a focus on the Natural Product Domain Seeker (NaPDoS), which can be used to classify biosynthetic genes based on their phylogenetic relationships.
1.2. The biosynthetic logic of secondary metabolism
Two of the most common enzyme families associated with natural product biosynthesis are PKSs and NRPSs. These genes are responsible for the biosyn-thesis of the majority of bioactive microbial metabolites identified today. Polyketide and nonribosomal peptide biosynthetic pathways are multienzyme complexes that sequentially construct natural products in an assembly line process from carboxylic acid and amino acid building blocks, respectively (Hertweck, 2009; Marahiel, Stachelhaus, & Mootz, 1997). They consist of multiple domains that are responsible for the activation, thiolation (T), condensation (C), and modification of the individual monomers that are incorporated into the final product. In certain PKS classes and most NRPSs, these domains occur in multimodular architectures, resulting in single genes that can exceed 40 kb, making them among the largest bacterial genes known. The evolutionary history of these domains and modules can be highly complex, revealing rapid rates of evolution through recombination, gene duplication, and HGT (Jenke-Kodama & Dittmann, 2005; Jenke-Kodama, Sandmann, Muller, & Dittmann, 2005).
1.2.1 Polyketide synthases
Polyketides are polymers of acetate and other simple carboxylic acids. Despite the simplicity of these building blocks, they display remarkable levels of structural diversity due to the combinatorial nature of the assembly line process and frequent postassembly modifications (Fischbach & Walsh, 2006). Many well-known antibiotics including erythromycin and tetracycline are polyketides, as are the dinoflagellate polyethers, which are among the largest secondary metabolites known (Kellmann, Stuken, Orr, Svendsen, & Jakobsen, 2010). PKSs are highly diverse and widespread having been detected in bacteria, fungi, plants, and various eukaryotic genomes, however they are best known as bacterial secondary metabolites. Their sporadic taxonomic distributions and known propensity for HGT makes their evolutionary histories especially interesting (Jenke-Kodama et al., 2005).
PKS genes are generally too large and complex for meaningful phylo-genetic analysis; however, individual domain phylogenies are remarkably informative. While T domains are generally too short for analysis, the elongation or ketosynthase (KS) domains have proven highly predictive of pathway associations and enzyme architecture (Jenke-Kodama et al., 2005; Moffitt & Neilan, 2003; Nguyen et al., 2008; Ridley, Lee, & Khosla, 2008). On the other hand, the substrate activating or acyltransferase (AT) domains clade based on substrate specificity and can be used to predict the incorporation of malonyl- or methylmalonyl-CoA into the growing polyketide chain. Of the three optional reductive domains, ketoreductase phylogeny can be used to predict the stereochemistry of the resulting hydroxyl group (Jenke-Kodama, Börner, & Dittmann, 2006). Finally, the phylogeny of thioesterase domains, which cleave the polyketide product from the carrier protein, can be used to predict if this product will be linear or cyclic. KS domains are the most conserved and form an essential part of each PKS gene cluster. These domains have been used to fingerprint PKS genes from individual strains (Edlund, Loesgen, Fenical, & Jensen, 2011) and environmental DNA (Wawrik et al., 2007). KS phylogeny has even been used to predict secondary metabolite diversity (Foerstner, Doerks, Creevey, Doerks, & Bork, 2008; Metsa-Ketela et al., 1999), structures (Freel, Nam, Fenical, & Jensen, 2011; Gontang, Gaudencio, Fenical, & Jensen, 2010), and the evolutionary processes that generate new structural diversity (Freel et al., 2011)
PKS genes are broadly divided into three types (PKSI-III) (Shen, 2003). These types are clearly resolved in a KS-based phylogenetic tree (Fig. 8.2) and reveal the close evolutionary history they share with fatty acid synthases (Jenke-Kodama et al., 2005). Type I PKSs are the most diverse and generally encode all catalytic domains on a single protein that acts iteratively or in a modular fashion. Iterative acting type I PKSs in fungi evolved independently from the iterative type I PKSs observed in bacteria (Kroken, Glass, Taylor, Yoder, & Turgeon, 2003) and can be further divided into reductive and nonreductive clades (Yadav et al., 2009). Remarkably, KS phylogeny can be used to identify at least eight well-supported type I PKS clades, each of which represents a distinct enzyme architecture or biochemical function (Ziemert et al., 2012). One of these clades comprises the iterative acting type I PKSs that are responsible for the biosynthesis of enediynes. This is one of the most biologically active classes of natural products yet to be discovered and includes the potent anticancer agent calicheamicin. More detailed phylogenetic analyses of this clade distinguish between genes that produce 9- or 10-membered core enediyne ring structures (Liu et al., 2003).
Figure 8.2.
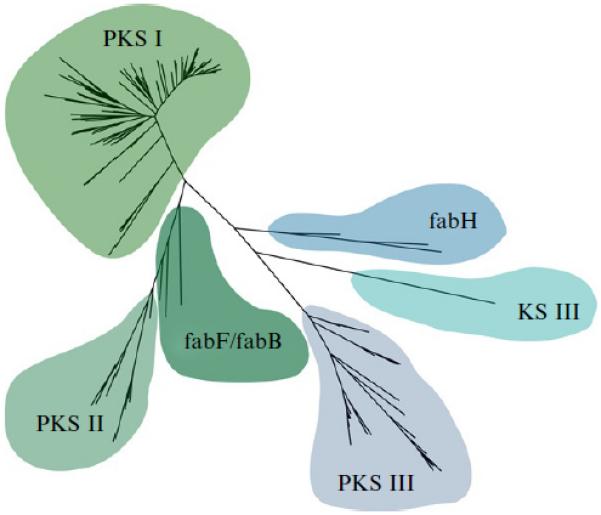
Ketosynthase domain phylogeny. The three PKS types (I–III) are clearly resolved in this KS phylogenetic tree as is their close relationship to various FAS (fab) genes. Sequences classified as KS III form a distinct lineage that is involved in the initiation of aromatic polyketide biosynthesis. This maximum likelihood tree was generated with PhyML using a manually curated alignment generated with muscle.
Type I KS domain phylogeny reveals another well-supported clade comprising modular PKSs that lack integrated AT domains. In these “trans-AT” PKSs, the AT catalytic activity is generally complemented by a freestanding enzyme (Nguyen et al., 2008). Trans-AT PKSs evolved by extensive HGT and maintain considerably greater modular diversity than the cis-AT group. Whereas the close cladding of cis-AT KS domains can be used to predict the production of similar compounds (Gontang et al., 2010), trans-AT KS phylogeny can be used to predict substrate specificity (Nguyen et al., 2008). This was a surprising finding, given that substrate specificity can be inferred from AT domain phylogeny in cis-AT PKSs.
Iterative acting type II PKSs encode each catalytic site on a distinct protein. Typical type II PKSs encode two distinct KS domains: KSα, which catalyzes the condensation reaction, and KSβ, also known as the chain length factor, which determines the number of iterative condensation steps that occur. These type II KS subclasses form two distinct phylogenetic lineages within the larger type II KS clade. Finer level phylogenetic relationships within the KSα clade correspond to the structural classes of the metabolites produced and can be used to distinguish between spore pigments, antracyclines, tetracyclines, and angucyclines, among others (Metsa-Ketela et al., 2002).
The KS phylogenetic tree reveals another distinct clade that has been called KS III (Fig. 8.2). These sequences are most closely related to FabH proteins, which are involved in fatty acid biosynthesis. KS III domains are involved in the initiation of aromatic polyketide biosynthesis and can incorporate unusual PKS starter units (Xu, Schenk, & Hertweck, 2007). Recently, a new type of KS III domain was discovered in the cervimycin biosynthetic pathway (Bretschneider et al., 2011). Phylogenetic analysis of the CerJ KS domain positioned it between the known KS III domains and ATs, suggesting it may have a new biochemical function. It was subsequently demonstrated that this KS domain is not involved in a typical Claisen condensation reaction but instead transfers activated malonyl units onto a sugar residue. A final KS clade comprises sequences derived from type III PKSs (Moore & Hopke, 2001). This family of multifunctional enzymes includes chalcone and stilbene synthases and was originally considered to be specific for plants before bacterial homologues were discovered (Moore et al., 2002).
1.2.2 Nonribosomal peptide synthetases
NRPSs are multimodular enzymes that are structurally similar to type I modular PKSs. Like PKSs, they are generally found clustered in operons that include genes associated with transport, resistance, posttranslational modification, and other functions required for the effective use of the natural product. NRPSs produce small peptides by condensing activated amino acids onto a growing peptide chain that is bound as a thioester to the enzyme (Fischbach & Walsh, 2006). NRPS genes have only been detected in prokaryotes and fungi (Bushley & Turgeon, 2010), where they are responsible for the biosynthesis of a variety of well-known bioactive compounds including penicillin and vancomycin. The minimal domain requirements of a typical NRPS module consist of an adenylation (A) domain that is responsible for substrate specificity and activation, a T domain that covalently tethers the substrate to the enzyme via a thioester bond, and a C domain that catalyzes peptide bond formation between the substrate and the growing peptide chain. Peptide modifying domains responsible for amino acid methylation or cyclization are sometimes observed and create additional structural diversity.
NRPS domain phylogenies are complex and reflect different evolutionary paradigms. C and A domains are the largest and most conserved and have been shown to evolve independently in the same pathway (Fewer et al., 2007). A major bioinformatic breakthrough was made with the discovery that the amino acids lining the A domain binding pocket are highly predictive of the amino acid substrate that is incorporated into the growing peptide (Stachelhaus, Mootz, & Marahiel, 1999). This discovery made it possible to use bioinformatics to predict the amino acid sequences of NRPS-derived peptides (Challis, Ravel, & Townsend, 2000). While A domain amino acid specificity can be resolved phyogenetically when limited to the eight amino acids in the binding pocket, these signatures are obscured when the larger (180–200 aa) domain sequences are considered (Challis et al., 2000). Nonetheless, A domain phylogenies have proven highly informative in that they tend to reveal clades that correspond to the gene in which they reside, making structural predictions of unknown NRPSs possible when compared to experimentally characterized biosynthetic pathways (Cramer et al., 2006). In addition, A domains associated with the biosynthesis of hybrid PKS/NRPS genes or with the incorporation of N-methylated amino acids and dioxypiperazines can be resolved (Cramer et al., 2006). A recent A domain phylogenomic study in fungi revealed two major clades representing the more ancient mono/bimodular NRPSs and the more recently evolved multimodular NRPSs (Bushley & Turgeon, 2010). These authors suggested that the rapid evolution of multimodular NRPS A domains reflect niche-specific adaptations.
C domain phylogeny clearly reflects the stereochemistry of the amino acids that are added to the growing peptide chain or other functional features of the enzyme. Six characteristic clades have been identified (Rausch, Hoof, Weber, Wohlleben, & Huson, 2007). These include LCL domains, which catalyze peptide bond formation between two l-amino acids, DCL domains, which condense an l-amino acid to a growing peptide ending with a d-amino acid, and starter C domains, which acylate the first amino acid with a β-hydroxy-carboxylic acid. In addition, cyclization domains catalyze both peptide bond formation and the subsequent cyclization of cysteine, serine, or threonine residues; epimerization (E) domains switch the chirality of the last amino acid in the growing peptide generally from l to d; and dual E/C domains catalyze both E and C reactions.
1.2.3 More examples
Phylogenetics is yielding useful information in the analysis of virtually all classes of biosynthetic enzymes. For example, terpenes are assembled from five-carbon isoprene units, which can subsequently be attached to other compound classes via prenyltransferases (PTases) (Heide, 2009). PTases have been divided into three major classes: isoprenyl pyrophosphate synthases (IPPSs), protein PTases, and aromatic PTases. The evolutionary relationships of aromatic PTases containing a PT-barrel fold suggest that fungal and bacterial enzymes share a common ancestry (Bonitz, Alva, Saleh, Lupas, & Heide, 2011). The DMATS family of fungal indole PTases catalyzes, among others, the prenylation of ergot alkaloids. Although no significant sequence similarity is detected between the fungal and bacterial enzymes, a sensitive analytical method called HHsearch (Soding, Biegert, & Lupas, 2005) revealed clear homology (Bonitz et al., 2011). No common ancestry could be detected between membrane-bound PTases, which are mostly involved in primary metabolism, and the soluble PT-barrel containing PTases associated with secondary metabolite biosynthesis, suggesting the evolution of multiple prenylation mechanisms in nature.
Ribosomally produced peptides (RPs) represent a class of secondary metabolites that is receiving increased attention. Bacteriocins represent one well-studied group of RPs and include the microcins of Escherichia coli and the lantibiotics of Gram-positive bacteria (Jack & Jung, 2000). Most bacteriocins contain a characteristic N-terminal leader sequence that is cleaved concomitant with translocation across the membrane (Michiels, Dirix, Vanderleyden, & Xi, 2001). Phylogenetic analysis of the peptidase domain revealed a clear distinction between Gram-positive and Gram-negative bacteria and a clade comprising cyanobacteria (Dirix et al., 2004). The colicins represent a family of RPs that can be divided into two different evolutionary lineages based on their mode of action (Riley & Wertz, 2002). Other RPs include the cyanobactins, which are widespread among cyanobacteria (Leikoski, Fewer, & Sivonen, 2009; Schmidt et al., 2005; Sudek, Haygood, Youssef, & Schmidt, 2006; Ziemert et al., 2008). Recent phylogenetic analyses could distinguish four different cyanobactin clades that can be linked to structural features of the compounds. In addition, a phylogenetic model was created to predict the products of orphan RP gene clusters (Donia & Schmidt, 2011). As shown in the examples above, phylogeny is increasingly being used to make effective predictions of secondary metabolite gene function.
2. WORKING WITH SEQUENCE DATA
2.1. Assembling the dataset
The general steps required for a phylogenetic analysis are outlined in Fig. 8.3. The first step is to find sequences that are homologous to the gene of interest. This is a crucial but often undervalued part of the analysis. Distinguishing homologs, that is, sequences that share a common ancestry, from sequences that share a random level of similarity is challenging but can be overcome by setting a conservative similarity threshold. Although there are exceptions, sequence similarities should generally be higher than 25% for proteins and 60% for DNA to produce meaningful phylogenies. It can also be helpful to select one or more sequences to function as out-groups. These should be homologous sequences that are more distantly related to all other sequences in the analysis than they are to each other. Out-groups are used to root the tree and help infer the direction of evolution. However, it can be difficult to find an appropriate out-group, as it implies the evolutionary context of the gene of interest is known. Midpoint rooting or creating an unrooted tree makes the selection of an out-group unnecessary.
Figure 8.3.
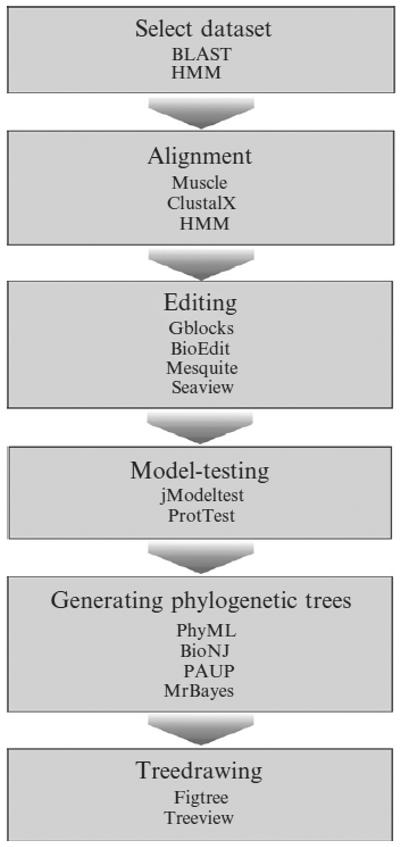
Phylogenetic workflow and software.
The easiest way to find sequences of interest is to perform a database search. Public sequence databases such as the National Center for Biotechnology Information (NCBI) allow keyword and sequence similarity searches. The most popular search algorithm is the Basic Local Alignment Search Tool (BLAST) (Table 8.1), which can accommodate nucleotide or protein sequences and identifies local regions of similarity and their statistical significance (Altschul et al., 1997). The BLAST tool provides a table of significant alignment hits that can be downloaded and used for further analyses. For protein searches, BLAST also offers the option of a position-specific iterative BLAST (PSI-BLAST) that creates a more sensitive profile for weak but biologically relevant sequence similarities (Altschul et al., 1997). For a more detailed review of how to use BLAST to find homologous sequences, see Ladunga (2002).
Table 8.1.
Select bioinformatic programs
In general, protein sequence similarity searches are more sensitive and therefore preferred to nucleic acid searches. However, if the protein of interest contains different functional domains, as in type I PKS and NRPSs, a comparison of the complete protein may not be very informative relative to independent domain analyses. A slightly different but potentially more sensitive approach to homolog searching is to use a Hidden-Markov-Model (HMM). HMMs are probabilistic models used to create sensitive protein family profiles that can be used to screen genomes or databases for homologous sequences (Finn, Clements, & Eddy, 2011).
2.2. Creating alignments
Before running a phylogenetic analysis, it is important to make sure that homologous sites are compared. This is accomplished by creating an alignment in which each sequence is assigned a separate row and homologous positions in different sequences aligned in columns. Generating an accurate alignment is easier when the sequences are similar and becomes more difficult when diverse or repetitive sequences are analyzed. A variety of software packages are available to perform multiple alignments including ClustalX (Thompson, Gibson, Plewniak, Jeanmougin, & Higgins, 1997) and Muscle (Edgar, 2004; Table 8.1). ClustalX belongs to the older class of programs in which sequences are progressively aligned starting with the most similar sequences. Newer programs such as Muscle work iteratively and are considered to be more accurate since they reoptimize the initial alignment. An additional approach uses HMMs (Section 2.1) to generate alignments (Finn et al., 2011). The HMMER software can be used for both sequence alignment and the detection of sequence similarity. As with BLAST searches, amino acid sequence alignments are generally easier to generate and less ambiguous than nucleic acid alignments.
Depending on the alignment program, there might be various options and parameters to select. One important option is to choose a protein or DNA weight matrix. These are empirically based models of how likely it is that one amino acid or nucleotide changes into another. Another option is the gap penalty, which regulates the number of gaps that are allowed in the alignment. It is important to explore these options and test what impact they have on the alignment, as it is the foundation of all analyses that follow.
2.3. Editing the alignment
Once an alignment has been created, manual curation is highly recommended to maximize accuracy and avoid artifacts. Truncated sequences should be deleted and longer sequences shortened so that all are equal in length. Highly variable regions can be masked as they may not be phylogenetically informative. Likewise, gaps increase the risk of misalignment, which can result in inaccurate trees. However, variable regions can provide important phylogenetic information so they are best interpreted on a case-by-case basis. For proteins, knowledge about active sites and structure can be taken into consideration when editing the alignment. If it is not clear whether regions are important for the analysis, it is recommended to test different alignments by generating preliminary trees. There are also automated methods such as AltAVisT (Morgenstern, Goel, Sczyrba, & Dress, 2003) and gblocks (Talavera & Castresana, 2007) that perform alignment sensitivity tests and eliminate poorly aligned and divergent regions. However, these methods should never replace a careful manual inspection of the alignment. Free software programs that can be used to edit alignments include Bioedit, Mesquite (Maddison & Maddison, 2009), and Seaview (Gouy, Guindon, & Gascuel, 2010; Table 8.1). These programs can also be used to convert the alignments into the different formats needed for phylogenetic analysis.
2.4. Model tests
Generating a phylogenetic tree with maximum likelihood (ML) or Bayesian methods is based on statistical models. Although it is important to test different parameters to determine the robustness of a tree, it is also important to identify which model best fits the data. One popular program is ProtTest (Abascal, Zardoya, & Posada, 2005; Table 8.1), which calculates likelihood values using different models and estimates the optimal parameters for the subsequent tree calculation. Models of nucleotide substitution can be calculated with the jmodeltest software (Posada, 2008). Model testing and alignment editing are not essential steps in generating phylogenetic trees, but both are recommended to improve accuracy and branch support.
2.5. Generating phylogenetic trees
It is important to keep in mind that the “true” tree cannot be identified and that phylogeny is a statistical estimation of the most likely evolutionary relationships of the sequences. This is why it is called phylogenetic inference and why it is important to use more than one method to test the consistency of the results and the robustness of the trees. There are four major methods to generate phylogenetic trees from amino acid or nucleotide sequences. The fastest method for most alignments is neighbor-joining (NJ) (Saitou & Nei, 1987). It is the most commonly used distance-based method and calculates a distance matrix for all pairs of sequences in the alignment. It then builds a tree based on the minimum-evolution criterion and the distance relationships. Since it is relatively fast, NJ is widely used to produce preliminary trees and as a starting point for other model-based methods. However, other methods should always be used to support the results. A variety of software packages are available that provide NJ analysis such as BioNJ (Gascuel, 1997), PAUP★ (http://paup.csit.fsu.edu/), MEGA (Tamura et al., 2011), and PHYLIP (Felsenstein, 2005; Table 8.1).
A method that also uses the minimum-evolution criterion is maximum parsimony (MP). However, MP and the following methods introduced here differ fundamentally from distance methods in that they calculate the optimal tree from a diversity of possible trees. Among these “tree searching” methods, Parsimony is known to be the most intuitive because it detects the tree that requires the fewest number of changes in the data. However, with larger datasets, the number of possibilities increases exponentially as do the computational demands. Furthermore, MP often calculates multiple trees that are equally parsimonious and therefore a comparison with other treeing methods is recommended. Commonly used software to generate MP trees is PAUP★, but packages such as PHYLIP (Felsenstein, 2005) can also be used.
Statistical methods based on specific models of evolution include ML and Bayesian analyses. ML calculates the probability of a tree, given certain parameters, and produces a tree with the highest likelihood score. Bayesian approaches are similar in that likelihood scores are calculated; however, instead of looking for one tree, the best set of trees is calculated. Posterior probabilities are then calculated using the Markov chain Monte Carlo algorithm, which results in a collection of trees that can be summarized in a consensus tree (Larget & Simon, 1999). Both treeing methods demand more computational power than MP and distance methods but are thought to be more accurate. ML methods are implemented in the programs TREE-PUZZLE (Schmidt, Strimmer, Vingron, & von Haeseler, 2002) and PhyML (Guindon & Gascuel, 2003), which was especially developed to deal with larger datasets. The Bayesian method is implemented in a program called MrBayes (Huelsenbeck & Ronquist, 2001).
Independent of which phylogenetic method is used, it is important to estimate the reliability of a given tree. The most common statistical method applied to phylogenetic trees is bootstrapping, which randomly samples with replacement the columns in the alignment and generates new trees using the same parameters. Bootstrap values represent the percentage of trees that possess each specific node. While bootstrap values can be statistically biased, values >75% are generally considered significant. Bayesian methods have the advantage that they provide posterior probabilities that identify the percent each clade occurs among all trees sampled. ML methods also offer the option to perform the Approximate Likelihood Ratio Test, which is derived from the likelihood score of each branch that is calculated during the tree search. These methods have the advantage that they require almost no additional computational time.
Finally, trees need to be visualized. Free and easy to use programs include Treeview and Figtree (Table 8.1). The type of tree generated depends on the data and objectives; however, published trees should display a scale bar and some method of statistical support. For more detailed information about phylogenetic analyses, we refer to other sources (Hall, 2007; Salemi & Vandamme, 2003).
2.6. Bioinformatic programs
Many of the specialized software packages described above perform one step in the phylogenetic analysis. Alternative packages perform multiple steps and include a user-friendly graphical interface. Free examples include MEGA (Tamura et al., 2011) and Seaview (Gouy et al., 2010), which generate both sequence alignments and phylogenetic trees (Table 8.1). Geneious is a more general bioinformatic software package that includes alignment algorithms and phylogenetic analyses (Drummond et al., 2011); however, it must be purchased. A useful program that allows complete phylogenetic analyses on a Web server is the phylogeny.fr platform (http://www.phylogeny.fr/). This program was developed to produce robust trees even by those with no experience in phylogeny (Dereeper et al., 2008). It also offers useful options for more experienced users and does not require software to be downloaded. However, this program is not applicable for larger datasets, no model testing is available, and bootstrapping is limited to 100 replicates. Nonetheless, the pipeline is perfect to test datasets, generate preliminary trees, and compare different phylogenetic methods.
3. NaPDoS
3.1. Scope of NaDoS
NaPDoS (http://napdos.ucsd.edu/) is a recently released, Web-based bioinformatic tool that uses phylogenetic information to predict the class and, in some cases, structure of the natural products produced by bacterial PKS and NRPS genes. It can detect and extract KS and C domains from DNA and amino acid sequences derived from PCR products, genes, whole or draft genomes, and metagenomic data. NaPDoS classifies these sequences based on the phylogenetic relationships of more than 200 KS and C reference sequences. This Web-tool provides a rapid method to evaluate the biosynthetic richness and novelty of individual bacterial strains, communities, or environments and offers a rational guide to identify known secondary metabolites (dereplicate) and facilitate the discovery of new compounds and mechanistic biochemistry.
3.2. How NaPDoS works
The bioinformatic pipeline employed by NaPDoS includes HMM and BLAST searches and is constructed to be fast and flexible. NaPDoS first detects and excises KS or C domains from the query sequences. In a second step, these sequences are BLASTed against a reference database of experimentally characterized KS and C domains and assigned an initial classification that defines enzyme architecture or biochemical function. The third step generates a profile alignment by incorporating the sequences into a carefully curated reference alignment generated from all known biochemical classes of KS and C domains. This alignment is then used to create a phylogenetic tree, which is manually interpreted to establish a final classification for each sequence. Trimmed and aligned sequences can then be downloaded for subsequent analysis.
The NaPDoS Web site includes a detailed tutorial. A graphical interface indicates where to upload query sequences and a clickable SEEK button to run the analyses. Advanced options for BLAST and HMM search parameters are available, but the default settings should work well for most data. A preliminary output table provides the coordinates for any KS or C domains detected and their top BLAST hits, e-values, and alignment lengths. Information describing the biosynthetic pathways associated with the top BLAST hits is provided for comparative purposes.
It should be emphasized that the initial BLAST-based classifications provided by NaPDoS are preliminary and may not reflect the phylogenetic position of the query sequences, especially in cases where the sequence similarities are low. In general, KS or C domains derived from the same pathway often share ≥90% amino acid sequence identity. In cases where a query sequence shares this level of identity with a reference sequence, it can be predicted that the pathway from which the sequence was derived has a high probability of producing compounds in the same structural class, as has been demonstrated previously (Edlund et al., 2011; Gontang et al., 2010). For domains that share <90% identity to the top NaPDoS match, an NCBI BLAST search is highly recommended as the NaPDoS database is not comprehensive. If the results of this search do not yield a top match that shares ≥90% identity, then it should be anticipated that the pathway has not been experimentally characterized and that the product may be new.
To generate final KS or C domain classifications, they should be inserted into the NaPDoS reference alignment along with select NCBI BLAST matches. The trimmed alignment can then be used by NaPDoS to build a ML tree in which the query sequences are indicated in red, or a Newick file, which can be opened with a user-chosen tree-viewing program. This tree can then be manually interpreted to determine the phylogenetic relationship of the query sequences relative to the NaPDoS classification system. In cases where a query sequence does not clade with any of the reference sequences, it may be associated with a new biochemical mechanism or enzyme architecture. For example, a group of C domains that clades outside of the eight functional types identified in NaPDoS appears to be associated with the condensation and subsequent dehydration of serine to dehydroalanine (Ziemert et al., 2012).
4. CONCLUSIONS AND FUTURE DIRECTIONS
Increased access to DNA sequencing has created a need for new bioinformatic tools that can be used to analyze and interpret the large volumes of sequence data that are now publically available. In the case of natural products research, these tools are increasingly being used to facilitate the discovery process. Phylogenetics provides a platform to generate biosynthetic hypotheses that can facilitate the discovery of new biochemistry, as functional differences are almost always reflected in phylogenetic trees. Tools such as NaPDoS can help provide a logical guide to the identification of organisms or environments that present the greatest potential for natural product discovery. These predictive capabilities will continue to increase as more biosynthetic pathways are characterized. Sequence-based approaches are providing a new paradigm that promises to increase the rate and efficiency with which natural products are discovered and insight into the evolutionary processes that have generated the extraordinary levels of structural diversity observed among secondary metabolites.
ACKNOWLEDGMENTS
We thank Sheila Podell, Eric Allen, and Kevin Penn for their contributions to creating the NaPDoS bioinformatic pipeline. P. R. J. acknowledges financial support from the National Institutes of Health (grant 1R01GM086261-O1). N. Z. acknowledges financial support from the German Research Foundation (DFG 1325/1-1).
REFERENCES
- Abascal F, Zardoya R, Posada D. ProtTest: Selection of best-fit models of protein evolution. Bioinformatics. 2005;21:2104–2105. doi: 10.1093/bioinformatics/bti263. [DOI] [PubMed] [Google Scholar]
- Altschul SF, Madden TL, Schaffer AA, Zhang J, Zhang Z, Miller W, et al. Gapped BLAST and PSI-BLAST: A new generation of protein database search programs. Nucleic Acids Research. 1997;25:3389–3402. doi: 10.1093/nar/25.17.3389. [DOI] [PMC free article] [PubMed] [Google Scholar]
- Bachmann BO, Ravel J. Methods for in silico prediction of microbial polyketide and nonribosomal peptide biosynthetic pathways from DNA sequence data. Methods in Enzymology. 2009;458:181–217. doi: 10.1016/S0076-6879(09)04808-3. chap. 8. [DOI] [PubMed] [Google Scholar]
- Bonitz T, Alva V, Saleh O, Lupas AN, Heide L. Evolutionary relationships of microbial aromatic prenyltransferases. PLoS One. 2011;6:e27336. doi: 10.1371/journal.pone.0027336. [DOI] [PMC free article] [PubMed] [Google Scholar]
- Bretschneider T, Zocher G, Unger M, Scherlach K, Stehle T, Hertweck C. A ketosynthase homolog uses malonyl units to form esters in cervimycin biosynthesis. Nature Chemical Biology. 2011;8:154–161. doi: 10.1038/nchembio.746. [DOI] [PubMed] [Google Scholar]
- Bushley KE, Turgeon BG. Phylogenomics reveals subfamilies of fungal nonribosomal peptide synthetases and their evolutionary relationships. BMC Evolutionary Biology. 2010;10:26. doi: 10.1186/1471-2148-10-26. [DOI] [PMC free article] [PubMed] [Google Scholar]
- Challis GL, Ravel J, Townsend CA. Predictive, structure-based model of amino acid recognition by nonribosomal peptide synthetase adenylation domains. Chemical Biology. 2000;7:211–224. doi: 10.1016/s1074-5521(00)00091-0. [DOI] [PubMed] [Google Scholar]
- Cramer RA, Jr., Stajich JE, Yamanaka Y, Dietrich FS, Steinbach WJ, Perfect JR. Phylogenomic analysis of non-ribosomal peptide synthetases in the genus Aspergillus. Gene. 2006;383:24–32. doi: 10.1016/j.gene.2006.07.008. [DOI] [PubMed] [Google Scholar]
- Dereeper A, Guignon V, Blanc G, Audic S, Buffet S, Chevenet F, et al. Phylogeny.fr: Robust phylogenetic analysis for the non-specialist. Nucleic Acids Research. 2008;36:W465–W469. doi: 10.1093/nar/gkn180. [DOI] [PMC free article] [PubMed] [Google Scholar]
- Dirix G, Monsieurs P, Dombrecht B, Daniels R, Marchal K, Vanderleyden J, et al. Peptide signal molecules and bacteriocins in Gram-negative bacteria: A genome-wide in silico screening for peptides containing a double-glycine leader sequence and their cognate transporters. Peptides. 2004;25:1425–1440. doi: 10.1016/j.peptides.2003.10.028. [DOI] [PubMed] [Google Scholar]
- Donia MS, Schmidt EW. Linking chemistry and genetics in the growing cyanobactin natural products family. Chemical Biology. 2011;18:508–519. doi: 10.1016/j.chembiol.2011.01.019. [DOI] [PMC free article] [PubMed] [Google Scholar]
- Drummond A, Ashton B, Buxton S, Cheung M, Cooper A, Duran C, et al. Geneious v5.4. 2011 http://www.geneious.com/
- Edgar RC. MUSCLE: A multiple sequence alignment method with reduced time and space complexity. BMC Bioinformatics. 2004;5:113. doi: 10.1186/1471-2105-5-113. [DOI] [PMC free article] [PubMed] [Google Scholar]
- Edlund A, Loesgen S, Fenical W, Jensen PR. Geographic distribution of secondary metabolite genes in the marine actinomycete Salinispora arenicola. Applied and Environmental Microbiology. 2011;77:5916–5925. doi: 10.1128/AEM.00611-11. [DOI] [PMC free article] [PubMed] [Google Scholar]
- Eisen JA. Phylogenomics: Improving functional predictions for uncharacterized genes by evolutionary analysis. Genome Research. 1998;8:163–167. doi: 10.1101/gr.8.3.163. [DOI] [PubMed] [Google Scholar]
- Eisen JA, Fraser CM. Phylogenomics: Intersection of evolution and genomics. Science. 2003;300:1706–1707. doi: 10.1126/science.1086292. [DOI] [PubMed] [Google Scholar]
- Engene N, Choi H, Esquenazi E, Byrum T, Villa FA, Cao Z, et al. Phylogeny-guided isolation of ethyl tumonoate A from the marine cyanobacterium cf. Oscillatoria margaritifera. Journal of Natural Products. 2011;74:1737–1743. doi: 10.1021/np200236c. [DOI] [PMC free article] [PubMed] [Google Scholar]
- Felsenstein J. PHYLIP (Phylogeny Inference Package) version 3.6. Department of Genome Sciences, University of Washington Distributed by the author; Seattle: 2005. [Google Scholar]
- Fewer DP, Rouhiainen L, Jokela J, Wahlsten M, Laakso K, Wang H, et al. Recurrent adenylation domain replacement in the microcystin synthetase gene cluster. BMC Evolutionary Biology. 2007;7:183. doi: 10.1186/1471-2148-7-183. [DOI] [PMC free article] [PubMed] [Google Scholar]
- Finn RD, Clements J, Eddy SR. HMMER web server: Interactive sequence similarity searching. Nucleic Acids Research. 2011;39:W29–W37. doi: 10.1093/nar/gkr367. [DOI] [PMC free article] [PubMed] [Google Scholar]
- Fischbach MA, Walsh CT. Assembly-line enzymology for polyketide and nonribosomal Peptide antibiotics: Logic, machinery, and mechanisms. Chemical Reviews. 2006;106:3468–3496. doi: 10.1021/cr0503097. [DOI] [PubMed] [Google Scholar]
- Foerstner KU, Doerks T, Creevey CJ, Doerks A, Bork P. A computational screen for type I polyketide synthases in metagenomics shotgun data. PLoS One. 2008;3:e3515. doi: 10.1371/journal.pone.0003515. [DOI] [PMC free article] [PubMed] [Google Scholar]
- Freel KC, Nam SJ, Fenical W, Jensen PR. Evolution of secondary metabolite genes in three closely related marine actinomycete species. Applied and Environmental Microbiology. 2011;77:7261–7270. doi: 10.1128/AEM.05943-11. [DOI] [PMC free article] [PubMed] [Google Scholar]
- Gascuel O. BIONJ: An improved version of the NJ algorithm based on a simple model of sequence data. Molecular Biology and Evolution. 1997;14:685–695. doi: 10.1093/oxfordjournals.molbev.a025808. [DOI] [PubMed] [Google Scholar]
- Gontang EA, Gaudencio SP, Fenical W, Jensen PR. Sequence-based analysis of secondary-metabolite biosynthesis in marine actinobacteria. Applied and Environmental Microbiology. 2010;76:2487–2499. doi: 10.1128/AEM.02852-09. [DOI] [PMC free article] [PubMed] [Google Scholar]
- Gouy M, Guindon S, Gascuel O. SeaView version 4: A multiplatform graphical user interface for sequence alignment and phylogenetic tree building. Molecular Biology and Evolution. 2010;27:221–224. doi: 10.1093/molbev/msp259. [DOI] [PubMed] [Google Scholar]
- Guindon S, Gascuel O. A simple, fast, and accurate algorithm to estimate large phylogenies by maximum likelihood. Systematic Biology. 2003;52:696–704. doi: 10.1080/10635150390235520. [DOI] [PubMed] [Google Scholar]
- Hall B. Phylogenetic trees made easy: A how-to manual. 3rd ed Sinuaer Associates; Sunderland, MA: 2007. [Google Scholar]
- Heide L. Prenyl transfer to aromatic substrates: Genetics and enzymology. Current Opinion in Chemical Biology. 2009;13:171–179. doi: 10.1016/j.cbpa.2009.02.020. [DOI] [PubMed] [Google Scholar]
- Hertweck C. The biosynthetic logic of polyketide diversity. Angewandte Chemie (International Ed. in English) 2009;48:4688–4716. doi: 10.1002/anie.200806121. [DOI] [PubMed] [Google Scholar]
- Huelsenbeck JP, Ronquist F. MRBAYES: Bayesian inference of phylogenetic trees. Bioinformatics. 2001;17:754–755. doi: 10.1093/bioinformatics/17.8.754. [DOI] [PubMed] [Google Scholar]
- Jack RW, Jung G. Lantibiotics and microcins: Polypeptides with unusual chemical diversity. Current Opinion in Chemical Biology. 2000;4:310–317. doi: 10.1016/s1367-5931(00)00094-6. [DOI] [PubMed] [Google Scholar]
- Jenke-Kodama H, Börner T, Dittmann E. Natural biocombinatorics in the polyketide synthase genes of the actinobacterium Streptomyces avermitilis. PLoS Computational Biology. 2006;2:e132. doi: 10.1371/journal.pcbi.0020132. [DOI] [PMC free article] [PubMed] [Google Scholar]
- Jenke-Kodama H, Dittmann E. Combinatorial polyketide biosynthesis at higher stage. Molecular Systems Biology. 2005;1:0025. doi: 10.1038/msb4100033. 2005. [DOI] [PMC free article] [PubMed] [Google Scholar]
- Jenke-Kodama H, Sandmann A, Muller R, Dittmann E. Evolutionary implications of bacterial polyketide synthases. Molecular Biology and Evolution. 2005;22:2027–2039. doi: 10.1093/molbev/msi193. [DOI] [PubMed] [Google Scholar]
- Jensen PR. Linking species concepts to natural product discovery in the postgenomic era. Journal of Industrial Microbiology and Biotechnology. 2010;37:219–224. doi: 10.1007/s10295-009-0683-z. [DOI] [PMC free article] [PubMed] [Google Scholar]
- Kellmann R, Stuken A, Orr RJ, Svendsen HM, Jakobsen KS. Biosynthesis and molecular genetics of polyketides in marine dinoflagellates. Marine Drugs. 2010;8:1011–1048. doi: 10.3390/md8041011. [DOI] [PMC free article] [PubMed] [Google Scholar]
- Kroken S, Glass NL, Taylor JW, Yoder OC, Turgeon BG. Phylogenomic analysis of type I polyketide synthase genes in pathogenic and saprobic ascomycetes. Proceedings of the National Academy of Sciences of the United States of America. 2003;100:15670–15675. doi: 10.1073/pnas.2532165100. [DOI] [PMC free article] [PubMed] [Google Scholar]
- Ladunga I. Finding homologs to nucleotide sequences using network BLAST searches. Current Protocols in Bioinformatics. 2002;26:3.3.1–3.3.26. doi: 10.1002/0471250953.bi0303s00. [DOI] [PubMed] [Google Scholar]
- Larget B, Simon DL. Markov chain Monte Carlo algorithms for the Bayesian analysis of phylogenetic trees. Molecular Biology and Evolution. 1999;16:750–759. [Google Scholar]
- Larsen TO, Smedsgaard J, Nielsen KF, Hansen ME, Frisvad JC. Phenotypic taxonomy and metabolite profiling in microbial drug discovery. Natural Product Reports. 2005;22:672–695. doi: 10.1039/b404943h. [DOI] [PubMed] [Google Scholar]
- Leikoski N, Fewer DP, Sivonen K. Widespread occurrence and lateral transfer of the cyanobactin biosynthesis gene cluster in cyanobacteria. Applied and Environmental Microbiology. 2009;75:853–857. doi: 10.1128/AEM.02134-08. [DOI] [PMC free article] [PubMed] [Google Scholar]
- Li MH, Ung PM, Zajkowski J, Garneau-Tsodikova S, Sherman DH. Automated genome mining for natural products. BMC Bioinformatics. 2009;10:185. doi: 10.1186/1471-2105-10-185. [DOI] [PMC free article] [PubMed] [Google Scholar]
- Liu W, Ahlert J, Gao Q, Wendt-Pienkowski E, Shen B, Thorson JS. Rapid PCR amplification of minimal enediyne polyketide synthase cassettes leads to a predictive familial classification model. Proceedings of the National Academy of Sciences of the United States of America. 2003;100:11959–11963. doi: 10.1073/pnas.2034291100. [DOI] [PMC free article] [PubMed] [Google Scholar]
- Maddison WP, Maddison DR. Mesquite: A modular system for evolutionary analysis. Version 2.71. 2009 http://mesquiteproject.org. 18 March 2012.
- Mak HC. Trends in computational biology-2010. Nature Biotechnology. 2010;29:45–49. doi: 10.1038/nbt.1747. [DOI] [PubMed] [Google Scholar]
- Marahiel MA, Stachelhaus T, Mootz HD. Modular peptide synthetases involved in nonribosomal peptide synthesis. Chemical Reviews. 1997;97:2651–2674. doi: 10.1021/cr960029e. [DOI] [PubMed] [Google Scholar]
- Medema MH, Blin K, Cimermancic P, de Jager V, Zakrzewski P, Fischbach MA, et al. antiSMASH: Rapid identification, annotation and analysis of secondary metabolite biosynthesis gene clusters in bacterial and fungal genome sequences. Nucleic Acids Research. 2011;39:W339–W346. doi: 10.1093/nar/gkr466. [DOI] [PMC free article] [PubMed] [Google Scholar]
- Metsa-Ketela M, Halo L, Munukka E, Hakala J, Mantsala P, Ylihonko K. Molecular evolution of aromatic polyketides and comparative sequence analysis of polyketide ketosynthase and 16S ribosomal DNA genes from various streptomyces species. Applied and Environmental Microbiology. 2002;68:4472–4479. doi: 10.1128/AEM.68.9.4472-4479.2002. [DOI] [PMC free article] [PubMed] [Google Scholar]
- Metsa-Ketela M, Salo V, Halo L, Hautala A, Hakala J, Mantsala P, et al. An efficient approach for screening minimal PKS genes from Streptomyces. FEMS Microbiology Letters. 1999;180:1–6. doi: 10.1111/j.1574-6968.1999.tb08770.x. [DOI] [PubMed] [Google Scholar]
- Michiels J, Dirix G, Vanderleyden J, Xi C. Processing and export of peptide pheromones and bacteriocins in Gram-negative bacteria. Trends in Microbiology. 2001;9:164–168. doi: 10.1016/s0966-842x(01)01979-5. [DOI] [PubMed] [Google Scholar]
- Moffitt MC, Neilan BA. Evolutionary affiliations within the superfamily of ketosynthases reflect complex pathway associations. Journal of Molecular Evolution. 2003;56:446–457. doi: 10.1007/s00239-002-2415-0. [DOI] [PubMed] [Google Scholar]
- Moore BS, Hertweck C, Hopke JN, Izumikawa M, Kalaitzis JA, Nilsen G, et al. Plant-like biosynthetic pathways in bacteria: From benzoic acid to chalcone. Journal of Natural Products. 2002;65:1956–1962. doi: 10.1021/np020230m. [DOI] [PubMed] [Google Scholar]
- Moore BS, Hopke JN. Discovery of a new bacterial polyketide biosynthetic pathway. ChembioChem. 2001;2:35–38. doi: 10.1002/1439-7633(20010105)2:1<35::AID-CBIC35>3.0.CO;2-1. [DOI] [PubMed] [Google Scholar]
- Morgenstern B, Goel S, Sczyrba A, Dress A. AltAVisT: Comparing alternative multiple sequence alignments. Bioinformatics. 2003;19:425–426. doi: 10.1093/bioinformatics/btf882. [DOI] [PubMed] [Google Scholar]
- Nguyen T, Ishida K, Jenke-Kodama H, Dittmann E, Gurgui C, Hochmuth T, et al. Exploiting the mosaic structure of trans-acyltransferase polyketide synthases for natural product discovery and pathway dissection. Nature Biotechnology. 2008;26:225–233. doi: 10.1038/nbt1379. [DOI] [PubMed] [Google Scholar]
- Ochman H, Lerat E, Daubin V. Examining bacterial species under the specter of gene transfer and exchange. Proceedings of the National Academy of Sciences of the United States of America. 2005;102(Suppl 1):6595–6599. doi: 10.1073/pnas.0502035102. [DOI] [PMC free article] [PubMed] [Google Scholar]
- O'Malley MA, Koonin EV. How stands the Tree of Life a century and a half after The Origin? Biology Direct. 2011;6:32. doi: 10.1186/1745-6150-6-32. [DOI] [PMC free article] [PubMed] [Google Scholar]
- Posada D. jModelTest: Phylogenetic model averaging. Molecular Biology and Evolution. 2008;25:1253–1256. doi: 10.1093/molbev/msn083. [DOI] [PubMed] [Google Scholar]
- Rausch C, Hoof I, Weber T, Wohlleben W, Huson DH. Phylogenetic analysis of condensation domains in NRPS sheds light on their functional evolution. BMC Evolutionary Biology. 2007;7:78. doi: 10.1186/1471-2148-7-78. [DOI] [PMC free article] [PubMed] [Google Scholar]
- Ridley CP, Lee HY, Khosla C. Evolution of polyketide synthases in bacteria. Proceedings of the National Academy of Sciences of the United States of America. 2008;105:4595–4600. doi: 10.1073/pnas.0710107105. [DOI] [PMC free article] [PubMed] [Google Scholar]
- Riley MA, Wertz JE. Bacteriocins: Evolution, ecology, and application. Annual Review of Microbiology. 2002;56:117–137. doi: 10.1146/annurev.micro.56.012302.161024. [DOI] [PubMed] [Google Scholar]
- Saitou N, Nei M. The neighbor-joining method: a new method for reconstructing phylogenetic trees. Molecular Biology and Evolution. 1987;4:406–425. doi: 10.1093/oxfordjournals.molbev.a040454. [DOI] [PubMed] [Google Scholar]
- Salemi M, Vandamme A-M. The phylogenetic handbook: A practical approach to DNA and protein phylogeny. Sinuaer Associates; Cambridge University Press; Sunderland, MA: 2003. [Google Scholar]
- Schmidt EW, Nelson JT, Rasko DA, Sudek S, Eisen JA, Haygood MG, et al. Patellamide A and C biosynthesis by a microcin-like pathway in Prochloron didemni, the cyanobacterial symbiont of Lissoclinum patella. Proceedings of the National Academy of Sciences of the United States of America. 2005;102:7315–7320. doi: 10.1073/pnas.0501424102. [DOI] [PMC free article] [PubMed] [Google Scholar]
- Schmidt HA, Strimmer K, Vingron M, von Haeseler A. TREE-PUZZLE: Maximum likelihood phylogenetic analysis using quartets and parallel computing. Bioinformatics. 2002;18:502–504. doi: 10.1093/bioinformatics/18.3.502. [DOI] [PubMed] [Google Scholar]
- Schmitt I, Barker FK. Phylogenetic methods in natural product research. Natural Product Reports. 2009;26:1585–1602. doi: 10.1039/b910458p. [DOI] [PubMed] [Google Scholar]
- Shen B. Polyketide biosynthesis beyond the type I, II and III polyketide synthase paradigms. Current Opinion in Chemical Biology. 2003;7:285–295. doi: 10.1016/s1367-5931(03)00020-6. [DOI] [PubMed] [Google Scholar]
- Soding J, Biegert A, Lupas AN. The HHpred interactive server for protein homology detection and structure prediction. Nucleic Acids Research. 2005;33:W244–W248. doi: 10.1093/nar/gki408. [DOI] [PMC free article] [PubMed] [Google Scholar]
- Stachelhaus T, Mootz HD, Marahiel MA. The specificity-conferring code of adenylation domains in nonribosomal peptide synthetases. Chemical Biology. 1999;6:493–505. doi: 10.1016/S1074-5521(99)80082-9. [DOI] [PubMed] [Google Scholar]
- Sudek S, Haygood MG, Youssef DT, Schmidt EW. Structure of trichamide, a cyclic peptide from the bloom-forming cyanobacterium Trichodesmium erythraeum, predicted from the genome sequence. Applied and Environmental Microbiology. 2006;72:4382–4387. doi: 10.1128/AEM.00380-06. [DOI] [PMC free article] [PubMed] [Google Scholar]
- Talavera G, Castresana J. Improvement of phylogenies after removing divergent and ambiguously aligned blocks from protein sequence alignments. Systematic Biology. 2007;56:564–577. doi: 10.1080/10635150701472164. [DOI] [PubMed] [Google Scholar]
- Tamura K, Peterson D, Peterson N, Stecher G, Nei M, Kumar S. MEGA5: Molecular evolutionary genetics analysis using maximum likelihood, evolutionary distance, and maximum parsimony methods. Molecular Biology and Evolution. 2011;28:2731–2739. doi: 10.1093/molbev/msr121. [DOI] [PMC free article] [PubMed] [Google Scholar]
- Thompson JD, Gibson TJ, Plewniak F, Jeanmougin F, Higgins DG. The CLUSTAL_X windows interface: Flexible strategies for multiple sequence alignment aided by quality analysis tools. Nucleic Acids Research. 1997;25:4876–4882. doi: 10.1093/nar/25.24.4876. [DOI] [PMC free article] [PubMed] [Google Scholar]
- Wawrik B, Kutliev D, Abdivasievna UA, Kukor JJ, Zylstra GJ, Kerkhof L. Biogeography of actinomycete communities and type II polyketide synthase genes in soils collected in New Jersey and Central Asia. Applied and Environmental Microbiology. 2007;73:2982–2989. doi: 10.1128/AEM.02611-06. [DOI] [PMC free article] [PubMed] [Google Scholar]
- Woese CR. Bacterial evolution. Microbiological Reviews. 1987;51:221–271. doi: 10.1128/mr.51.2.221-271.1987. [DOI] [PMC free article] [PubMed] [Google Scholar]
- Xu Z, Schenk A, Hertweck C. Molecular analysis of the benastatin biosynthetic pathway and genetic engineering of altered fatty acid-polyketide hybrids. Journal of the American Chemical Society. 2007;129:6022–6030. doi: 10.1021/ja069045b. [DOI] [PubMed] [Google Scholar]
- Yadav G, Gokhale RS, Mohanty D. Towards prediction of metabolic products of polyketide synthases: An in silico analysis. PLoS Computational Biology. 2009;5:e1000351. doi: 10.1371/journal.pcbi.1000351. [DOI] [PMC free article] [PubMed] [Google Scholar]
- Ziemert N, Ishida K, Quillardet P, Bouchier C, Hertweck C, de Marsac NT. Microcyclamide biosynthesis in two strains of Microcystis aeruginosa: From structure to genes and vice versa. Applied and Environmental Microbiology. 2008;74:1791–1797. doi: 10.1128/AEM.02392-07. [DOI] [PMC free article] [PubMed] [Google Scholar]
- Ziemert N, Podell S, Penn K, Badger JH, Allen EE, Jensen PR. The natural product domain seeker NaPDoS: A phylogeny based bioinformatic tool to classify secondary metabolite gene diversity. PLoS One. 2012;7(3):e34064. doi: 10.1371/journal.pone.0034064. [DOI] [PMC free article] [PubMed] [Google Scholar]