Abstract
The role of the recruitment-derecruitment of small structures in the lung (lung units) as the lung increases and decreases in volume has been debated. The objective of this study was to develop a model to estimate the change in the number and volume of open lung units as an excised lung is inflated-deflated between minimum and maximum lung volume. The model was formulated based on the observation that the compliance of the slowly changing quasi-static pressure-volume (P-V) curve of an excised rat lung can differ from the compliance of a faster changing small sinusoidal pressure volume perturbations superimposed on the curve. In those regions of the curve where differences in compliance occur, the lung tissue properties exhibit nonlinear characteristics, which cannot be linearized using “incremental” or “small signal” analysis. The model attributes the differences between the perturbation and quasi-static compliance to an additional nonlinear compliance term that results from the sequential opening and closing of lung units. Using this approach, it was possible to calculate the normalized average volume and the normalized number of open units as the lung is slowly inflated-deflated. Results indicate that the normalized average volume and the normalized number of open units are not linearly related to normalized lung volume, and at equal lung volumes the normalized number of open units is greater and the normalized average lung unit volume is smaller during lung deflation when compared to lung inflation. In summary, a model was developed to describe the recruitment-derecruitment process in excised lungs based on the differences between small signal perturbation compliance and quasi-static compliance. Values of normalized lung unit volume and the normalized number of open lung units were shown to be nonlinear functions of both transpulmonary pressure and normalized lung volume.
Keywords: lung mechanics, models, pressure-volume loops
Introduction
The pressure-volume (PL-VL) curve of an excised lung inflated-deflated between minimum lung volume and total lung capacity (TLC) is characterized by a nonlinear relationship and is typified by a large hysteretic area indicating an irreversible energy loss. It is interesting to note that the material properties of the lung exhibit nonlinear characteristics, which cannot be linearized using an incremental, or small signal analysis. This results because of the rather large differences between the compliance of small volume perturbations and the quasi-static compliance in some areas along the quasi-static (PL-VL) relationship. A possible explanation of this unusual mechanical behavior of excised lungs is associated with an irreversible behavior linked to structural alterations in the lung tissue. In the past, investigators have reported changes in the configuration of lung structures at both the micro and macro level as a lung was inflated-deflated. One way to describe the sequential nature of these processes and their significance in explaining the lung’s mechanical properties is with models [1–10]. The models are very useful when comparing the compatibility of experimental evidence with theoretical predictions.
It has been postulated that the compliance of a quasi-static PL-VL curve, recorded between maximum and minimum volume, results from a combination of the expansion/contraction and the recruitment-derecruitment of lung units. There is evidence that the quasi-static curve can be divided into three different regions as illustrated in Fig. 1: (1) an “open” region where minimal recruitment-derecruitment of lung units occurs, (2) an “opening” region where lung units are recruited, and (3) a “closing” region where lung units are derecruited. It is understood that open lung units are capable of changing volume in all three regions [4]. Since the open region lies between the opening and closing regions, it is also assumed that a single small volume perturbation would not be capable of creating a large enough change in transpulmonary pressure to produce both opening and closing of lung units.
Fig. 1.
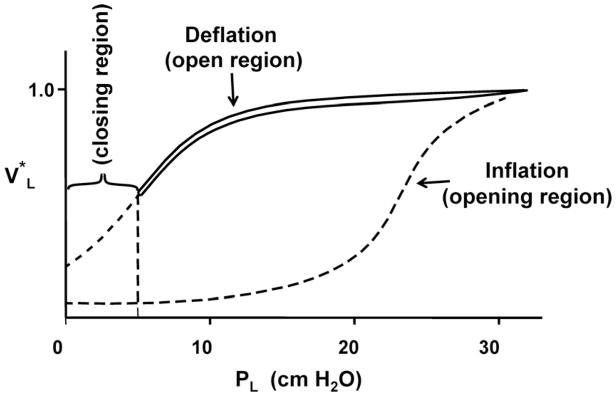
Quasi-static pressure-volume curve of an excised lung recorded between 0.0 and 30 cm H2O. The opening, open, and closing regions of the curve are indicated. The solid curve represents the curve for open lung units. When the end-expiratory pressure falls below the ‘closing’ pressure, lung units begin to close. To reopen a closed unit, pulmonary pressure must rise to the ‘opening’ pressure of that lung unit.
Experimental evidence supporting the supposition that there is minimal opening and closing of lung units in the open region of the PL-VL curve includes: (1) there are minimal changes in gas trapping when end-expiratory pressures are confined to the open zone [11,12]; (2) discontinuous lung sounds are not normally detected when PL-VL loops are recorded in the open zone [3,13]; (3) parameters of the constant phase model including G, H, and η, which are derived from the dynamic compliance (Edyn) and viscous stress of lung tissue (Rtis) appear to be constant for PL-VL loops in the open zone [14,15]; and (4) measurements of normalized hysteresis (K) of all PL-VL loops recorded in the open zone have consistent values [2,16–18]. On the other hand, a displacement in PL and VL that causes that relationship to leave the open zone and enter either the opening or closing zones where lung unit recruitment-derecruitment takes place can have a considerable effect on the lung’s mechanical behavior [2,4,19].
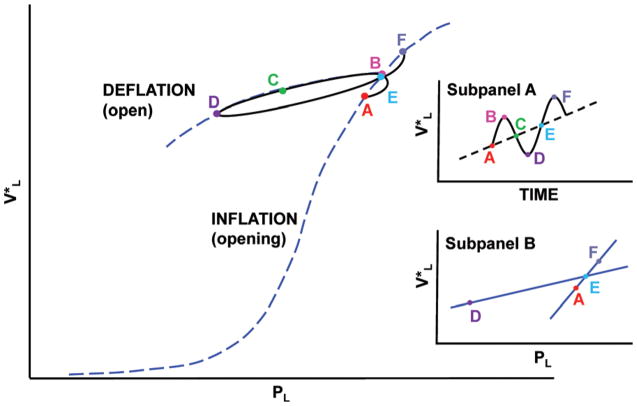
One method that can be used to show the sequential nature of the mechanical events that occur in an excised lung as it is inflated-deflated between −5 and +30 cm H2O is to superimpose a more rapid small volume perturbation on a slow constant ventilation rate. It can be seen (Fig. 2) that the compliance of a small loop, represented by the straight line (DE) that is generated by a volume perturbation is very different from the compliance of the quasi-static PL-VL curve (AEF) as the lung is inflated. This study attributes this type of a material nonlinearity to discrete structural changes in the lung’s material properties during lung inflation, which corresponds with the reopening of lung units [3,5]. Similar differences between loop and quasi-static compliance can also be observed during lung deflation at low lung volumes.
Fig. 2.
An example of a small volume perturbation superimposed on a quasi-static PL-VL curve of an excised rat lung during lung inflation. Note the difference between perturbation loop compliance (DE) and quasi-static compliance (AEF) in this region of the curve (further illustrated in Subpanel B). The recorded (points A–B) results from the opening of lung units during lung inflation, and then the contraction and re-expansion of lung units as pressure and volume decrease then increase forming a PL-VL loop (points B-C-D-E). Points (E–F) represent the opening of additional lung units during the following volume perturbation. The volume versus time signal is illustrated in Subpanel A.
The objective of this study was to develop a comprehensive model of the recruitment-derecruitment of lung units during a complete inflation-deflation cycle. Portions of that representative model are based on previous work, which assumed that VL represents the total volume of gas in the lung and φ symbolizes the fraction of total gas volume occupied by open lung units [5]. It was presumed that the number of open lung units at a given lung volume is equal to NO and all open lung units have approximately the same volume (VU), then
| (1) |
The differential equations derived from the fundamental relationship in Eq. (1) were used to calculate both NO and VU as a function of transpulmonary pressure while the lung was inflated-deflated between −5 and +30 cm H2O.
Methods
Theoretical Analysis of PL-VL Curves
The model described in this study presumes that the lung is comprised of individual lung units, which can be in either an open or closed state. The units that are closed do not contribute to VL and the open lung units occupy a fraction Φ of VL. It is assumed that the number of the open lung units is equal to NO, so that ΦVL = NO VU, where both NO and VU are variables. According to this model, the relationship between lung compliance, lung unit compliance, and the number of open lung units can be found by differentiating VL with respect to PL:
| (2) |
Here, dΦVL/dPL is equal to total lung compliance, dVU/dPL represents the average compliance of a single open unit, and NOdVU/dPL stands for the combined compliance of all the open units. The remaining VUdNO/dPL term represents the component of compliance that results from the change in number of open lung units. If NO is constant during a small volume perturbation caused by a small decrease-increase in lung volume, then the NOdVU/dPL term in Eq. (2) is proportional to the compliance of the open lung units, and the VUdNO/dPL term is equal to zero.
If Φ remains nearly constant and NO and VU are also normalized with respect to their maximum values at TLC, Eq. (2) becomes
| (3) |
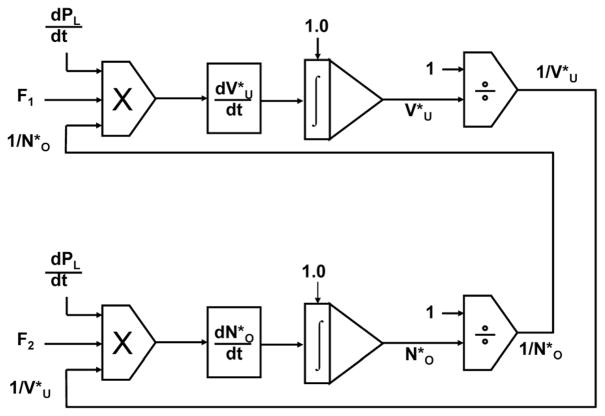
The symbol (*) represents a variable normalized with respect to its maximum value at PLmax. Now, consider once again a small volume perturbation superimposed on a slow, quasi-static, inflation-deflation rate during lung inflation, as illustrated in Fig. 2. Each perturbation formed a closed PL-VL loop and a small increase-decrease in lung volume. It can be seen that when the lung was inflated, the quasi-static compliance, , was approximately equal to along the opening curve. In the open region, values of could be estimated by the slope of the major axis of the approximately elliptical PL-VL loops ( ). A similar analysis was performed during lung deflation as the perturbation pressure and volume alternately entered the closing and open zones. Using these measurements, both and were calculated by rearranging Eq. (3). They were computed as a function of PL and during both lung inflation and deflation by solving the differential equations using SIMULINK (Math-Works, Inc., Natick, MA). The method is represented by the block diagram in Fig. 3. The solutions for both inflation and deflation began at TLC where the initial values of and were assumed to be equal to 1.
Fig. 3.
A block diagram of a method using SIMULINK (Math-Works, Inc., Natick, MA) to calculate both the normalized volume of a lung unit and the normalized number of open lung units as the lung was inflated-deflated between transpulmonary pressures of 0.0 and 30 cm H2O. F1 represented the compliance of a PL-VL loop as a function of PL, ( ), and F2 represented the difference between the normalized compliance of the of the quasi-static PL-VL curve and the loop compliance as a function of . dPL/dt was the rate at which transpulmonary pressure changed with respect to time as the curve was recorded.
Animals
Specific pathogen-free Sprague–Dawley rats from Hilltop Lab Animals (Scottdale, PA), weighing between 325 and 350 g, were used in these experiments. The rats were kept in filtered ventilated cages on Alpha-dri virgin cellulose chips and hardwood Beta-chips as bedding and were provided with HEPA-filtered air, autoclaved Prolab 3500 diet, and tap water ad libitum. The light cycle was controlled (12 h light/12 h darkness) and temperature was kept between 22 and 24 °C. The animal facilities are AAALAC-accredited, specific pathogen-free, and environmentally controlled. Rats were acclimated for at least 2 weeks prior to each experiment. All animal protocols were approved by the NIOSH Animal Care and Use Committee.
Isolation of Excised Lungs
Animals were anesthetized with an intraperitoneal injection of sodium pentobarbital (0.2 g/Kg body weight). Then, the lungs were endotracheally intubated, the abdominal cavity was opened, and the animals were sacrificed by exsanguinations via the abdominal aorta. Next, a bilateral pneumothorax was obtained by penetrating the sternal area of the diaphragm. The rib cage was sectioned on both sides of the midline, and the heart, lungs, and diaphragm were removed en bloc. The excised lungs were rinsed in saline and degassed in a vacuum chamber at the vapor pressure of water using the method of Stengel et al. [20]. The lungs were then suspended by the trachea in a plethysmograph.
The System for Recording PL-VL curves of Excised Rat Lungs
The system for recording PL-VL curves is illustrated in Fig. 4. Lungs were suspended in a cylindrical acrylic air-filled plethysmograph having a removable top. They were inflated-deflated with a computer controlled syringe pump (K-D Scientific, model 210) capable of performing specified ventilation patterns. Transpulmonary pressure was measured with a capacitance type transducer (Setra, model 239 E), and volume was measured with a minispirometer (Med. Sci., model 118). Pressure and volume signals were digitized at 500 Hz (National Instruments, DAQpad 1200) and processed using a custom program written in LabVIEW (National Instruments, Austin, TX).
Fig. 4.
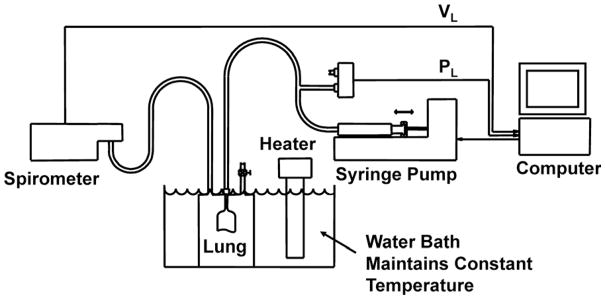
Diagram of the system used to record quasi-static PL-VL curves of excised rat lungs with small volume perturbations superimposed on the curve. Lung volume perturbations were performed with a computer controlled syringe pump.
Lung Ventilation Patterns
One set of PL-VL curves was recorded as degassed lungs were slowly inflated at a rate of 5 ml min−1 to +30 cm H2O, then, deflated to −5 cm H2O. Lung volume at +30 cm H2O was assumed to be equal to total lung capacity. During the second inflation-deflation cycle, the lungs were re-inflated at the same rate to +30 cm H2O. The lungs were then deflated and inflated with a volume perturbation superimposed on the quasi-static curve. Figure 5 shows the ventilation pattern of two volume perturbations during lung inflation as a function of time. The perturbations formed small pressure-volume loops plus an incremental increase/decrease in lung volume as illustrated in Fig. 2.
Fig. 5.
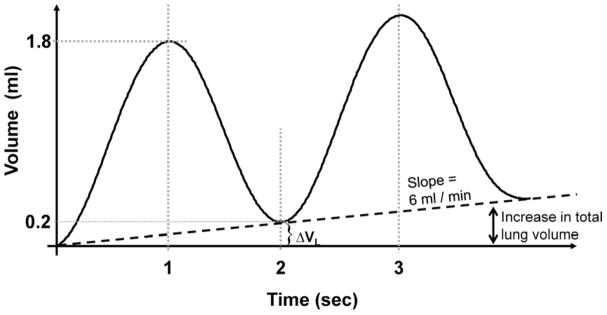
The ventilation pattern of the lung as volume perturbations were superimposed on a slow quasi-static inflation rate generated by a digitally controlled syringe pump during lung inflation.
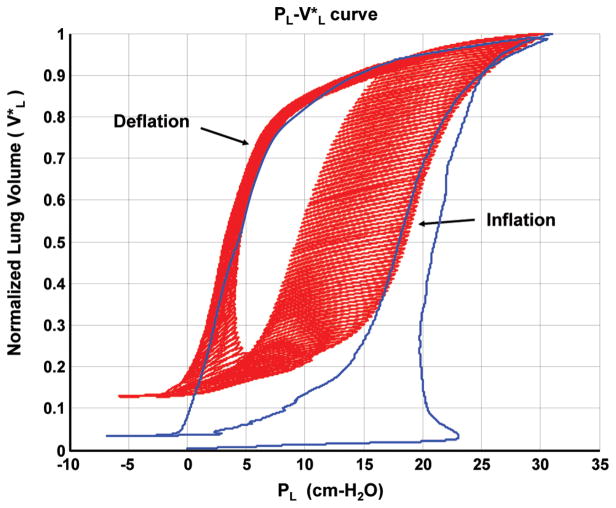
Lungs were inflated-deflated and PL-VL curves were recorded for excised lungs of 3 animals. Two sets of PL-VL curves were generated for each lung. A typical set of PL-VL curves are shown in Fig. 6. Lung volume was normalized with respect to total lung capacity, which was defined as the volume of the lung at a transpulmonary pressure of 30 cm H2O.
Fig. 6.
A typical PL-VL relationship showing small deflation/inflation volume perturbations superimposed on a quasi-static curve of an excised rat lung.
Results
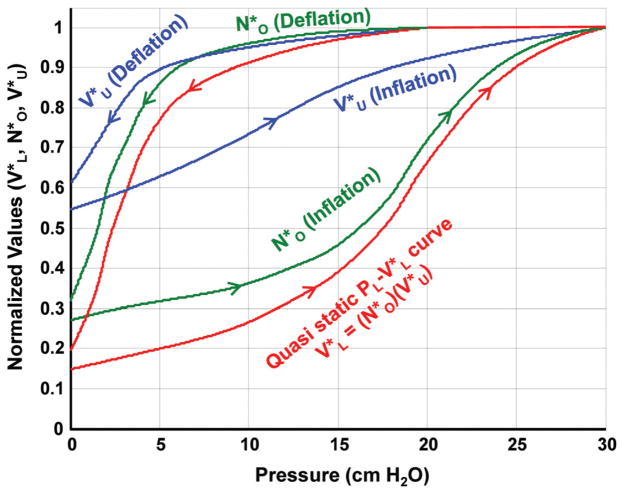
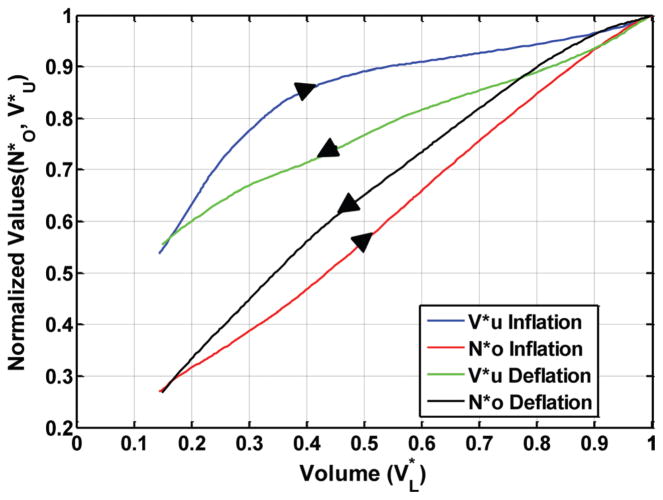
Deflation-inflation loops were recorded as volume perturbations were superimposed on a quasi-static PL-VL curve of excised rat lungs that were slowly deflated and inflated between +30 and −5 cm H2O. The normalized compliance of the quasi-static PL-VL curve and the normalized chord compliance of each loop were determined. Figure 7 shows an example of calculated values of and superimposed on the quasi-static curve of an excised rat lung. It can be seen that on the second deflation cycle to −5 cm H2O, when the volume perturbations were added, approximately 95% of the lung units remained open above a transpulmonary pressure of +10 cm H2O, and nearly 60% had closed between +10 and 0.0 cm H2O. After the lung was deflated, approximately 28% of the lung units remained open or filled with trapped gas. As the lung was re-inflated, about 12% of the lung units had re-opened at a transpulmonary pressure of 12.5 cm H2O. The remaining 60% of the lung units opened between 12.5 and 30 cm H2O. The most rapid change in the number of open lung units occurred between 15 and 20 cm H2O. Figure 8 shows and plotted as a function of . It can be seen that a nonlinear relationship exists between both and with respect to , and both the and relationships show a moderate amount of hysteresis.
Fig. 7.
An example of the calculated values of normalized lung unit volume ( ) and the normalized number of open lung units ( ) plotted as a function of transpulmonary pressure. The quasi-static curve is also shown.
Fig. 8.
The normalized number of open lung units ( ) and the average volume of a normalized lung unit ( ), versus normalized lung volume ( ) during lung inflation and deflation. Note that during inflation and deflation.
Discussion1
Weibel and colleagues [21,22] were among the first investigators to use tools of morphometry to study the lung’s anatomical structure. One of their assumptions was that the number of alveoli multiplied by the average alveolar volume was equal to the fraction of total lung volume occupied by the alveoli. They also assumed that total lung area was equal to the average area of an alveolus times the number of alveoli. Weibel [21] showed that this assumption was true for most distributions of alveolar size. In 1985, Frazer et al. [4] examined nonlinearities associated with differences in the compliance of small volume perturbations superimposed on the quasi-static PL-VL curve. These nonlinearities were only associated with regions of the curves where there was evidence of the recruitment-derecruitment of lung units. An interesting characteristic of this type of nonlinearity is that it cannot be linearized using techniques such as small signal or incremental analysis. Later, Brancazio et al. [6] extended that model to consider how recruitment-derecruitment would be expected to influence the geometric behavior of the lungs during inflation-deflation. Their analysis was used to demonstrate the effects of lung unit recruitment-derecruitment on and normalized lung unit area ( ) as a function of during lung inflation-deflation. More recently, Frazer et al. [5] calculated how varied with as the lung was inflated by assuming that could be estimated from curves recorded between TLC and an end-expiratory pressure of +6 cm H2O. In that study, was determined during lung inflation by assuming the relationship was proportional to the quasi-static loop formed by inflating-deflating the lung between +6 and 30 cm H2O in the open zone. Results indicated that lung tissue exhibited irreversible changes in structure upon expansion, which were responsible for alterations in their lung’s mechanical properties during inflation. Much of the irreversibility could be avoided if the lung was not deflated to low end-expiratory pressures (closing zone) during subsequent cycles [3–5]. In this study, and were found as a function of while the lung was deflated then inflated during a complete PL-VL maneuver between −5 and 30 cm of H2O.
Figure 7 shows an example of calculated values of and along with the quasi-static curve of an excised rat lung. Between transpulmonary pressures of 5 and 10 cm H2O, the difference between on lung deflation and inflation was 27%, and the difference in was 55%. In the volume range bounded by 35% and 55% TLC, values of were approximately 15% greater on lung inflation than on lung deflation (Fig. 8). This corresponds to nearly a 5% increase in the linear dimension of an open lung unit during lung deflation compared to lung inflation at the same volume. The maximum difference in between lung inflation and deflation with respect to lung volume was approximately 10% with being greater on lung deflation. There have been both direct and indirect measurements of alveolar size made during lung expansion and contraction, which are in general agreement with the findings in this study [10,23,24].
It should be pointed out that a lung unit has not been identified anatomically and may not be represented by a specific structure such as an alveolus but may be composed by a combination of structures such as portions of alveoli, entire alveoli, alveolar ducts, bronchioles, etc., which is represented by an “average” lung unit. During lung deflation, for example, more compliant units having mechanical properties similar to those found in the lung parenchyma appeared to be derecruited first, and the units that remain open near the end of deflation appear to represent the large, less compliant, airways. Figure 7 shows that near zero transpulmonary pressure the relationship looks very much like the PL-VL curves of larger airways [25,26].
This study indicates that when recruitment-derecruitment occurs, the volume of an open lung unit is not directly proportional to lung volume in the opening and closing zones. As a result, there is a nonlinear relationship between and . Where there is little evidence of recruitment-derecruitment, in the open region, appears to be proportional to , and remains nearly constant.
As with most models, the one described in this study has certain limitations. For instance, an implied assumption is that each open lung unit has approximately the same volume. Even though the units may be represented by different anatomical structures, it has been shown that for reasonable lung unit size distributions the model is fairly robust and assuming lung units of equal volume does not appear to contribute large errors [6,21].
Another important limitation of the model is that it does not address the time dependent behavior of lung’s tissue properties or the opening and closing of lung units [1,7,14,17,18,27,28]. It is known that the compliance of lung tissue in the open region of a PL-VL curve is a function of the ventilation rate. According to the constant phase model, the dynamic compliance can be expressed as Cti = 1/Hω(1−α), where α ≈ 0.91 and H (tissue elastance) is assumed to be independent of ω [15]. In addition, Hildebrandt [18] has shown experimentally that the compliance Cti of PL-VL loops, in the open region, changes less than 10% per decade with respect to frequency. When there is recruitment-derecruitment of lung units, however, the compliance of the open units is usually much less than the quasi-static lung compliance. As a result, the modest effect of frequency on loop compliance has an even smaller influence on the percent difference between the quasi-static and loop compliance, which is used to calculate VU and NO.
Due to the time dependence of the lung’s tissue properties, the results presented in this study only describe changes in and as a function of for a specific ventilation pattern. It would be possible, however, to use Eq. (3) to determine how the lung and lung units change volume with respect to transpulmonary pressure under a variety of conditions, which meet the theoretical prerequisites of the model.
The first requirement is that the lung units have sufficient time to open or close while the PL-VL operating point is in the opening or closing zones, and that units do not continue to open or close when the PL-VL curve enters the open zone. It appears, in Fig. 6, that when the lung was inflated, the maximum PL values during each perturbation cycle were only slightly greater than when the lung was inflated during the second cycle at the same average quasi-static rate. If lung units did not have time to open in the opening zone during a perturbation, it would be expected that there would be a significant increase in the maximum loop PLmax, which would reflect the inability of lung units to open during a perturbation cycle at that volume. As the path of PL-VL perturbation leaves the opening zone, and enters the open zone, there is a rapid decrease in both PL and VL, reducing the probability of lung units continuing to open. Once a lung unit has opened, the model assumes it would remain open, and NO would assume a constant value in the open zone. A similar argument can be made in describing the derecruitment of lung units during lung deflation. Lung units close when volume perturbations enter the closing zones at low end-expiratory pressures. An additional requirement is that the ventilation pattern must be composed of frequencies low enough that the effects of airway resistance can be neglected.
Footnotes
The findings and conclusions in this report are those of the authors and do not necessarily represent the views of the National Institute for Occupational Safety and Health.
Contributed by the Bioengineering Division of ASME for publication in the Journal of Biomechanical Engineering.
Contributor Information
D. G. Frazer, Email: dgf1@cdc.gov, CDC/NIOSH, 1095 Willowdale Road, Morgantown, WV 26505
W. G. Lindsley, Email: wdl7@cdc.gov, CDC/NIOSH, 1095 Willowdale Road, Morgantown, WV 26505
W. McKinney, Email: wdm9@cdc.gov, CDC/NIOSH, 1095 Willowdale Road, Morgantown, WV 26505
J. S. Reynolds, Email: jsr0@cdc.gov, CDC/NIOSH, 1095 Willowdale Road, Morgantown, WV 26505
G. N. Franz, Email: gnfranz@msn.com, Department of Physiology and Pharmacology, WVU Robert C. Byrd Health Sciences Center, Morgantown, WV 26505
M. Jackson, Email: moj8@cdc.gov, CDC/NIOSH, 1095 Willowdale Road, Morgantown, WV 26505
W. T. Goldsmith, Email: wbg4@cdc.gov, CDC/NIOSH, WVU School of Public Health, 1095 Willowdale Road, Morgantown, WV 26505
References
- 1.Bates JH, Irvin CG. Time Dependence of Recruitment and Derecruitment in the Lung: A Theoretical Model. J Appl Physiol. 2002;93:705–713. doi: 10.1152/japplphysiol.01274.2001. [DOI] [PubMed] [Google Scholar]
- 2.Cheng W, DeLong DS, Franz GN, Petsonk EL, Frazer DG. Contribution of Opening and Closing of Lung Units to Lung Hysteresis. Respir Physiol. 1995;102:205–215. doi: 10.1016/0034-5687(95)00055-0. [DOI] [PubMed] [Google Scholar]
- 3.Cheng W, DeLong DS, Franz GN, Petsonk EL, Frazer DG. Relationship Between Discontinuous Lung Sounds and Hysteresis in Control and Tween-20-Rinsed, Excised Rat Lungs. Respir Physiol. 1999;117:131–140. doi: 10.1016/s0034-5687(99)00048-1. [DOI] [PubMed] [Google Scholar]
- 4.Frazer DG, Weber KC, Franz GN. Evidence of Sequential Opening and Closing of Lung Units During Inflation/Deflation of Excised Rat Lungs. Respir Physiol. 1985;61:277–288. doi: 10.1016/0034-5687(85)90071-4. [DOI] [PubMed] [Google Scholar]
- 5.Frazer DG, Lindsley WG, Rosenberry K, McKinney W, Goldsmith WT, Reynolds JS, Tomblyn S, Afshari A. Model Predictions of the Recruitment of Lung Units and the Lung Surface Area-Volume Relationship During Inflation. Ann Biomed Eng. 2004;32(5):756–763. doi: 10.1023/b:abme.0000030240.83381.63. [DOI] [PubMed] [Google Scholar]
- 6.Brancazio L, Franz GN, Petsonk EL, Frazer DG. Lung Area-Volume Models in Relation to the Recruitment/De-Recruitment of Individual Lung Units. Ann Biomed Eng. 2001;29:252–262. doi: 10.1114/1.1352639. [DOI] [PubMed] [Google Scholar]
- 7.Suki B, Barabsi AL, Hantos A, Petak F, Stanley HE. Avalanches and Power-Law Behavior in Lung Inflation. Nature. 1994;368:615–618. doi: 10.1038/368615a0. [DOI] [PubMed] [Google Scholar]
- 8.Suki B, Andrade J, Jr, Coughlin MF, Stamenovich D, Stanley HE, Sujeer M, Zapperi S. Mathematical Modeling of the First Inflation of Degassed Lungs. Ann Biomed Eng. 1998;26:608–617. doi: 10.1114/1.126. [DOI] [PubMed] [Google Scholar]
- 9.Majumdar A, Alencal AA, Buldyrev SV, Hantos A, Stanley HE, Suki B. Fluid Transport in Branched Structures With Temporary Closures: A Model of Quasistatic Lung Inflation. Phys Rev E. 2003;67:031912. doi: 10.1103/PhysRevE.67.031912. [DOI] [PubMed] [Google Scholar]
- 10.Namati E, Thiesse J, de Ryk J, McLennan F. Alveolar Dynamics During Respiration. Are Pores of Kohn a Pathway to Recruitment. Am J Respir Cell Mol Biol. 2008;38:572–578. doi: 10.1165/rcmb.2007-0120OC. [DOI] [PMC free article] [PubMed] [Google Scholar]
- 11.Frazer DG, Stengel PW, Weber KC. Meniscus Formation in Airways of Excised Rat Lungs. Respir Physiol. 1979;36:121–129. doi: 10.1016/0034-5687(79)90019-7. [DOI] [PubMed] [Google Scholar]
- 12.Frazer DG, Weber KC. Trapped Gas at Maximum Lung Volume in Intact Isolated Rat Lungs. Respir Physiol. 1979;37:173–184. doi: 10.1016/0034-5687(79)90069-0. [DOI] [PubMed] [Google Scholar]
- 13.Alencar AM, Hantos Z, Petak F, Tolnai J, Asztalos T, Zapperi S, Andrade JS, Buldyrev SV, Stanley HE, Suki B. Scaling Behavior in Crackle Sound During Lung Inflation. Phys Rev E. 1999;60:4659–4663. doi: 10.1103/physreve.60.4659. [DOI] [PubMed] [Google Scholar]
- 14.Fredberg JJ, Stamenovic D. On the Imperfect Elasticity of Lung Tissue. J Appl Physiol. 1989;67(6):2408–2419. doi: 10.1152/jappl.1989.67.6.2408. [DOI] [PubMed] [Google Scholar]
- 15.Hantos Z, Daroczy B, Suki B, Nagy S, Fredberg JJ. Input Impedance and Peripheral Inhomogeneity of Dog Lungs. J Appl Physiol. 1992;72:168–178. doi: 10.1152/jappl.1992.72.1.168. [DOI] [PubMed] [Google Scholar]
- 16.Bachofen H, Hildebrandt J. Area Analysis of Pressure-Volume Hysteresis in Mammalian Lungs. J Appl Physiol. 1971;30:439–497. doi: 10.1152/jappl.1971.30.4.493. [DOI] [PubMed] [Google Scholar]
- 17.Hildebrandt J. Dynamic Properties of Air-Filled Excised Cat Lung Determined by Liquid Plethsymograph. J Appl Physiol. 1969;27(2):246–250. doi: 10.1152/jappl.1969.27.2.246. [DOI] [PubMed] [Google Scholar]
- 18.Hildebrandt J. Comparison of Mathematical Models for Cat Lung and Viscoelastic Balloon Derived by Laplace Transform Methods From Pressure-Volume Data. Bull Math Biophys. 1969;31:651–667. doi: 10.1007/BF02477779. [DOI] [PubMed] [Google Scholar]
- 19.Frazer DG, Franz GN. Trapped Gas and Lung Hysteresis. Respir Physiol. 1981;46:237–246. doi: 10.1016/0034-5687(81)90124-9. [DOI] [PubMed] [Google Scholar]
- 20.Stengel PW, Frazer DG, Weber KC. Lung Degassing: An Evaluation of Two Methods. J Appl Physiol. 1980;48:370–375. doi: 10.1152/jappl.1980.48.2.370. [DOI] [PubMed] [Google Scholar]
- 21.Weibel ER. Morphometry of the Human Lung. Academic Press Inc; New York: 1963. pp. 36–37. [Google Scholar]
- 22.Weibel ER, Gomes DM. A principle for Counting Tissue Structures on Random Sections. J Appl Physiol. 1962;17:343–348. doi: 10.1152/jappl.1962.17.2.343. [DOI] [PubMed] [Google Scholar]
- 23.Smaldone GC, Mitzner W, Itoh H. Role of Alveolar Recruitment in Lung Inflation: Influence on Pressure-Volume Hysteresis. J Appl Physiol. 1983;55:1321–1332. doi: 10.1152/jappl.1983.55.4.1321. [DOI] [PubMed] [Google Scholar]
- 24.Lum H, Huang I, Mitzner W. Morphological Evidence of Alveolar Recruitment During Inflation at High Transpulmonary Pressure. J Appl Physiol. 1990;68:2282–2286. doi: 10.1152/jappl.1990.68.6.2280. [DOI] [PubMed] [Google Scholar]
- 25.Lai-Fook SJ, Hyatt RE, Rodarte JR. Effect of Parenchymal Shear Modulus and Lung Volume on Bronchial Pressure-Diameter Behavior. J Appl Physiol. 1978;44(6):859–868. doi: 10.1152/jappl.1978.44.6.859. [DOI] [PubMed] [Google Scholar]
- 26.Lambert RK, Wilson TA, Hyatt RE, Rodarte JR. A Computational Model for Expiratory Flow. J Appl Physiol. 1982;52(1):44–56. doi: 10.1152/jappl.1982.52.1.44. [DOI] [PubMed] [Google Scholar]
- 27.Gaver DP, III, Samsel RW, Solway J. Effects of Surface Tension and Viscosity on Airway Opening. J Appl Physiol. 1990;69:74–85. doi: 10.1152/jappl.1990.69.1.74. [DOI] [PubMed] [Google Scholar]
- 28.Yap DY, Liebkeman WD, Solway J, Gaver DP., III Influences of Parenchymal Tethering on the Reopening of Closed Pulmonary Airways. J Appl Phsyiol. 1994;76:2095–2105. doi: 10.1152/jappl.1994.76.5.2095. [DOI] [PubMed] [Google Scholar]


