

Abstract
microRNAs (miRNAs) represent a newly identified class of nonprotein-coding ∼22 nt small RNA that plays important roles in multiple biological processes by degrading targeted mRNA or repressing mRNA translation. This study observed the morphology of swine testicular tissue at different developmental stages (including 1-day old, 1–7 month old) by Hematoxylin-eosin staining. We also examined the expression of miR-499 and its target genes (CYLC1, DMRT1, QKI, XRN2, ZNF313) in samples of tissue slices using quantitative reverse-transcription polymerase chain reaction, which showed that miR-499 had a significant negative correlation with QKI gene. Then, the proteins of QKI gene expression were determined by western blot, which were consistent with results of quantitative polymerase chain reaction (qPCR) detection. Therefore, the luciferase reporter gene system was used to verify correlation between miR-499 and QKI gene. Activity of luciferase was significantly lower in miR-499 co-transfected with pmiR-RB-REPORT-QKI-WT group than the miR-499 co-transfected with pmiR-RB-REPORT-QKI-mut/si groups, indicating that target sequence of miR-499 existed in 3′UTR of QKI gene. Furthermore, the expressions of miR-499 and QKI were detected in testicular cells that were transfected with miR-499, miR-499 negative control and untreated. The results showed that the diameter of convoluted seminiferous tubule growth increased with age. Significantly different expressions of miR-499 and its target genes were found in swine testicular tissue at different developmental stages (p<0.05), overexpressing miR-499 analysis, suggesting that miR-499 was negatively correlated to the expression of QKI (p<0.05). In conclusion, QKI is a target gene of miR-499.
Introduction
MiRNAs are classes of small, endogenous, noncoding regulatory RNAs that are ∼22 nucleotides in length (Ma et al., 2012). They are widely expressed in eukaryotes and participate in the regulation of a variety of functions, including gene expression, developmental timing, organ development, cells proliferation, apoptosis, cell differentiation, fat metabolism, nervous system, and the biological processes of tumors (Cai et al., 2004; Lee et al., 2004; Smalheiser and Torvik, 2005). Increasing studies have shown that miRNAs are essential for normal spermatogenesis and male fertility. For example, the lack of synthetic miRNA required by Dicer-deficient mice produces an abnormal elongation in their sperm, which results in male sterility (Brueckner et al., 2007; He et al., 2007; Lujambio et al., 2008). But research of miRNAs in swine testis is seldom.
miR-499 is an important aspect of miRNAs, the major function of which is an important regulatory role in the occurrence and development of a variety of cancers (Chu et al., 2012; Chen et al., 2013; Brunotto et al., 2014). Recent studies suggest that a significant association exists between miRNA499 single nucleotide polymorphisms (SNPs) and hepatocellular carcinoma (Chu and Hsieh, 2014). The overexpression of miRNA499 alone increased the number of beating cells, suggesting that miR-499 may act as a factor promoting cell proliferation (Pisano et al., 2014). Significant difference expression of miR-499 in immature and mature Junmu no.1 white swine testicular tissue was found by high-throughput sequencing (Lian et al., 2012). This result suggests that expression of miR-499 maybe chronological in swine testicular tissue at different developmental stages. miRNAs play an important role in the regulation of eukaryotic gene expression by complete or incomplete complementary target genes. But a few reports have investigated the target genes of miR-499. Therefore, we aimed at evaluating the expressions of miR-499 and its target genes in swine testicular tissue at different developmental stages, and we sought to provide further verification on the relationship between miR-499 and QKI gene.
Materials and Methods
Tissue samples, cell lines, and cell transfection
A total of 24 samples, which included 1-day-old, 1–7 month-old swine testicular tissue, were collected from the Jilin University swine farm. Animal experiments were done under the guidance of Jilin university animal care and use committee.
The swine testicular cells were purchased from a company (Boster). Twenty-four hours before transfection, the swine testicular cells were plated at a concentration of ∼1×10⁶/well into six-well culture plates with DMEM/HIGH GLUCOSE (GIBCO) containing 10% fetal bovine serum (FBS; PAA) and 1% Penicillin-Streptomycin in a 37°C humidified atmosphere of 5% CO2. The DMEM/HIGH GLUCOSE medium was replaced by Opti-MEM serum-free medium (GIBCO) when the cell fusion level reached more than 80%. For luciferase activity detection, 150 μL Opti-MEM serum-free medium (GIBCO) was mixed with 5 μL of LipofectamineTM2000 (Invitrogen) and 1.25 μL 20 μmol of the miR-499 mimics and 500 ng pmiR-RB-REPORT-QKI vectors. For expression of miR-499 and QKI gene detection in cells of overexpression miR-499, 150 μL Opti-MEM serum-free medium (GIBCO) was mixed with 5 μL of LipofectamineTM2000 (Invitrogen) and 1.25 μL 20 μmol of the miR-499 mimics and negative control. Next, the transfection mixture was added to each well containing the cells in Opti-MEM serum-free medium after incubation at room temperature for 30 min. The medium was changed to regular cell culture medium after 3–5 h. Transfected cells were used in further assays or RNA/protein extraction.
Hematoxylin and eosin staining
The samples of testicular tissue were soaked in 4% formaldehyde for 3 days and then washed in pure water. Staining was done according to the article explanation (Nagata et al., 2007). Morphology of testicular tissue was determined by microscopic analysis.
Bioinformatics prediction and luciferase reporter assay
Four kinds of bioinformatics software (microRNA.org, miRDB, miRGen, TargetScan) were used to predict the target genes of miR-499. A fragment of 3′UTR of QKI (1005 bp) containing the putative miR-499 binding site was amplified using 3′RACE Kit (Takara). Primers were shown in Table 1. Next, vectors of reporter gene system were constructed. Primers were shown in Table 2. All constructs were verified by DNA sequencing and digestion. Then, miR-499 was co-transfected with vectors of QKI gene. At 48 h after transfection, luciferase activity was detected using a dual-luciferase reporter assay system (Promega) and normalized to Renilla activity. The experimental groups were shown in Table 3.
Table 1.
3′RACE Primer
| Symbol | Primer | Sequence (5′-3′) |
|---|---|---|
| QKI | QKI-RACE-F | TAGCGGTGTATTAGGTGCGG |
| QKI-RACE-R | ATGCGTGTCCATCCTTACCA | |
| CYLC1 | CYLC1-RACE-F | GAAAGACCACCACTACCTCC |
| CYLC1-RACE-R | GAGCCTTTACTTCCATCACC |
F, forward; R, reverse.
Table 2.
Primers for Construction of Vector
| Symbol | Primer | Sequence (5′-3′) |
|---|---|---|
| QKI | QKI-1 | TGTTAAGTTTTTCTCTCATGGCACACTTCcggcgtcc |
| CAAATTTTGGCAGGCAATAT | ||
| QKI-2 | CTTTTTTATATTGCTGCCAAAATTTGggacgccgGAAGTGTGCCATG | |
| AGAGAAAAACT | ||
| QKI-Xho | CCGCTCGAGCACCCAATGATGACCTGACCA | |
| QKI-Not | GAATGCGGCCGC CTGCACCAGCACCCTTGTAT |
Table 3.
The Experimental Group
| Group 1 | Group 2 | Group 3 | Group 4 | Group 5 | Group 6 | |
|---|---|---|---|---|---|---|
| Reporter | 3′UTR (si) | 3′UTR (si) | 3′UTR (WT) | 3′UTR (WT) | 3′UTR (mut) | 3′UTR (mut) |
| Research | Mimic | miR-499 | Mimic | miR-499 | Mimic | miR-499 |
| Tools | Ncontrol | mimic | Ncontrol | mimic | Ncontrol | mimic |
mut, mutation; WT, wild type.
RNA isolation, cDNA synthesis, and real-time PCR
Testis tissue samples from healthy swine specimens were frozen in liquid nitrogen, and Trizol reagent was used to extract total RNA. The cDNA was synthesized by reverse transcription with an RT-PCR Kit (Takara) according to the instructions. Primers of miR-499 and its target genes were designed for quantitative reverse-transcription polymerase chain reaction according to the sequence of NCBI and miRBase14.0 (Table 4).
Table 4.
Primer Sequences of Real-Time Polymerase Chain Reaction
| Symbol | Primer | Primer sequence(5′–3′) |
|---|---|---|
| ssc-miR-499-5p | RT-Primer | GTCGTATCCAGTGCAGGGTCCGAGGTGCACTGG |
| ATACGACAAACATC | ||
| F-Primer | TGCGGTTAAGACTTGCAGTGAT | |
| R-Primer | CAGTGCAGGGTCCGAGGT | |
| U6 | RT-Primer | AACGCTTCACGAATTTGCGT |
| F-Primer | CTCGCTTCGGCAGCACA | |
| R-Primer | AACGCTTCACGAATTTGCGT | |
| CYLC1 | F-Primer | ATG CCAAGAAGG ATGAGACA |
| R-Primer | TTCCTTTGCGTCTACAGACT | |
| QKI | F-Primer | CCAAACGGAACTCCTCACCC |
| R-Primer | AGCCACCGCACCTAATACACC | |
| DMRT1 | F-Primer | GCAGAGGCT TCCTTCGACTT |
| R-Primer | TGCTGTATGCGTCGTCGTTG | |
| XRN2 | F-Primer | TGCTACACACGAACCCAACT |
| R-Primer | TCTCTTGGCAAACCTTCACA | |
| ZNF313 | F-Primer | GTGGATTACGACGTTGACGA |
| R-Primer | ACATGTTTCACGCGGACACA | |
| GAPDH | F-Primer | GTTTGTGATGGGCGTGAAC |
| R -Primer | ATGGACCTGGGTCATGAGT |
RT, real time.
In the quantitative polymerase chain reaction (qPCR) experiments, the expression of miR-499 and genes (CYLC1, DMRT1, QKI, XRN2, ZNF313) in the testis was detected in twenty-four samples with each other and each sample repeated thrice. The qPCR mixture included cDNA (2 μL), PCR-Master Mix (10 μL), PCR-F-Primer (0.5 μL), PCR-R-Primer (0.5 μL), and RNase-free H2O (7 μL) in a total volume of 20 μL. qPCR was performed in a reaction under the following procedure: 95°C for 30 s; 40 cycles of 95°C for 5 s and 60°C for 30 s. The expression of miR-499 and genes was detected using the SYBR Green I (Takara) and was analyzed by Eppendorf AG-5341 fluorescence quantitative instrument. The data were analyzed using the SPSS 13.0 software and 2−ΔΔCT method was used according to the following formula:
ΔΔCt={Ct (positive)−Ct (reference)} −{Ct (control)−Ct (reference)}.
Here, 2−ΔΔCt refers to the relative expression ratio.
Western blot detection analysis
Total protein was extracted from testicular tissue at different developmental stages using RIPA buffer (Boster) following the manufacturer's instructions. Protein concentration was determined using the BCA Protein Assay Kit (Boster). Total protein (35 μg per sample) was resolved by SDS-PAGE and transferred onto PVDF membrane (Bio-Red Laboratories, Inc.). Immunoblotting was conducted using the following primary antibodies with the suggested dilutions from the manufacturer: anti-QKI (Abcam); anti-β-actin (Abcam). The antibodies were diluted with 5% BSA (Albumin from bovine serum), and the suggested dilutions were 1:200 and 1:1000. The immunoblots were developed using an ECL Advanced Western Blotting Detection Kit (Invitrogen).
Overexpression of miR-499
The cells were cultured and transfected in the earlier section. Then, the cells were harvested at 48h after transfection. Total RNA and total protein were extracted from the cells according to the kit manual (BioFlux). Then, the expression of miR-499 and QKI was detected by qPCR. In a further reaction, the expression of QKI in protein levels was detected by western blot. Experimental methods refer to the earlier experiments.
Results
Testicular tissue growth and development with increasing age of swine
Morphology of testicular tissue was analyzed by a microscope, which was shown in Figure 1. The diameter of seminiferous tubules is advanced with the growth of age of swine. With the increase of age, the interstitial connective tissue gradually reduced, and seminiferous tubule gradually developed into a mature one. Spermatogenic cells and sertoli cells gradually moved closer to the basement section of seminiferous tubules.
FIG. 1.
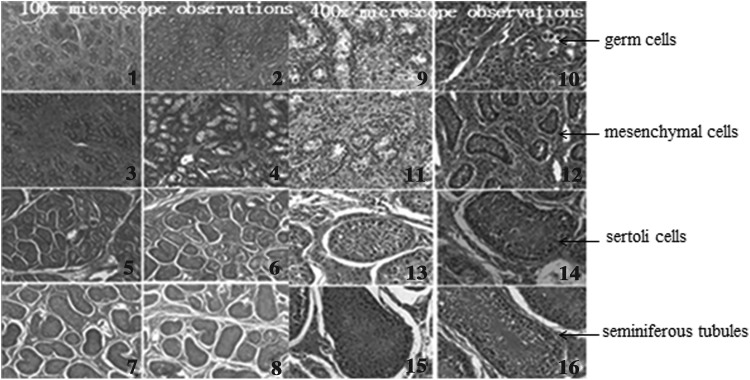
Tissue section observations. In this figure, we observed the testicular tissue at different development stages by hematoxylin and eosin-stained sections. 1–8, respectively, represent 1-day-old testis, 1–7 months of age of testis observations under 100 times magnification, and 9–16, respectively, represent 1-day-old testis, 1–7 months of age of testis observations under 400 times magnification.
miR-499 and its target genes differentially expressed in swine testes at different developmental stages
Target genes of miR-499 were predicted by bioinformatics software, including DMRT1, XRN2, CYLC1, QKI, and ZNF313. miR-499 and its target genes were detected by qPCR in different developmental stages of testis, which were shown in Figure 2. The expression of miR-499 displayed an increasing trend at 1 day, 1 month, and 2 months of age. After 2 months of age, the expression of miR-499 began to decrease, reaching a minimum level at 7 months of age.
FIG. 2.
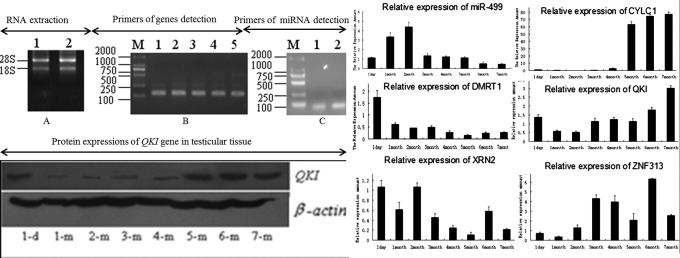
Detection of miR-499 and its target genes. In this Figure, (A) RNA extracted and cDNA synthesized. (B) Primers of genes detected. B1-B5, respectively, represented the CYLC1, DMRT1, QKI, XRN2, and ZNF313 gene PCR amplification results. (C) Primers of miR-499 and U6 detected. C1 represent the miR-499, and C2 represent the U6 PCR amplification results. Then, mRNA and protein of miR-499 and its target genes were detected. But only the protein of gene QKI that had a significant negative correlation with miR-499 in mRNA level was detected.
CYLC1 gene expression was low in the young testes but began to rapidly increase at 5 months of age of the testes, resulting in an upward trend from 5 to 7 months of age; the highest expression levels were detected at 7 months of age.
In contrast, the DMRT1 gene expression levels displayed an overall downward trend, such that the 1-day-old testes exhibited the highest DMRT1 expression. By 5–7 months, its expression in the testicular tissue was slightly increased, but this increase was not significant.
The QKI gene expression level in the testicular tissue displayed a decreasing trend during the first 3 months, followed by an increasing trend. There was a slight deviation in its expression at 5 months, but this result did not affect the overall trend. The expression of QKI gene in the testes was highest in the 7 month-old swine testis.
The XRN2 expression levels decreased from 1 day to 1 month of age of the testis, but at 2 months of age, its expression was restored to nearly the identical expression level at 1 day of age. After 2 months, its expression began to decrease, although its expression was highest at the 6 month. But at 7 months of age of the testis, its expression was again reduced.
The expressions of ZNF313 at 1 day, 1 month, and 2 months of the testis were very low. They increased rapidly at 3 months of age of the testis and then began decreasing until 6 months of age, on which they rapidly increased to their highest expression. At 7 months, the expression levels of ZNF313 were reduced. Correlation analysis revealed that the expression of miR-499 with its target genes had a relationship with QKI (R=−0.305; p<0.01), ZNF313 (R=−0.217; p<0.05), CYLC1 (R=−0.300; p<0.05), XRN2 (R=0.251; p<0.05), and DMRT1 (R=−0.014; p>0.05).
Since expression of miR-499 had a significant negative correlation with QKI gene, the expressions of QKI gene were analyzed by Western blot in swine testes at different developmental stages. The results of β-actin were uniform. The expression of QKI gene was higher expressed in 1-day-old testes than in 1–4 month testes. And its expression increased at 5–7 months of age in swine testes, as shown in Figure 2. The results of the western blotting analysis were consistent with the qPCR results.
miR-499 binding site existed in 3′UTR of QKI gene
Amplification of QKI gene 3′UTR was done with reference to the manual (Takara). The full length of QKI gene 3′UTR sequence was amplified from DNA as a 1005 bp fragment (Fig. 3). The pmiR-RB-REPORT-QKI-mut vector in QKI gene was introduced by fusion PCR amplification (Fig. 3), and pmiR-RB-REPORT-QKI-WT/si vectors were constructed (Fig. 3). The vectors were confirmed by sequencing (Fig. 3). The luciferase reporter gene system was used to validate the correlation of miR-499 and QKI. The results showed that luciferase activity of pmiR-RB-REPORT-QKI-WT with miR-499 was significantly lower than pmiR-RB-REPORT-QKI-mut and pmiR-RB-REPORT-QKI-si with miR-499 (Fig. 3), indicating a target sequence of miR-499 existed on 3′UTR of QKI gene.
FIG. 3.

Luciferase reporter assay. In this figure, luciferase reporter vectors were constructed. The special primers were designed: In the fused area, the primer has a complementary area for the DNA piece and also a complementary area for the second DNA piece; normal primer for the nonfused end. The fusions PCR merged fragment P1 (605 bp) and P2 (400 bp). Restriction endonuclease (XhoI and NotI) digested and sequenced were used to ensure the vectors pmiR-RB-REPORT-QKI correctly. Then, luciferase activities were detected about miR-499 and vectors of QKI gene.
miR-499 efficiently suppressed QKI gene in swine testicular cells
miR-499 and QKI gene were detected in testicular cells by qPCR; the expression of miR-499 in overexpressing miR-499 group was significantly higher than in the normal cells group and negative control group. However, the expression of QKI was the opposite. And miR-499 and QKI gene in the normal cells group and negative control group had no significant difference expression. The experimental results reveal that miR-499 inhibited the expression of QKI gene (Fig. 4).
FIG. 4.

Overexpression of miR-499. Expressions of miR-499 and QKI gene in cells overexpressing miR-499 and negative control were detected by qPCR, and QKI gene expression was detected by western blot. Group 1, Group 2, and Group 3, respectively, represent the cells transfected with miR-499, miR-499 negative control, and untreated.
Discussion
microRNAs represent a large class of gene regulatory molecules that control fundamental cellular processes in animals. The rapid progress in miRNAs in the past few years illustrates the huge potential of miRNAs for the diagnosis and treatment of various diseases in the near future. miR-143 and miR-223 levels were significantly lower in the morbidly obese group and obese group than the control group (normal BMI or overweight). Obesity leads to alterations in miRNA expression, and miRNA-143 and miR-223s can be used as biomarkers for the metabolic changes in obesity (Kilic et al., 2015). Studies have shown that miRNAs may be involved in the regulation of mitosis and gene expression during spermatogenesis. Subsequently, Yan et al. (Grishok et al., 2001; Yi et al., 2003; Okamura et al., 2007; Ruby et al., 2007) used gene chip technology to determine the miRNA expression patterns in the relatively immature and mature mouse testis. They found that the expression of 19 miRNAs differed significantly between the immature and mature tissues. Of these, 14 miRNAs were unregulated and five miRNAs were downregulated in the immature mouse testis. This result suggested that these miRNAs may affect testicular development or spermatogenesis.
In this study, morphology of testicular tissue was determined by microscopic analysis. This study also investigated the expression of the miR-499 and its target genes in swine testes at different developmental stages, and it verified the relationship of miR-499 with QKI gene. Correlation analysis revealed that miR-499 targeted the genes QKI (R=−0.305; p<0.01), ZNF313 (R=−0.217; p<0.05), CYLC1 (R=−0.300; p<0.05), XRN2 (R=0.251; p<0.05), and DMRT1 (R=−0.014; p>0.05). The results showed that miR-499 had a significant negative correlation with QKI gene. Based on morphological analysis, the seminiferous tubules were found to grow with increasing age of the swine. By 7 months of age, these tubules reached maximum size. The highest expression of miR-499 was detected in 2 month-old swine testis. And then its expression began to decrease. In contrast, the expression of its target gene QKI was the lowest at 2 month. This finding suggests that miR-499 may be involved in the development of early testicular tissues, while QKI may play an important role in regulation of mature testis development and spermatogenesis.
This study had some limitations. Indicators of reproductive traits were difficult to measure. So, it was necessary to find an intuitive way to explore the effects of miRNAs on testicular tissue of swine.
Conclusions
1. Testicular seminiferous tubule increases with increasing age.
2. QKI was demonstrated to be a target gene of miR-499.
3. miRNA-499 may be associated with testicular tissue maturation and sperm production.
Acknowledgments
This study was supported by a grant from the Science and Technology Development Program in Jilin Province, Item Number (20140204067NY) and a grant from the Science and Technology Development Program of Changchun, Item Number (12XN28).
Disclosure Statement
The authors declare that there is no conflict of interest that could be perceived as prejudicing the impartiality of the research reported.
References
- Brueckner B., Stresemann C., Kuner R., Mund C., Musch T., Meister M., Sultmann H., and Lyko F. (2007). The human let-7a-3 locus contains an epigenetically regulated microRNA gene with oncogenic function. Cancer Res 67, 1419–1423 [DOI] [PubMed] [Google Scholar]
- Brunotto M., Zarate A.M., Bono A., Barra J.L., and Berra S. (2014). Risk genes in head and neck cancer: a systematic review and meta-analysis of last 5 years. Oral Oncol. 50, 178–88 [DOI] [PubMed] [Google Scholar]
- Cai X.Z., Hagedorn C.H., and Cullen B.R. (2004). Human microRNAs are processed from capped, polyadenylated transcripts that can also function as mRNAs. RNA 10, 1957–1966 [DOI] [PMC free article] [PubMed] [Google Scholar]
- Chen Z., Xu L., and Ye X. (2013). Polymorphisms of microRNA sequences or binding sites and lung cancer: a meta-analysis and systematic review. PLoS One 8, 4. [DOI] [PMC free article] [PubMed] [Google Scholar]
- Chu Y.H., and Hsieh M.J. (2014). MicroRNA gene polymorphisms and environmental factors increase patient susceptibility to hepatocellular carcinoma. PLoS One 9, 2. [DOI] [PMC free article] [PubMed] [Google Scholar]
- Chu Y.H., Tzeng S.L., and Lin C.W. (2012). Impacts of microRNA gene polymorphisms on the susceptibility of environmental factors leading to carcinogenesis in oral cancer. PLoS One 7, 6. [DOI] [PMC free article] [PubMed] [Google Scholar]
- Grishok A., Pasquinelli A.E., Conte D., et al. (2001). Genes and mechanisms related to RNA interference regulate expression of the small temporal RNAs that control C-elegans developmental timing. Cells 106, 23–34 [DOI] [PubMed] [Google Scholar]
- He L., He X.Y., Lim L.P., et al. (2007). A microRNA component of the p53 tumour suppressor network. Nature 447, 1130–U1116 [DOI] [PMC free article] [PubMed] [Google Scholar]
- Kilic I.D., Dodurga Y., Uludag B., and Alihanoglu Y.L. (2015). microRNA-143 and −223 in obesity. Gene 560, 140–142 [DOI] [PubMed] [Google Scholar]
- Lee Y., Kim M., and Han J. (2004). MicroRNA genes are transcribed by RNA polymerase II. Embo J 23, 4051–4060 [DOI] [PMC free article] [PubMed] [Google Scholar]
- Lian C., Sun B., Niu S., Yang R., Liu B., Lu C., Meng J., Qiu Z., Zhang L., and Zhao Z. (2012). A comparative profile of the microRNA transcriptome in immature and mature porcine testes using Solexa deep sequencing. FEBS J 279, 964–975 [DOI] [PubMed] [Google Scholar]
- Lujambio A., Calin G.A., Villanueva A., et al. (2008). A microRNA DNA methylation signature for human cancer metastasis. Proc Natl Acad Sci U S A 105, 13556–13561 [DOI] [PMC free article] [PubMed] [Google Scholar]
- Ma R., Jiang T., and Kang X. (2012). Circulating microRNAs in cancer: origin, function and application. Exp Clin Cancer Res 31, 38. [DOI] [PMC free article] [PubMed] [Google Scholar]
- Nagata N., Iwata N., Hasegawa H., Sato Y., Morikawa S., Saijo M., Itamura S., Saito T., Ami Y., Odagiri T., Tashiro M., and Sata T. (2007). Pathology and virus dispersion in cynomolgus monkeys experimentally infected with severe acute respiratory syndrome coronavirus via different inoculation routes. Exp Pathol 88, 403–414 [DOI] [PMC free article] [PubMed] [Google Scholar]
- Okamura K., Hagen J.W., Duan H., Tyler D.M., and Lai E.C. (2007). The mirtron pathway generates microRNA-class regulatory RNAs in Drosophila. Cell 130, 89–100 [DOI] [PMC free article] [PubMed] [Google Scholar]
- Pisano F., Altomare C., Cervio E., Barile L., and Rocchetti M. (2014). Combination of miRNA499 and miRNA133 exerts a synergic effect on cardiac differentiation. Stem Cells 10, 1002. [DOI] [PMC free article] [PubMed] [Google Scholar]
- Ruby J.G., Jan C.H., and Bartel D.P. (2007). Intronic microRNA precursors that bypass Drosha processing. Nature 448, 83–86 [DOI] [PMC free article] [PubMed] [Google Scholar]
- Smalheiser N.R., and Torvik V.I. (2005). Mammalian microRNAs derived from genomic repeats. Trends Genet 21, 322–326 [DOI] [PubMed] [Google Scholar]
- Yan N.H., Lu Y.L., Sun H.Q., et al. (2007). A microarray for microRNA profiling in mouse testis tissues. Reproduction 134, 73–79 [DOI] [PubMed] [Google Scholar]
- Yi R., Qin Y., Macara I.G., and Cullen B.R. (2003). Exportin-5 mediates the nuclear export of pre-microRNAs and short hblankpin RNAs. Genes Dev 17, 3011–3016 [DOI] [PMC free article] [PubMed] [Google Scholar]