

Abstract
Objectives. We estimated HCV incidence among individuals who repeatedly underwent anti-HCV testing.
Methods. We studied HCV-negative individuals who had at least 2 tests between April 1992 and September 2012 in British Columbia, Canada. We calculated incidence as the number of new infections per 100 person-years at risk.
Results. From 1992 to 2012, 323 598 individuals who persistently tested negative and 7490 HCV seroconverters contributed 1 774 262 person-years of observation time. Incidence rates ranged from 2.66 infections per 100 person-years (95% confidence interval [CI] = 2.07, 3.35) in 1993 to 0.25 infections per 100 person-years (95% CI = 0.21, 0.29) in 2011. Rates declined sharply in the 1990s and declined more gradually in the 2000s. Incidence declined with age; highest incidence rates were among those aged 15 to 24 years. Incidence among male repeat testers exceeded that of female repeat testers across all years, although the gap narrowed over time.
Conclusions. Addictions treatment, harm reduction, prevention education, and novel initiatives to remove barriers in health infrastructure need to be intensified for those who inject drugs, particularly men and younger persons.
HCV infection is a major global cause of liver-related morbidity and mortality.1 Transmission is through blood contact, and in developed nations HCV is endemic among persons who inject drugs (PWID), the core group involved in forward transmission of the epidemic.1–4 The number of new HCV infections is projected to decrease, whereas the number of individuals with advanced liver disease as a result of HCV is projected to increase.5,6 Decisions regarding the prevention of HCV-related morbidity and mortality are at a critical juncture, as end-stage liver disease is imminent in many of those infected and more effective, better tolerated curative therapies have recently been approved.7 Despite these advances, treatment rates among PWID are low, and linking this group to care is considered key in having a population-level impact on the epidemic.4
Monitoring HCV incidence in core groups is important for planning and evaluating prevention efforts, treatment, and resource allocation. However, distinguishing recent from established HCV infection is challenging because of the high proportion of asymptomatic cases and the absence of a reliable serologic test to differentiate between acute and chronic infection.8,9 A further challenge in incidence estimation is defining and quantifying the population at risk for HCV, the denominator in calculations of incidence.
In British Columbia, a western Canadian province with a population of 4.5 million, HCV cases are identified by HCV antibody screening. HCV testing is targeted at individuals with specific risk factors—a history of injection drug use, hemodialysis, receipt of blood products before 1992 or clotting factors before 1988, exposure to the blood of a high-risk individual, incarceration, and unregulated tattoos—as well as individuals with HIV or persistently elevated liver enzymes.10
As a pragmatic indicator of incidence, Canadian provinces use the rate of acute HCV, defined as a first-time anti-HCV positive laboratory result in an individual with a negative test on record in the past 12 months.11 Thus, identification of incident cases relies on repeat testing behavior and excludes more than three quarters of all newly diagnosed cases each year that are positive at first test. Although imperfect, these rates provide some indication of transmission trends. In British Columbia, acute HCV rates have been decreasing since 2008, from 3.4 to 1.5 cases per 100 000 population in 2011 (unpublished British Columbia Centre for Disease Control data).
Methods of incidence estimation as determined by repeat laboratory testing have been developed for HIV and other sexually transmitted infections and are applicable to HCV.12,13 Among individuals who test repeatedly, annual incidence is calculated as the number of seroconversions over the total person-time at risk for HCV infection. Person-time at risk starts from the first negative test to either the last negative or first positive test on record. This approach is most useful in jurisdictions like British Columbia, where laboratory testing for HCV is centralized or the linkage of all HCV testing is possible.
In a novel application of this method to HCV surveillance data, using a province-wide laboratory-testing database, we examined incident cases among individuals who repeatedly tested for HCV in British Columbia. Our purpose was to (1) estimate trends in provincial HCV incidence among all repeat testers, and (2) evaluate the method for ongoing monitoring purposes.
METHODS
We derived the estimation of HCV incidence rates from analysis of laboratory testing data from the British Columbia Public Health Microbiology and Reference Laboratory testing database. The British Columbia Public Health Microbiology and Reference Laboratory is the central laboratory responsible for anti-HCV testing in the province. This laboratory has performed more than 95% of all anti-HCV tests in British Columbia since 1992. We linked individuals’ multiple HCV test results on the basis of matching on personal health number, name, and date of birth to create a longitudinal patient-based record.
We included individuals who underwent anti-HCV testing in British Columbia from April 19, 1992, to September 7, 2012. Repeat testers (those who had 2 or more linked tests) whose first test was negative formed the cohort for our analysis of incidence. We defined seroconversions as an anti-HCV positive test following a negative test at any time.
HCV cases are currently defined by detecting anti-HCV with a third-generation enzyme immunoassay. If the initial screen is positive, the specimen is retested by a different manufacturer’s enzyme immunoassay. Only specimens found positive by both manufacturers’ tests are considered anti-HCV positive. Between 1992 and 1997, second- and third-generation assays were in use, and from 1997 onward only third-generation assays were in use. Generally, equivocal results are retested, but if the final test on file was equivocal we considered it negative.
Although HCV RNA testing, distinguishing active from cleared infection, was available on a subset of anti-HCV reactive cases, this was not comprehensively available and, thus, we did not use it. We excluded those who did not reside in British Columbia. Information routinely collected on each individual tested includes date of birth, gender, test dates, test result, and patient jurisdiction.
We explored the number of HCV tests among all testers versus repeat testers by year, age, and gender. For descriptive statistics, we calculated age on the basis of the test date of interest (e.g., date of diagnosis). We calculated incidence rates by gender (man, woman), age group (15–24, 25–34, 35–44, 45–54, ≥ 55 years), and year. For rate calculations, we estimated individuals’ age as the age at the midpoint between a tester’s first and last tests.
We calculated incidence among repeat HCV testers from data spanning 1992 to 2012. We presented rates from 1993 to 2011 because of a characteristic inflection affecting rates in the edge years, particularly the first and last years (1992 and 2012), known as truncation bias.12 We calculated annual incidence as the number of apportioned HCV seroconversions (numerator) divided by the person-time at risk (denominator) and expressed as the number of new infections per 100 person-years. We estimated 95% confidence intervals (CIs) using exact methods.
For the numerator, we assumed the probability of seroconversion to be uniformly distributed over the seroconversion interval, the time from the last negative test to the first positive test. If the seroconversion interval fell completely within a calendar year, we assigned a count of 1 to that year. If the seroconversion interval fell only in part of the calendar year, we assigned a fractional count to that year equal to the proportion of the total seroconversion interval that fell within that year.12,14
For the denominator, persistently negative testers contributed person-days at risk from their first negative test to their last negative test on record, assigned by year. For those testers who seroconverted, we assigned the time from a first negative test to any subsequent negative tests to the denominator in the same way. However, for the seroconversion interval, we calculated a fraction on the basis of the full duration of the interval and applied it evenly to each day in the interval (e.g., if there were 200 days between the previous negative tests and the positive test, we assigned each day of the interval 1/200th of a seroconversion).12,14 Data were available from April 19, 1992, to September 7, 2012, and we calculated rates using all data.
Finally, we used Poisson regression to evaluate the effect of age and gender on incidence rates over time. We have reported covariate effect magnitude as rate ratios (RRs) and adjusted rate ratios (ARRs). Because of the distinct year–periods and our interest in more recent trends, we used data from all years in the calculation of numerator and denominator but focused the Poisson model on the rates from 2000 to 2011. To represent the variation in incidence rate by age between men and women, we used a composite age–gender variable and adjusted for the relative numbers of linked tests in the multivariate model.
RESULTS
Between April 19, 1992, and September 7, 2012, the British Columbia Public Health Microbiology and Reference Laboratory performed 1 774 262 anti-HCV tests (excluding repeat positive tests) among 1 174 858 unique testers. Of these, 27.5% (323 598 testers; 55.0% women) had 2 or more tests between 1992 and 2012. Among these repeat testers, 7490 (2.3%) had seroconverted, and the remainder was negative at their last test on record. More than half of seroconversions (56.0%; n = 4080) were among men. Men who seroconverted were older at diagnosis (mean = 33.6 years; SD = 11.0 years; median = 35.0 years; interquartile range = 28–44 years) than were women seroconverters (mean = 33.6 years; SD = 11.3 years; median = 32 years; interquartile range = 25–41 years). Among repeat testers, 455 men (11.2%) and 750 women (23.3%) were diagnosed when younger than 25 years.
Testing Patterns
From 1992 to 2012, there was substantial annual growth in the number of tests and unique testers, both first time and repeat (Figure 1). Furthermore, the proportion of all unique testers undergoing anti-HCV testing in a particular year that had a previous test on record also increased over time; by 2011, 45% of all testers were repeat testers. From 2000 to 2011, there were approximately 15% more female than male repeat testers each year.
FIGURE 1—
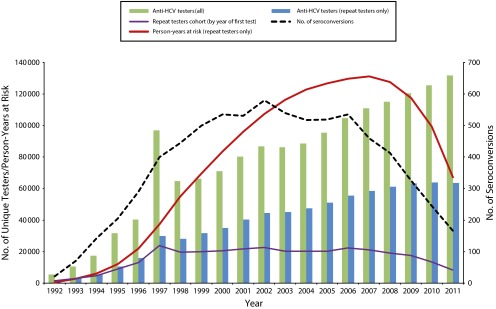
All anti-HCV testers compared with repeat testers, numbers and person-years at risk in the repeat testers cohort: British Columbia, Canada, 1992–2011.
The annual number of seroconversions increased sharply through the early years, peaked in 2002, and decreased fairly rapidly thereafter. Finally, the count of repeat testers entering the cohort, defined as year of first test, was fairly steady throughout the middle years but fell off in the final few years of observation, as did the annual sum of person-years, which is related to the effect of data truncation at the edge years (Figure 1).
Over all years, the mean intertest interval per person was shorter among seroconverters than among persistently negative testers (2.12 years; SD = 2.23 years vs 2.59 years; SD = 2.92 years; P ≤ .001). The mean number of linked tests per person was higher in seroconverters than in persistently negative testers (3.23 tests; SD = 2.00 tests vs 2.84 tests; SD = 1.00 test; P ≤ .001). The mean length of follow-up time (from first to last test on record) per person did not differ (4.73 years; SD = 5.21 years among seroconverters and 4.77 years; SD = 5.67 years in persistently negative testers; P = .44).
Incidence Rates
Across the 20 years, HCV incidence rates decreased sharply in the 1990s and more gradually in the 2000s. Overall, rates decreased from 2.66 to 0.25 cases per 100 person-years. Men had a higher incidence than did women across all years, with a similar slope, although the gap narrowed over time (Figure 2).
FIGURE 2—
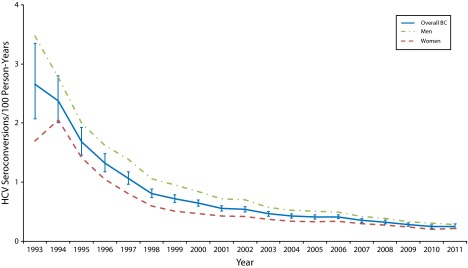
HCV incidence rates among repeat anti-HCV testers: British Columbia, Canada, 1993–2011.
Note. BC = British Columbia.
The highest overall incidence was among those aged 15 to 24 years, ranging from a high of 6.91 HCV seroconversions per 100 person-years (95% CI = 4.77, 9.68) in 1994 to a low of 0.36 (95% CI = 0.27, 0.46) in 2010. The lowest incidence was in those aged 55 years and older, ranging from 0.80 HCV seroconversions per 100 person-years (95% CI = 0.21, 2.08) in 1993 to 0.10 (95% CI = 0.06, 0.16) in 2008. Across all ages, men’s rates were higher than were those of same-aged women (Figure 3).
FIGURE 3—

HCV incidence rates among repeat anti-HCV testers by age group in (a) 1993–2011 and (b) 2000–2011: British Columbia, Canada.
In the multivariable model (Table 1), the adjusted rates for men were higher than were those for women in the same age strata, except in the youngest group (15–24 years). There was an age gradient seen in both men and women. Women had higher denominator time, a proxy for repeat testing behavior, than did males across all age strata except the 55 years or older strata. The largest difference was in those aged 15 to 24 years, with very low denominator time among the youngest men.
TABLE 1—
Univariate and Multivariable Poisson Analysis of Factors Associated With Repeated Seroconversion Hepatitis C Virus Tests: British Columbia, Canada, 2000–2011
| Agea–Gender Group | Testers, No.b (%) | Linked Test Volumes,b No. | Person-Years | Seroconversions, No. | RR (95% CI) | ARR (95% CI) |
| Men | 135 009 (44.7) | 387 289 | 569 776 | |||
| Age, y | ||||||
| 15–24 | 18 009 (6.0) | 50 621 | 68 419 | 530 | 7.98 (6.37, 10.00) | 7.52 (6.00, 9.42) |
| 25–34 | 35 423 (11.7) | 104 774 | 153 254 | 1 012 | 6.81 (5.48, 8.46) | 9.15 (7.34, 11.42) |
| 35–44 | 32 792 (10.9) | 93 914 | 148 814 | 807 | 5.59 (4.49, 6.97) | 6.96 (5.58, 8.68) |
| 45–54 | 22 641 (7.5) | 63 970 | 102 818 | 374 | 3.75 (2.97, 4.73) | 3.89 (3.08, 4.90) |
| ≥ 55 | 26 144 (8.7) | 74 010 | 96 471 | 150 | 1.59 (1.22, 2.07) | 1.74 (1.34, 2.26) |
| Women | 166 745 (55.3) | 471 104 | 721 909 | |||
| Age, y | ||||||
| 15–24 | 29 155 (9.7) | 84 711 | 122 740 | 787 | 6.59 (5.29, 8.21) | 7.13 (5.72, 8.89) |
| 25–34 | 51 671 (17.1) | 147 085 | 229 079 | 773 | 3.47 (2.79, 4.32) | 5.96 (4.50, 7.15) |
| 35–44 | 37 889 (12.6) | 106 792 | 166 965 | 519 | 3.18 (2.54, 3.99) | 4.05 (3.22, 5.09) |
| 45–54 | 23 794 (7.9) | 67 019 | 111 314 | 185 | 1.73 (1.34, 2.22) | 1.71 (1.33, 2.21) |
| ≥ 55 | 24 236 (8.0) | 65 497 | 91 811 | 89 | 1.00 (Ref) | 1.00 (Ref) |
Note. ARR = adjusted rate ratio; CI = confidence interval; RR = unadjusted rate ratio. The multivariable model uses a composite age–gender variable, health region (not shown), and linked test volumes.
We estimated age as the age at the midpoint between a tester’s first and last test.
For number of testers and linked test volumes, we included all testers and tests from 1992 to 2012 to show overall distribution.
DISCUSSION
This HCV repeat tester cohort cannot be directly characterized in terms of risk factors. However, there is clear evidence that HCV transmission patterns have evolved over the past 20 years in Canada and elsewhere, and injection drug use has increasingly become the primary risk factor.2,3,6,11,15,16 Referral for HCV testing is determined by patient risk factors, and repeat testers differ from single negative or first-time positive testers. Jayaraman et al. found that HIV repeat testers in Alberta, Canada were more likely than were single testers to be women, to be diagnosed younger, and to indicate injection drug use as their primary risk factor.17 In British Columbia, limited enhanced surveillance data on acute HCV cases between 2000 and 2011 showed 81% reported injecting drugs and 38% had been previously incarcerated.18
Other, lower risk groups may be a part of the repeat testers’ cohort, such as baby boomers (born 1945–1965) and women who are pregnant. In 2007 to 2011, 25% of British Columbian women undergoing prenatal screening were tested for HCV, with repeat testing occurring across pregnancies.19 Some women are tested on the basis of recent injection drug use, and others are tested because of historical risk factors or lack of risk information. Baby boomers tend to have remote risk factors. Although there are baby boomers in this cohort, there is evidence that most infected baby boomers are untested20 and, thus, would be first-time testers largely excluded from our analysis. We concluded that the incidence trends we have reported are predominantly among PWID.21
We saw a substantial decrease in HCV incidence rates, in keeping with national and international evidence that incidence of HCV infection in developed countries is decreasing among PWID.1–3,22 This is attributed to high HCV prevalences among PWID, creating a saturation effect, as well as changing patterns of injection-related risk behaviors. These changes include a decrease in the level of used syringe sharing, related to harm reduction programs, and a shift from injection to crack cocaine smoking, related to drug availability, as well as individuals' efforts to mitigate self-harm.23–26 The British Columbia Harm Reduction Program has evolved in several key ways, resulting in the increased availability of clean needles and syringes, cookers, and sterile water for safer injection and reduced barriers for PWID in accessing supplies throughout the province.27 A decrease in new positive HIV cases in British Columbia has been observed since mid-2007, particularly in PWID aged 20 to 39 years, which may also be attributed in part to these factors.28,29
We found a decrease in denominator time and in new entrants to the repeat testing cohort toward the edge years. Repeat testers entering the cohort in the edge years have had less follow-up time. These new entrants are shorter-interval repeat testers likely at higher risk for acquiring infection than are the longer-interval testers. This bias tends to artifactually inflate edge year rates.12,30 Despite this, we observed a rate decrease each year from 2006 to 2010, with effectively no difference between 2010 and 2011. To mitigate this bias we did not calculate incidence for the first (1992) and last (2012) years of data available.
Kent et al. reported on bias in sexually transmitted infection incidence estimates, which rely on passive retrospective cohorts developed from health services data in which the calculated incidence drops markedly as the analytic period lengthens.30 This concern applies to our analysis, which took place during a long analytic period. Although we concluded that our cohort is generally made up of high-risk PWID, the longer analytic period will increase the capture of lower risk, longer-interval testers and result in lower overall rates but not analyses with shorter analytic periods.
This method is sensitive to changes in the risk profile of testers and changes in testing patterns, for example, if people most at risk tested less over time or if comparatively lower risk persons tested more frequently. We are unaware of evidence to suggest dramatic changes in risk profiles of British Columbia testers. HCV testing numbers and repeat testing numbers have steadily increased annually, and provincial testing initiatives continue to focus on outreach activities to improve testing rates in hard-to-reach, at-risk groups, and cotesting for HCV among individuals diagnosed with HIV and other sexually transmitted infections. Altogether, we concluded that there was real decline in HCV incidence, which we conservatively estimated by this methodology.
The trends and relative risks this method demonstrates remain useful for monitoring whether it can be reasonably known that there were no significant fluctuations in rates of testing according to HCV risk. No major changes to HCV screening policies, such as recommendations for screening baby boomers or screening mixed risk groups (e.g., all emergency admissions), were implemented in British Columbia during the study period. If implemented, they may affect the future validity of this incidence estimation method.
Women in the youngest age group had higher rates than did their same-aged male counterparts. Women of all ages are more likely to access health services, including HCV testing and care,19,31,32 whereas HCV testing is very low in young men, which may reflect less interaction with the health care system. For young repeat testers, this method may not provide accurate incidence estimates, and rates from cohort studies may better overcome the interpretative challenges of underlying gender differences in testing behavior.
In our data, men were more likely to be positive at first test,32 and we excluded these men from our analysis, potentially underestimating men’s rates. Recently, van der Helm et al. analyzed HCV incidence in an HIV cohort by using both standard incidence estimation methods and a method to allow the use of data from HCV cases without a previous negative test on record.33 Overall, rates by both methods were comparable, but the authors preferred the approach including the censored cases because it made better use of available data. Although the repeat tester methodology we applied is useful for tracking trends over time, it could be enhanced by including data from cases that were positive at first HCV test.
Methodologically, estimating HCV incidence is challenging, and the repeat tester method represents an approach that is available to regions with centralized testing and can be applied in a timely, cost-effective manner to track trends in HCV incidence rates. Interpreting results from this method requires a good understanding of the limitations of methodology and background testing rates in the population and is most accurate when testing numbers are high and steady across all groups. The quality of incidence estimates would benefit from approaches to include censored individuals and to handle selection and truncation biases.33
To address the current lack of risk factors, estimates may be reproduced in specific stable settings where risk factors are known. Because of the challenges and limitations of HCV incidence estimation, triangulation of methods is important in confirming both the magnitude of estimates and the trends (e.g., traditional acute case surveillance, standard incidence estimation methods, and methods that allow the inclusion of first-time positives and correct for truncation).
From a public health perspective, monitoring this core group is important because efforts to improve treatment uptake, adherence, and retention in care among HCV-infected PWID are key to achieving a population-level reduction of HCV burden.4 These data also remind us that at-risk individuals who are engaged in repeat testing for HCV are in contact with service providers before their HCV infection. Seroconverters had both a greater number of tests and tested more frequently than did persistently negative testers. This indicates missed prevention opportunities and underlines the need for intensifying the work being done to fully engage PWID, particularly men and younger persons, in a range of services, including harm reduction, addictions treatment, prevention education, and novel initiatives to remove barriers in health infrastructure and empower PWID in decisions that affect their health.
Acknowledgments
A. N. Burchell was supported by a Canadian Institute of Health Research New Investigator Award.
We would like to thank Liviana Calzavara for supporting this work and agreeing to provide sample incidence estimation programming for application to these data. We would also like to acknowledge the contributions of Elisa Lloyd-Smith, A. K. M. Moniruzzaman, Amanda Yu, and Darrel Cook.
Human Participant Protection
No protocol approval was necessary because the British Columbia Centre for Disease Control (BCCDC), in partnership with the British Columbia Public Health Microbiology and Reference Laboratory, has the legal authority, under the British Columbia Public Health Act, to steward and link laboratory and surveillance data for communicable disease surveillance and a mandate to conduct public health evaluations. Nominal data linkage was conducted in a secure environment in keeping with BCCDC stewardship policies, and resulting analytic data sets were de-identified.
References
- 1.Mohd Hanafiah K, Groeger J, Flaxman AD, Wiersma ST. Global epidemiology of hepatitis C virus infection: new estimates of age-specific antibody to HCV seroprevalence. Hepatology. 2013;57(4):1333–1342. doi: 10.1002/hep.26141. [DOI] [PubMed] [Google Scholar]
- 2.Aceijas C, Rhodes T. Global estimates of prevalence of HCV infection among injecting drug users. Int J Drug Policy. 2007;18(5):352–358. doi: 10.1016/j.drugpo.2007.04.004. [DOI] [PubMed] [Google Scholar]
- 3.Nelson PK, Mathers BM, Cowie B et al. Global epidemiology of hepatitis B and hepatitis C in people who inject drugs: results of systematic reviews. Lancet. 2011;378(9791):571–583. doi: 10.1016/S0140-6736(11)61097-0. [DOI] [PMC free article] [PubMed] [Google Scholar]
- 4.Grebely J, Matthews GV, Lloyd AR, Dore GJ. Elimination of hepatitis C virus infection among people who inject drugs through treatment as prevention: feasibility and future requirements. 2013;57(7):1014–1020. doi: 10.1093/cid/cit377. [DOI] [PubMed] [Google Scholar]
- 5.Wedemeyer H, Duberg AS, Buti M et al. Strategies to manage hepatitis C virus (HCV) disease burden. J Viral Hepat. 2014;(suppl 1):60–89. doi: 10.1111/jvh.12249. [DOI] [PubMed] [Google Scholar]
- 6.Hajarizadeh B, Grebely J, Dore GJ. Epidemiology and natural history of HCV infection. Nat Rev Gastroenterol Hepatol. 2013;10(9):553–562. doi: 10.1038/nrgastro.2013.107. [DOI] [PubMed] [Google Scholar]
- 7.Liang TJ, Ghany MG. Current and future therapies for hepatitis C Virus infection. N Engl J Med. 2013;368(20):1907–1917. doi: 10.1056/NEJMra1213651. [DOI] [PMC free article] [PubMed] [Google Scholar]
- 8.Page-Shafer K, Pappalardo BL, Tobler LH et al. Testing strategy to identify cases of acute hepatitis C virus (HCV) infection and to project HCV incidence rates. J Clin Microbiol. 2008;46(2):499–506. doi: 10.1128/JCM.01229-07. [DOI] [PMC free article] [PubMed] [Google Scholar]
- 9.Seattle STD/HIV Prevention Training Study Center. Hepatitis web study. Available at: http://depts.washington.edu/hepstudy/hepC/clindx/acute/discussion.html. Accessed December 16, 2013.
- 10.Society of Obstetricians and Gynaecologists of Canada. The reproductive care of women living with hepatitis C infection. 2000. Available at: http://sogc.org/guidelines/the-reproductive-care-of-women-living-with-hepatitis-c-infection. Accessed March 1, 2015.
- 11.Public Health Agency of Canada. Hepatitis C in Canada: 2005–2010 Surveillance Report. Ottawa, Canada: Centre for Communicable Disease and Infection Control, Infectious Disease Prevention and Control Branch; 2012. [Google Scholar]
- 12.Calzavara L, Burchell AN, Major C et al. Increases in HIV incidence among men who have sex with men undergoing repeat diagnostic HIV testing in Ontario, Canada. AIDS. 2002;16(12):1655–1661. doi: 10.1097/00002030-200208160-00011. [DOI] [PubMed] [Google Scholar]
- 13.Grewal R, Allen V, Gardner S Incidence of chlamydia and gonorrhea co-infection among HIV-positive men who have sex with men in Ontario. Paper presented at the Ontario HIV Treatment Network 2013 Research Conference: Changing the Course of the HIV Prevention, Engagement, and Treatment Cascade. Toronto, ON, Canada; November 17–19, 2013.
- 14.Kitayaporn D, Uneklabh C, Weniger BG et al. HIV-1 incidence determined retrospectively among drug users in Bangkok, Thailand. AIDS. 1994;8(10):1443–1450. doi: 10.1097/00002030-199410000-00011. [DOI] [PubMed] [Google Scholar]
- 15.Esteban JI, Sauleda S, Quer J. The changing epidemiology of hepatitis C virus infection in Europe. J Hepatol. 2008;48(1):148–162. doi: 10.1016/j.jhep.2007.07.033. [DOI] [PubMed] [Google Scholar]
- 16.Shepard CW, Finelli L, Alter MJ. Global epidemiology of hepatitis C virus infection. Lancet Infect Dis. 2005;5(9):558–567. doi: 10.1016/S1473-3099(05)70216-4. [DOI] [PubMed] [Google Scholar]
- 17.Jayaraman GC, Bush KR, Lee B, Singh AE, Preiksaitis JK. Magnitude and determinants of first-time and repeat testing among individuals with newly diagnosed HIV infection between 2000–2001 in Alberta, Canada. J Acquir Immune Defic Syndr. 2004;37(5):1651–1656. doi: 10.1097/00126334-200412150-00020. [DOI] [PubMed] [Google Scholar]
- 18.BC Centre for Disease Control. Statistics and research. 2012. Available at http://www.bccdc.ca/dis-cond/a-z/_h/HepatitisC/statsres/default.htm. Accessed April 14, 2012.
- 19.Kuo M, Money DM, Alvarez M et al. Test uptake and case detection of syphilis, HIV, and hepatitis C among women undergoing prenatal screening in British Columbia, Canada, 2007–2011. J Obstet Gynaecol Can. 2014;36(6):482–490. doi: 10.1016/S1701-2163(15)30561-2. [DOI] [PubMed] [Google Scholar]
- 20.Smith BD, Beckett GA, Yartel A, Holtzman D, Patel N, Ward JD. Previous exposure to HCV among persons born during 1945–1965: prevalence and predictors, United States, 1999–2008. Am J Public Health. 2014;104(3):474–481. doi: 10.2105/AJPH.2013.301549. [DOI] [PMC free article] [PubMed] [Google Scholar]
- 21.Fernyak SE, Page-Shafer K, Kellogg TA, McFarland W, Katz MH. Risk behaviors and HIV incidence among repeat testers at publicly funded HIV testing sites in San Francisco. J Acquir Immune Defic Syndr. 2002;31(1):63–70. doi: 10.1097/00126334-200209010-00009. [DOI] [PubMed] [Google Scholar]
- 22.British Columbia Centre for Excellence in HIV/AIDS. Drug situation in Vancouver (UHRI report) 2013. Available at: http://www.cfenet.ubc.ca/publications/drug-situation-vancouver-uhri-report. Accessed December 16, 2013.
- 23.de Vos AS, van der Helm JJ, Matser A, Prins M, Kretzschmar ME. Decline in incidence of HIV and hepatitis C virus infection among injecting drug users in Amsterdam; evidence for harm reduction? Addiction. 2013;108(6):1070–1081. doi: 10.1111/add.12125. [DOI] [PubMed] [Google Scholar]
- 24.Persaud S, Tzemis D, Kuo M, Bungay V, Buxton JA. Controlling chaos: the perceptions of long-term crack cocaine users in Vancouver, British Columbia, Canada. J Addiction. 2013;2013:851840. doi: 10.1155/2013/851840. doi:10.1155/2013/851840. [DOI] [PMC free article] [PubMed] [Google Scholar]
- 25.Fischer B, Gittins J, Kendall P, Rehm J. Thinking the unthinkable: could the increasing misuse of prescription opioids among street drug users offer benefits for public health? Public Health. 2009;123(2):145–146. doi: 10.1016/j.puhe.2008.10.006. [DOI] [PubMed] [Google Scholar]
- 26.Health Canada. Canadian alcohol and drug use monitoring survey. 2011. Available at: http://www.hc-sc.gc.ca/hc-ps/drugs-drogues/stat/_2011/summary-sommaire-eng.php. Accessed April 14, 2014.
- 27.BC Harm Reduction Strategies and Services Committee. Harm reduction supplies. Available at: http://towardtheheart.com/ezine/7/harm-reduction-supplies. Accessed March 1, 2015.
- 28.Gilbert M, Buxton J, Tupper K . Decreasing HIV Infections Among People Who Use Drugs by Injection in British Columbia: Potential Explanations and Recommendations for Further Action. Victoria, Canada: Office of the Provincial Health Officer, Ministry of Health; 2011. [Google Scholar]
- 29.BC Centre for Disease Control. Annual reports. Available at: http://www.bccdc.ca/util/about/annreport/default.htm. Accessed May 15, 2014.
- 30.Kent CK, Chaw JK, Kohn RP, Chen YQ, Klausner JD. Studies relying on passive retrospective cohorts developed from health services data provide biased estimates of incidence of sexually transmitted infections. Sex Transm Dis. 2004;31(10):596–600. doi: 10.1097/01.olq.0000140011.93104.32. [DOI] [PubMed] [Google Scholar]
- 31.Jayaraman GC, Lee B, Singh AE, Preiksaitis JK. Trends in testing behaviours for hepatitis C virus infection and associated determinants: results from population-based laboratory surveillance in Alberta, Canada (1998–2001) J Viral Hepat. 2007;14(4):249–254. doi: 10.1111/j.1365-2893.2006.00820.x. [DOI] [PubMed] [Google Scholar]
- 32.Shadmani R, Pourbohloul B, Butt G Population-based analysis of acute hepatitis C virus (HCV) infections and spontaneous virological resolution based on gender and age in British Columbia, Canada. Paper presented at the 40th Annual Meeting of the European Association for the Study of the Liver; April 13–17, 2005; Paris, France.
- 33.van der Helm JJ, Prins M, del Amo J et al. The hepatitis C epidemic among HIV-positive MSM: incidence estimates from 1990 to 2007. AIDS. 2011;25(8):1083–1091. doi: 10.1097/QAD.0b013e3283471cce. [DOI] [PubMed] [Google Scholar]