

Abstract
P-glycoprotein (P-gp) can actively pump paclitaxel (PTX) out of cells and induces drug resistance. Abraxane, a nanoparticle (NP) formulation of PTX, has multiple clinical advantages over the single molecule form. However, it is still unclear whether Abraxane overcomes the common small molecule drug resistance problem mediated by P-gp. Here we were able to establish an Abraxane-resistant cell line from the lung adenocarcinoma cell line A549. We compared the transcriptome of A549/Abr resistant cell line to that of its parental cell line using RNA-Seq technology. Several pathways were found to be up or down regulated. Specifically, the most significantly up-regulated gene was ABCB1, which translates into P-glycoprotein. We verified the overexpression of P-glycoprotein and confirmed its function by reversing the drug resistance with P-gp inhibitor Verapamil. The results suggest that efflux pathway plays an important role in the Abraxane-resistant cell line we established. However, the relevance of this P-gp mediated Abraxane resistance in tumors of lung cancer patients remains unknown.
Background
Drug delivery via nanoparticle-based carriers has shown promising pharmacological improvements in cancer therapy [1, 2] Nanoparticle albumin-bound paclitaxel (Abraxane) has been approved by FDA for use in patients with metastatic breast cancer and Non-small-cell lung carcinoma (NSCLC) [3, 4]. Abraxane is a 130 nm albumin-bound particle form of paclitaxel (PTX), which is a member of the taxane family and an important agent in cancer chemotherapy. PTX acts by binding to microtubules and interfering with the mitotic process [5]. The clinical implementation of PTX was limited by its poor water solubility. Abraxane is less toxic and improves the drug effect in tumor through enhanced permeability and retention (EPR) effect [6]. Furthermore, the transcytosis of albumin-bound paclitaxel across the endothelial barrier is facilitated by its binding to the gp60 receptor and caveolar transport. In the tumor interstitial space, albumin-paclitaxel complexes bind to the Secreted Protein Acidic and Rich in Cysteine (SPARC), which is overexpressed in a majority of tumors [7], to achieve enhanced drug targeting and penetration in tumors [8].
The efficacy of chemotherapy of cancer is impeded by drug resistance, either because tumor cells intrinsically resist drug action, or the tumor cells initially respond to therapy, after which there is selection for cells in the population capable of circumventing drug action [9]. A lot is known about acquired resistance by generation of the cell models in the laboratory. These mechanisms include decreased drug uptake into cells, increased drug efflux, activation of detoxifying enzymes (e.g. cytochrome P450), activation of DNA repair system, and inhibition of apoptotic signaling pathways [10]. Increasing drug efflux by overexpression of ATP-binding cassette (ABC) transporters is a common mechanism for cellular resistance to paclitaxel and other anticancer agents such as Doxorubicin (DOX) and vinblastine [10, 11]. ABCB1 belongs to ABC transporter family and encodes a membrane protein P-glycoprotein (P-gp), which is a well-known efflux pump responsible for multiple drug resistance (MDR)[12]. Cells resist PTX were found to exhibit cross-resistance to a variety of other hydrophobic drugs and to have elevated levels of P-gp[10]. Besides the efflux pump, mechanisms of resistance to taxane family drugs also include alterations in the growth characteristics, overproduction of mutant p53 and spontaneous mutations [13, 14], as well as alteration of microtubule composition or dynamics [15], and overexpression of Bcl-2 [16].
It is widely recognized that nano-formulations of drugs can be used to overcome P-gp mediated resistance and a lipid-based PTX nanoparticle was reported to have such feature [17]. In this study, Dong et. al suggested that two major reasons for enhanced cytotoxicity of DOX or PTX lipid-based NPs in P-gp mediated resistance: 1) increased drug uptake by endocytosis that bypasses P-gp and 2) decreased efflux rate through inhibition of P-gp function caused by Brij 78, a surfactant component in NPs [17]. Similarly, the enhanced antitumor activity of Abraxane might relate to increased intra-tumor PTX concentration as reported in one preclinical study [18]. But whether albumin-bound PTX nanoparticle can overcome the drug resistance problem mediated by P-gp is unclear [4]. Zhang et al. show that PTX relapsed tumors developed resistance against paclitaxel, but not to Abraxane [19]. However, whether the mechanism of the resistant tumor in this study is via P-gp is unknown. Stordal et al. reported that resistance of PTX in a cisplatin-resistant ovarian cancer cell line is mediated by P-gp [20]; unfortunately, no test on Abraxane resistance was performed in this work. The excipient of Abraxane is human albumin solution containing albumin, sodium, sodium caprylate and N-acetyl tryptophanate. None of them have been reported to affect P-gp activity. Albumin-bound PTX rapidly decreased its size from 130 nm to proximately 24nm and 10 nm following dilution in plasma to different concentrations. [21]. Gardner et al. developed an assay to quantitate total and unbound paclitaxel in human plasma following Abraxane treatment of patients. They found the unbound form was 6.4% of total drug and does not vary with time [22]. Since PTX is noncovalently bound to Albumin, it is quite possible that PTX might dissociate from albumin and cause the same cytotoxicity and resistance to cells as treatment of free PTX. After Abraxane enters the cell by endocytosis as most nanoparticles [23] or assists by SPARC as mentioned above [8], however, so far there is no detailed study on how Abraxane behaves inside the cell. Presumably, a steady state will be achieved where some drug is bound to albumin and some is dissociated as free form. However, the dissociation constant and time to reach the steady state is not clear. According to the calculation based on the P-gp crystal model, the entrance of the P-gp channel is 2.2 nm and the widest part is 3 nm, which is smaller than many NPs. The size-exclusion effect was assumed to contribute to the anti-resistance effect of some NP-formulated medicines [24]. Thereforeif albumin-bound form is the majority one inside cells, P-gp will not be induced to resist Abraxane. Then, will cells develop resistance against Abraxane? And if yes, what can be the mechanisms involved?
To answer these questions, first we stepwisely increased the concentration of Abraxane added to the drug sensitive non-small-cell lung line (NSCLC) A549. After 6 months we were able to successfully establish an Abraxane-resistant NSCLC cell line (A549/Abr) with an IC50 of 1314.66±25.29nM, whereas the IC50 for A549 sensitive cell is 11.06±1.06nM. We then characterized the changes in cell morphology and cell proliferation. Finally, the transcriptomic profile analysis was carried out on both A549/Abr and A549 using RNA-Seq technology, with the aim to find out the molecular mechanisms involved in the resistance of Abraxane.
Methods
Drugs and chemicals
Abraxane was obtained from Celgene Co. (Summit, NJ, USA). PTX, docetaxel (DTX), Doxorubicin (DOX), Cisplatin (CDDP) and fluorouracil (5-FU) were procured from the Zhejiang Hisun Pharmaceutical Factory (China); Verapamil (VP) from Acros Organics Co. (Geel, BE). The antitumor cyclic hexapeptide RA-V [25], isolated from a Chinese natural medicine, the roots of Rubia yunnanensis, was a gift from Ninghua Tan’s group at Kunming Institute of Botany, Chinese Academy of Sciences. Propidium iodide (PI), RNase A and MTT (3-(4,5-dimethyl-thiazol-2-yl)-2,5-diphenyl tetrazolium bromide) were purchased from Sigma Aldrich (St. Louis, MO, USA); DMSO from Amresco Inc. (Solon, OH, USA). Anticancer agents were prepared extemporaneously in complete culture medium immediately prior to in vitro use.
In situ TEM
Abraxane was characterized by in situ wet-cell transmission electron microscopy (TEM) before the establishment of drug-resistant cell line. Sample was prepared by suspending the Abraxane powder in deionized water, with a final PTX concentration of 10 μM. Sample was added between two silicon nitride window grids in an in situ TEM cell. The details of the in situ cell structure have been reported earlier [26, 27]. The silicon nitride window grids with 50 nm membrane thickness were purchased from Ted Pella, Inc. Samples were observed with JEOL JEM-2100 TEM system, which was operated under a 200 kV electron acceleration voltage.
Cell culture and induction of drug resistance
The human non-small-cell lung carcinoma (NSCLC) cell line, A549, was maintained in Dulbecco’s modified Eagle medium/high glucose (DMEM/H; Thermo Scientific, USA) supplemented with 10% (v/v) fetal bovine serum (FBS; Thermo Scientific, USA), 100 U/mL penicillin (Gibco BRL, Grand Island, NY), and 100 μg/mL streptomycin (Gibco BRL, Grand Island, NY) in a highly humidified atmosphere with 5% CO2 at 37°C. Cells were passed at preconfluent densities using a solution containing 0.05% trypsin and 0.5 mM EDTA (Life Technologies, Gaithersburg, MD, USA), when the density became 80–90%.
Abraxane-resistant cell line A549/Abr was induced by exposing A549 cells to Abraxane in stepwise increment of concentrations ranging from 10 to 400 nM for over 6 months. To be specific, Abraxane was reconstituted with sterile 0.9% w/v sodium chloride injection (Shijiazhuang No.4 Pharmaceutical Co., China) prior to use, resulting in an effective PTX concentration of 50 μM. When the cells were in logarithmic growth phase, Abraxane was added to the medium to a final concentration of 10 nM as start. From then, at every 24-hour incubation interval, medium was discarded and replaced with fresh one with the same Abraxane concentration. Cells were passed when they were 80% confluent and Abraxane of 10 nM was then added. The concentration of Abraxane was gradually increased by 10–40 nM until 400 nM when the cells had grown steadily in the drug-containing medium. If the cells could not survive, a lower Abraxane concentration was used instead to protect cells from dying. Finally, a cell line resistant to 400 nM Abraxane (named A549/Abr) was derived from A549 after 6 months. For maintenance of Abraxane-resistant cells, the A549/Abr cells were grown in the presence of 100 nM Abraxane. The cells were maintained for at least one week in drug-free medium prior to their use in the experiments. The multiple drug resistance (MDR) characteristics of these A549/Abr cells were identified using various concentrations of anticancer drugs including PTX, DTX, DOX, RA-V, CDDP and 5-FU.
Cytotoxicity assay in drug sensitive A549 cells and resistant A549/Abr cells
The in vitro cytotoxicity of Abraxane, PTX, DTX, DOX, RA-V, CDDP and 5-FU was determined by MTT assay. Briefly, A549 and A549/Abr cells at their logarithmic growth status were seeded in 96-well plates at the density of 4000 cells/well. After 24 h, the medium was aspirated, and replaced with 200 μL of media containing serial dilutions of treatment samples, including Abraxane, PTX, DTX, DOX, RA-V, CDDP and 5-FU. The concentrations of Abraxane and PTX used in each group were 1, 5, 10, 20, 40, 100, 500, 2000 nM. For DTX, the concentrations were 0.1, 1, 4, 10, 40, 100, 400, 1000 ng/mL; for DOX, 1, 10, 40, 100, 400, 1000, 4000 nM; for RA-V, 0.0002, 0.002, 0.02, 0.2, 2, 20, 100 μg/mL; for CDDP, 0.2, 1, 4, 10, 20, 40, 100, 400 μM. Finally, the concentrations of 5-FU were set as follows: 0.01, 0.1, 0.4, 2, 4, 10, 20, 40 μg/mL. After incubation for 48 h at 37°C, the drug-containing growth medium was replaced with 100 μL medium containing 10 μL of MTT (5 mg/mL in PBS). After 4 h, the culture solution was removed, leaving behind the precipitate. Thereafter, 150 μL of DMSO was added to each well to suspend the formazan crystals while vigorously stirring the plates using an automated shaker. The absorbance of each well was read on a microplate reader (Tecan, Switzerland) at a test wavelength of 570 nm. Six wells were used for each drug concentration and the experiment was repeated 3 times. Relative cell viability to untreated control cells was calculated. IC50 (concentration resulting in 50% inhibition of cell growth) value for drugs was calculated by SPSS software (version 19.0).
Cell proliferation assay
We used the MTT method to determine the cell proliferation. Herein, 4×10³ cells were plated in 96-wellplates per well. Upon analysis, 100 μL medium containing 10 μL of 5 mg/mL MTT in PBS was added to each well and the cells were incubated for another 4 h at 37°C. The supernatant was then removed, and 150 μL of DMSO was added to each well. The absorbency of each sample was measured with a microplate reader at the wavelength of 570 nm. The surviving cells were measured every day for 7 consecutive days.
Cell morphology observation
A549 and A549/Abr cells in the phase of logarithm growth were cultured in complete medium with or without 100 nM Abraxane for 24 h. Both cells were examined with the microscope (Leica, Germany) for morphology analysis.
cDNA Library preparation and sequencing
To prepare samples for RNA-Seq, we cultured A549 and A549/Abr cells in medium with or without 100 nM Abraxane for 4 h. In RNA-seq data analysis, we labeled these four differently treated cells as A549, A549/Abr, A549-100 and A549/Abr-100, respectively. Total RNA was extracted from these cells using TRIzol reagent (Invitrogen) as per the manufacturer’s instructions. RNA concentrations were determined using NanoDrop 2000 (Thermo Scientific). The integrity of RNA samples was determined using 1.2% agarose gel electrophoresis, followed by removal of the residual genomic DNA with RNase-free DNase I (Ambion). Using the Illumina mRNA-Seq library preparation kit, the cDNA library was constructed according to the manufacturer’s instructions. Transcriptome sequencing was then conducted using Illumina Hiseq 2000 Genome Analyzer platform in pair-ended manner with the read length of 100-bp.
Reads alignment to human genome
TopHat (version 2.0.3) [28] was used to align sequenced reads to the UCSC human reference genome (hg19). We used “bowtie1” parameters during the alignment procedure in TopHat, and no more than two mismatches were allowed for each read.
Gene expression levels normalization
Aligned results were presented to Cufflinks (version 2.0.2) to calculate the expression level [29]. The gene expression level was measured by the number of fragments per kilobase of transcript per million mapped fragments (FPKM, also known as RPKM [30] in single-ended sequencing experiments). The FPKM method takes account of different gene lengths and sequencing depths between genes and samples, which guarantee the comparison of gene expression among samples.
Unsupervised Cluster analysis
Logarithmic transformation of gene expression intensity was executed before clustering. Average linkage hierarchical clustering was performed in this study using Pearson distance as the distance measure between genes and samples. Computation and visualization were achieved using heatmap.plus package in R.
Differentially expressed gene identification
By using Cufflinks and cuffdiff, we identified pairwisely differentially expressed genes (DEG) based on the following criteria: fold change ≥2 (or log2 fold ≥ 1) and FDR ≤ 0.05.
Gene expression validation by qRT-PCR
Total RNA was extracted as described above and reversely transcribed using the RevertAid First Strand cDNA Synthesis Kit (Fermentas, Glen Burnie, MD). qRT-PCR was performed on the CFX96 Real-Time PCR Detection System (Bio-Rad, Hercules, CA) using Maxima SYBR Green/ROX qPCR Master Mix (Fermentas). Primers were designed using Primer 5 and PrimerBank (http://pga.mgh.harvard.edu/primerbank/index.html). The primer sequences were listed in S1 Table. Transcription levels were normalized to that of glyceraldehyde 3-phosphate dehydrogenase. The samples used for qRT-PCR were the same ones used for RNA-Seq in all groups.
Gene ontology analysis
WebGestalt [31] was used for Gene Ontology (GO) analysis with the following parameters: “hypergeometric distribution” as statistical method, “BH” as multiple test adjustment, “top10” as the significance level, and “2” as the minimum number of genes for a category. The updated Kyoto Encyclopedia of Genes and Genomes (KEGG) database [32] was used to calculate the enriched pathways of differentially expressed genes.
Gel electrophoresis and western blotting
To determine the protein level of P-gp, total protein was collected from cultured A549 and A549/Abr cells. Specifically, A549 and A549/Abr cells were washed twice with ice-cold PBS, lysed in RIPA Lysis Buffer (Boster, Wuhan, China) supplemented with 100 μg/mL PMSF. Lysis was incubated with protease inhibitor cocktail (Sigma-Aldrich, St. Louis, MO,USA) for 30 min in an ice bath, then centrifuged at 12,000 rpm for 5 min at 4°C. The concentration of total protein was measured using a BCA Protein Assay Kit (Pierce, USA). Equal amounts of protein extracts (30 μg) were separated on a 10% SDS polyacrylamide gel and then transferred onto a nitrocellulose membrane (Pall Corporation). After blocking at room temperature for 2 h in Tris-buffered saline containing 0.05% Tween 20 (TBS-T) and 5% (w/v) dry powdered milk, the membrane was washed three times for 5 min each with TBS-T. Then the membrane was incubated with primary antibodies to P-gp (Cat. No. 517310; Merck, Darmstadt, Germany) and β-actin (Santa Cruz Biotechnology, CA, USA) overnight at 4°C,washed with TBS-T and then exposed to species-specific horseradish peroxidase (HRP) conjugated secondary antibodies (abcam, Massachusetts, USA) at room temperature for 2 h. Following five washes with TBS-T, the membrane was developed for visualization of proteins by ECL chemiluminescence system (Santa Cruz, USA). A bar chart was made using ImageJ to show the intensities of the protein bands.
Statistical analysis
Each of the MTT assay, FCM and qRT-PCR was repeated at least three times. And values of one standard deviation (SD) above and below the mean values (mean±SD) were calculated. The significance of difference of the means was tested by the one-way analysis of variance (ANOVA) using SPSS software (version 19.0). Differences were considered significant when P<0.05.
Results
Characterization of Abraxane by in situ TEM
In situ transmission electron microscopy (TEM) was used to characterize the albumin-bound Paclitaxel (PTX) nanoparticle (NP) drug in deionized water (see Methods). Specifically, individual particles were suspended in deionized water and were observed to remain stable for at least 3 h (Fig 1A). The particles were roughly round shaped with varied sizes. The sizes of the particles were measured and plotted (Fig 1B). The sizes of the NPs range from 10 nm to 60 nm, with a roughly Gaussian distribution based on more than 40 particles measured. Obtaining the actual Abraxane size in liquid is important for its applications, as the pharmaceutical effect is closely related to the particle size. Our in situ TEM measurement is consistent with previous dynamic light scattering measurement [21] in that Abraxane is decomposed to smaller size after suspension.
Fig 1.
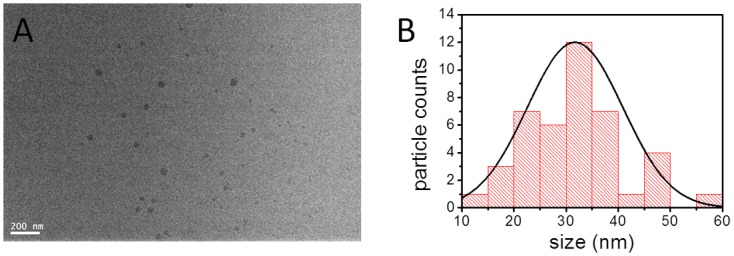
(A) In situ liquid cell TEM image of the 10 μM Abraxane solution sample, and (B) the size statistics of the albumin-bond paclitaxel particles obtained from (A). The curve in (B) is the Gaussian fit of the data.
A549/Abr cells acquired resistance to Abraxane
The Abraxane-resistant A549/Abr cell line was established by stepwisely increasing the concentration of Abraxane added to the drug sensitive non-small-cell lung carcinoma (NSCLC) cell line A549 over a period of 6 months as described in Methods. MTT assay showed the IC50 values of Abraxane for A549 cells and A549/Abr cells were 11.06±1.06nM and 1314.66±25.29nM, respectively (Fig 2A). The resistance index (RI, ratio between the IC50 of resistant and sensitive cell lines) of the A549/Abr cell line was 118.79, which indicated that an Abraxane-resistant cell line was successfully established. To check whether the resistant cell line acquires multiple drug resistance (MDR) phenotype, we exposed A549/Abr to six other antitumor agents: paclitaxel (PTX), docetaxel (DTX), doxorubicin (DOX), cisplatin (CDDP), cyclic hexapeptide RA-V and fluorouracil (5-FU). IC50 from MTT assays and RI values were summarized in Table 1, suggesting that A549/Abr cells exhibited cross-resistance to PTX, DTX, DOX and RA-V, but not to CDDP and 5-FU.
Fig 2. Establishment of Abraxane-resistant NSCLC cell line.
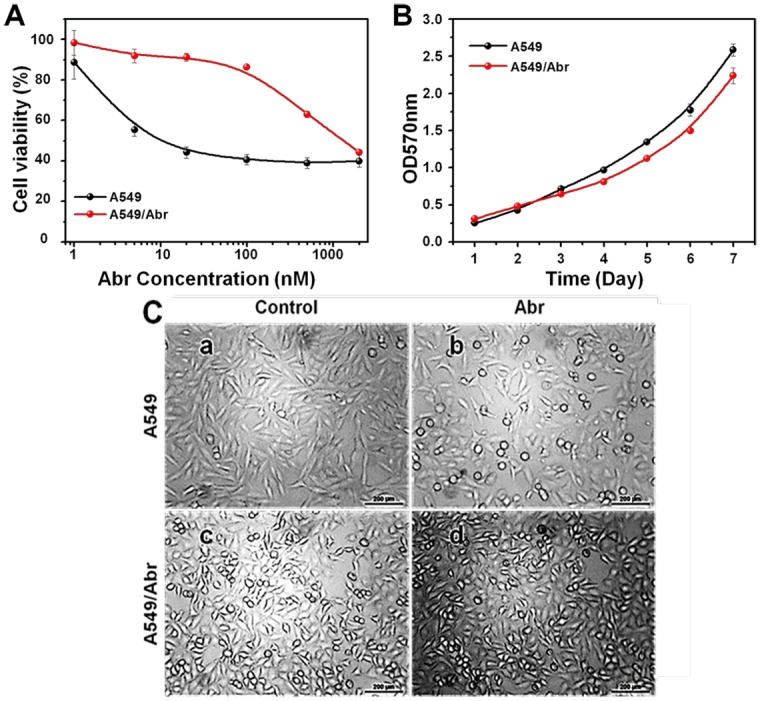
(A) The A549/Abr cell line is resistant to Abraxane. A549 (•, black) and A549/Abr (•, red) cells were treated with the indicated increasing concentrations of Abraxane for 48 h. Cell viability was detected using MTT assay. Each point represents the mean±SD of three measurements. IC50 is the concentration of Abraxane that inhibits 50% of cell proliferation. The IC50 values for the A549 and A549/Abr cells were 11.07 nM and 1314.66 nM, respectively. (B) Growth curves of both cell lines, A549 (black dots) and A549/Abr (red dots). The curves of Abr-resistant cells rise up slowly. The doubling time of A549 cells is 49.56 h and that of A549/Abr cells is 54.65 h. (C) Morphological comparison of A549 cell line and A549/Abr cell line. Effects of Abraxane on the morphologic changes in A549 and A549/Abr cells. Cells were treated with (b and d) or without (a and c) 100 nM Abraxane for 24 h and the morphologic changes were observed by microscopy.
Table 1. IC50 and RI values of A549 and A549/Abr cells.
Effects of selected drugs on both cell lines. RI means resistance index, ratios of IC50A549/Abr/IC50A549. Data represents mean±SD of at least three separate experiments. The results suggested multidrug-resistant characteristic of A549/Abr.
| IC50 (mean±SD) | ||||
|---|---|---|---|---|
| Drug | A549 | A549/Abr | RI | P |
| Abraxane(nM) | 11.07±1.06 | 1314.66±25.29 | 118.79 | <0.01 |
| PTX(nM) | 8.57±1.49 | 1412.44±17.91 | 164.88 | <0.01 |
| DTX(nM) | 1.10±0.12 | 297.91±13.65 | 270.27 | <0.01 |
| DOX(nM) | 613.21±134.90 | 1831.07±181.85 | 2.99 | <0.01 |
| RA-V(μg/mL) | 0.92±0.17 | 4.33±0.32 | 4.71 | <0.01 |
| CDDP(μM) | 259.67±15.50 | 250.24±5.63 | 0.96 | >0.05 |
| 5-FU(μM) | 42.21±3.16 | 20.74±1.87 | 0.49 | <0.05 |
A549/Abr cells show lower proliferation rate than A549 cells
The growth curves of the parent A549 cells and the drug-resistant cells showed that the proliferation rates of A549/Abr cells were lower than that of parental cells (Fig 2B). The population doubling time of A549 cells and A549/Abr cells was 49.56±5.53 h and 54.65±4.87 h, respectively (P<0.05). This indicates that the cell cycle time of A549/Abr is significantly longer than that of A549 cells by 5 hours.
A549/Abr and A549 cells show different cell morphology with or without Abraxane treatment
We further observed the changes of the cell morphology after treatment with Abraxane in both cell lines. As shown in Fig 2C, before the treatment with Abraxane, A549 cells were healthy and homogeneous in size and shape (Panel a). After treatment with 100 nM Abraxane for 24 h, A549 sensitive cells showed significant morphological changes, e.g., shrinkage in size and becoming more round or oval in shape (Panel b). As for A549/Abr cells (Panel c), more cells had the round shaped morphology, and tended to grow in clusters. Treatment with Abraxane had no obvious effect on the morphology of A549/Abr cells (Panels c and d). This suggests that the resistant cells have acquired significant morphology changes.
RNA-Seq analyses of A549 and A549/Abr cells with or without treatment of Abraxane
To understand the mechanisms leading to MDR of A549/Abr cell line, high-throughput sequencing was performed on the Hi-Seq2000 sequencing platform in parallel. We compared the genome-wide expression profile between A549 and A549/Abr cells with (A549-100 and A549/Abr-100) and without treatment (A549 and A549/Abr) of 100 nM Abraxane for 4 h. The quality of the sequencing reads was satisfied for further analysis (S1 Fig). In addition, expression profiles were highly reproducible between the two biological replicates (r2 = 0.84, p <0.0001) (S2 Fig) sequenced for A549 cell line. Approximately 21–38 million reads (100bp paired-end) were obtained and mapped to the human genome. Despite the different sequencing depths obtained for these four samples, the number of transcripts detected approached saturation for all of the samples (Fig 3A), similar to a previously reported transcriptome study [33]. The gene expression levels were measured by the number of fragments per kilobase of transcript per million mapped fragments (FPKM) as described in Methods.
Fig 3.

(A) Number of transcripts detected as a function of read depth. X-axis: number of reads (millions) mapped to the genome; Y-axis: the number of transcripts detected in genes from the National Center for Biotechnology Information (NCBI) database. (B) Correlation between qRT-PCR and RNA-Seq for selected genes in A549, A549-100, A549/Abr and A549/Abr-100 cells. The selected genes are ABCB1, ABCC1, ABCG2, MGST1, BCL2, BAX, TP53, ANXA2, HIF1A. (C) Cluster analysis of expressed genes in four cell types. Expression intensities are displayed from green (low expression) to red (high expression).
Validation of the next generation sequencing (NGS) data by qRT-PCR
To verify the sequencing result, we quantitated the expression of resistance-related genes in these four cell populations using qRT-PCR. Nine genes including three ABC transporters (ABCB1, ABCC1, ABCG2); the drug metabolism enzyme Glutathione S-Transferase Pi 1 (GSTP1); three apoptosis-related genes: B-cell CLL/lymphoma 2 (BCL2), BCL2-associated X protein (BAX) and tumor protein P53 (TP53); a calcium dependent phospholipid binding protein gene annexin A2 (ANXA2) which was identified as highly expressed in MCF-7/ADR (also called NCI/ADR-RES), a p-glycoprotein overexpressing cell line resistant to adriamycin [34, 35]; and hypoxia inducible factor 1, alpha subunit (HIF-1α) which can promote P-glycoprotein expression [36] were selected. The logarithmic transformations of FPKM values of these genes and their relative copy numbers measured by qRT-PCR were compared using methods described by Yang et. al [33]. Results of this study shown by Fig 3B revealed that RNA-Seq data has a high correlation with qRT-PCR data (p < 0.0001; R2 = 0.8326).
Hierarchical Clustering analysis
Unsupervised hierarchical cluster (Fig 3C) analysis showed that A549/Abr and A549/Abr-100 were clustered together, indicating that they shared similar expression patterns. Furthermore, A549/Abr and A549/Abr-100 clustered with A549 before they clustered with A549-100. The large variation of expression pattern of A549-100 compared to others suggests that the molecular network of sensitive cells has a large perturbation when short-term exposed to drug and the perturbation was much different from the resistant cells which had been long-term exposed to Abraxane.
Unique classes of differentially expressed genes by the treatment of Abraxane
Using a 2-fold and FDR ≤ 0.05 cutoff for differential expression identification (see Methods), we found 61 differentially expressed genes (DEG) between A549 group and Abraxane treated A549-100 group. Gene Ontology analysis found that these genes were significantly enriched in cytoskeleton, basolateral plasma membrane, and intrinsic apoptotic signaling pathway in response to endoplasmic reticulum stress (Table 2). Genes such as DNA-damage-inducible transcript 3 (DDIT3), cation transport regulator homolog 1 (CHAC1) and tribbles pseudokinase 3 (TRIB3) which are related with apoptosis [37–39], were up-regulated in A549-100 cells, suggesting Abraxane treatment induced apoptosis in A549 cells. Most of the genes related with cytoskeleton were down-regulated in A549-100 compared with A549 cells, which might be the feedback response to the pharmacological effect of Abraxane, as the effective component PTX can stabilize the microtubules by preventing depolymerization thus affecting the cytoskeleton.
Table 2. GO enrichment of differentially expressed genes between A549 and A549-100.
| GO terms | adjP |
|---|---|
| cloaca development | 0.0155 |
| regulation of epithelial cell differentiation | 0.0155 |
| intrinsic apoptotic signaling pathway in response to endoplasmic reticulum stress | 0.0155 |
| developmental process | 0.0155 |
| photoreceptor cell outer segment organization | 0.0155 |
| regulation of developmental process | 0.0258 |
| nephric duct morphogenesis | 0.0282 |
| system development | 0.0282 |
| organic acid biosynthetic process | 0.0282 |
| cardiac muscle fiber development | 0.0282 |
| structural constituent of cytoskeleton | 0.011 |
| basolateral plasma membrane | 0.0018 |
| cell-cell junction | 0.0021 |
| adherens junction | 0.0168 |
| anchoring junction | 0.0177 |
| cytoskeleton | 0.0323 |
| keratin filament | 0.0449 |
| tight junction | 0.0449 |
| cell junction | 0.0449 |
| occluding junction | 0.0449 |
P-gp was significantly up-regulated in A549/Abr cells
Differential expression analysis using Kyoto Encyclopedia of Genes and Genomes (KEGG) database[32] identified that ABC transporters were up-regulated in MDR cells in A549/Abr vs A549, A549/Abr-100 vs A549, A549/Abr vs A549-100, and A549/Abr-100 vs A549-100 comparisons, of which ABCB1 (P-gp) changed most significantly (log2(FC)>9) (see Fig 4 and S3 Fig). 35 significantly differentially expressed genes (DEGs) between A549 and A549/Abr were shown in Table 3, among which 16 were up-regulated and 19 were down-regulated. Gene Ontology (GO) enrichment of DEGs between A549 and A549/Abr cells were summarized in S2 Table. Terms such as “response to wounding”, “response to stimulus”, “inflammatory response” and “extracellular region” were identified, indicating genes constitutively expressed in resistant cell lines with response to long-term Abraxane stimulation.
Fig 4. ABC transporters are significantly up-regulated in MDR cells compared with A549 parental cells.

This figure shows the expression changes between A549/Abr and A549, other comparisons are included in S3 Fig.
Table 3. Differentially expressed genes between A549 and A549/Abr cells.
| Gene | A549-P | A549-R-0 | log2(Fold change) | Up/Down regulation |
|---|---|---|---|---|
| ABCB1 | 0.0925563 | 47.8809 | 9.0149 | ↑ |
| CDH11 | 0.0833912 | 6.40447 | 6.26304 | ↑ |
| DMD | 0.0385045 | 2.78563 | 6.17683 | ↑ |
| SLC12A3 | 0.0718359 | 1.3755 | 4.2591 | ↑ |
| KRT71 | 0.142844 | 1.79994 | 3.65543 | ↑ |
| PCDH7 | 0.312025 | 2.51407 | 3.01029 | ↑ |
| UG0898H09 | 0.154445 | 1.04428 | 2.75735 | ↑ |
| MARCH4 | 2.73803 | 14.6769 | 2.42234 | ↑ |
| PSG5 | 0.511795 | 2.63347 | 2.36333 | ↑ |
| MEG3 | 1.7302 | 6.1776 | 1.8361 | ↑ |
| GPR162 | 1.09505 | 3.79453 | 1.79292 | ↑ |
| WNT5A | 1.22759 | 3.37723 | 1.46001 | ↑ |
| KREMEN2 | 1.60257 | 4.33324 | 1.43506 | ↑ |
| CAPG | 19.9343 | 52.2711 | 1.39076 | ↑ |
| AXL | 49.8416 | 121.681 | 1.28768 | ↑ |
| CACNA1G | 1.97871 | 4.00118 | 1.01587 | ↑ |
| FGG | 7.99229 | 0.0265285 | -8.23492 | ↓ |
| HSD11B1 | 12.9429 | 0.127323 | -6.66752 | ↓ |
| GPC6 | 2.44818 | 0.0290896 | -6.39506 | ↓ |
| RPPH1 | 1591.31 | 20.0729 | -6.30882 | ↓ |
| CEACAM5 | 1.62345 | 0.0215542 | -6.23495 | ↓ |
| RMRP | 2097.47 | 37.0419 | -5.82335 | ↓ |
| FGB | 4.09976 | 0.0747985 | -5.77639 | ↓ |
| LPHN2 | 0.674788 | 0.0131037 | -5.68639 | ↓ |
| CEACAM6 | 41.8537 | 0.817423 | -5.67813 | ↓ |
| SAA2 | 114.639 | 2.39198 | -5.58275 | ↓ |
| SAA1 | 702.897 | 17.4412 | -5.33274 | ↓ |
| SLC7A7 | 6.94533 | 0.17289 | -5.32811 | ↓ |
| PPP1R14D | 6.28935 | 0.166546 | -5.23892 | ↓ |
| NACA2 | 419.587 | 11.4161 | -5.19983 | ↓ |
| MYL9 | 7.79545 | 0.233606 | -5.06048 | ↓ |
| MAN1C1 | 26.4085 | 0.847124 | -4.96229 | ↓ |
| CA9 | 74.4067 | 2.42393 | -4.94001 | ↓ |
| PIP | 169.351 | 5.67844 | -4.89838 | ↓ |
| HOXD11 | 3.25867 | 0.110873 | -4.87731 | ↓ |
Since ABCB1 which encodes P-glycoprotein (P-gp) has the most changes, we confirm its change at both RNA and protein expression level in A549 and A549/Abr cells. qRT-PCR was performed to quantitate the mRNA level and it showed that increased in A549/Abr cells compared with A549, from 1.0 to 438.01 (P<0.01, Fig 5A). Western blot analysis was used to determine the relative protein expression of P-gp in A549 and A549/Abr cells. By calculation of the ratio of the integrated intensity of P-gp band to that of the β-actin band in the same sample, we showed that the expression level of P-gp was higher in A549/Abr cells compared with A549 cells, from 0.45 to 85.41 (P<0.01, Fig 5B).
Fig 5. Expression level of P-gp was higher in A549/Abr cells.

(A) Real-time PCR analysis of P-gp showed that mRNA level of P-gp increased in A549/Abr cells compared with A549, from 1.0 to 438.01. (B) Western blot analysis of P-gp showed that protein expression level of P-gp increased in A549/Abr cells compared with A549, 85.41 and 0.45 respectively as highlighted with ** versus *. The change is significant (P<0.01) by Student’s t-test.
Verapamil reversed Abraxane resistance in A549/Abr
To investigate whether P-gp up-regulation is the major cause of A549/Abr cells resistance to Abraxane, P-gp efflux inhibitor Verapamil (VP) was used to see whether inhibition of overexpressed P-gp can reverse Abraxane resistance of A549/Abr cells. Using MTT assay, we evaluated the IC50 of Abraxane to A549 and A549/Abr cells with and without treatment of 4 μg/mL VP. As can be seen from Fig 6A, as the control, VP itself didn’t affect the viability of A549 and A549/Abr cells. At the presence of 4 μg/mL VP, the IC50 of Abraxane for A549/Abr cells decreased from ~1300 nM to 15 nM (Fig 6C), while that of A549 cells remained 10 nM (Fig 6B). Inhibition of P-gp by VP reversed IC50 of Abraxane for A549/Abr to almost the same as its parent cell line. Fig 6D summarized cell viabilities of A549/Abr treated with VP (4 μg/mL) alone, Abraxane (100 nM) alone or VP (4 μg/mL) together with Abraxane (100 nM) for 48 h. These results indicate that when P-gp is inhibited, A549/Abr cell line restore its susceptibility to Abraxane, suggesting that the P-gp up-regulation plays a major role for Abraxane resistance in lung cancer cell line A549/Abr.
Fig 6. P-gp up-regulation mediates Abraxane resistance in lung cancer cell line.

(A) The affection of a P-gp inhibitor verapamil (VP) used alone on A549 and A549/Abr cell viabilities. Both cells were treated with indicated increasing concentrations of VP for 48 h. Cell viability was detected using MTT assay. VP itself didn’t affect much on the viability of A549 and A549/Abr cells. (B-C) Both A549 and A549/Abr cells were treated with indicated increasing concentrations of Abraxane for 48 h at the presence of 4 μg/mL VP. IC50 of Abraxane for A549 cells (B) almost remained the same, while that of A549/Abr cells (C) significantly decreased after VP treatment. (D) Comparision of A549/Abr cell viabilities when treated with VP (4 μg/mL) alone, Abraxane (100 nM) alone or 4 μg/mL VP together with 100 nM Abraxane.
Discussions
Paclitaxel (PTX) is one of the most effective anticancer agents available clinically and it has a wide spectrum of activity against solid tumors [40]. However, its clinical use is impaired by its poor aqueous solubility and even distribution throughout the body, affecting both cancer and normal cells. To overcome these problems, nanocarriers are developed to carry and deliver therapeutics by encapsulating, covalent attaching, or noncovalent binding strategies. In the nanoparticle formulation of PTX, albumin is used as the endogenous carrier of hydrophobic PTX without altering either component or forming covalent bonds. Albumin-bound NP PTX (Abraxane), which was studied in this work, is widely used in clinical treatment of metastatic breast cancer and NSCLC. We aimed to find out the mechanism involved in resistance to nanoparticle formulation of PTX through comparison of Abraxane-resistant A549/Abr cell and its parent A549 cells with NGS technology.
In our study, the RNA-Seq data analysis revealed that the multidrug resistance ABC transporters were up-regulated in MDR cells, among which ABCB1 (MDR1, P-gp) had the most dominant change. Inhibition of P-gp by verapamil (VP) can mostly abolish Abraxane-resistance of A549/Abr cells in vitro (Fig 6). One concern is that verapamil also interacts with calcium channels. However, its function is promoting cancer cell growth by blocking calcium signals that trigger cell apoptosis [41, 42]. This is opposite to the observation that A549/Abr resistance is abolished and cell viability was decreased after treatment of verapamil with Abraxane. Therefore, Abraxane-resistant phenotype is being strongly driven by P-gp overexpression in our newly generated cell line. Considering that PTX has been proved to be a substrate of P-gp [11, 43, 44], and once injected into the body, Abraxane quickly decomposed into smaller albumin-paclitaxel complexes (as shown in Fig 1) and enters tumor cells through association with tumor derived SPARC protein [8, 45]. The observation that overexpression of P-gp plays major role in cell line resistance to Abraxane, same as the common mechanism for free drug, suggests that PTX, the active component in Abraxane, is responsible for the development of drug resistance. Moreover, albumin is over 65 KD, with its physical dimension exceeding the size of ABC transporter’s channel, suggests that PTX is likely dissociated with albumin inside the cell and pumped out by P-gp as a free molecule.
Our study provides for the first time an evidence of Abraxane cellular resistance via overexpression of P-gp in vitro. However, unlike tissue culture, cells in solid tumors are heterogeneous and in a much more complex microenvironment. Delivery of a therapeutic agent has to pass blood vascular system, cross vessel walls and penetrate multilayer of tissue [46, 47]. Therefore, causes of drug resistance in tumors are complicated and cannot be simply explained by mechanisms developed from cell line study. Although there is no report of Abraxane treatment induced resistance in cancer patients so far, we hope that our study will add the understanding of the effect of Abraxane in vitro and in chemotherapy treatment.
Applying the NGS technology that has been demonstrated to provide higher-quality and more informative data than microarray and EST methods [48, 49], we were able to discover the MDR mechanisms through DEG analysis of A549 sensitive and resistant cells. Although in this report, we mainly focused on P-gp which plays a major role in MDR of A549/Abr cells, there might be other mechanisms to explain the higher RI values to taxane family than to other anti-cancer agents as shown in Table 1. In addition, besides ABCB1, many genes such as CDH11, DMD, KRT71, PCDH7, WNT5A and KREMEN2 were up-regulated. CDH11 encodes a cell adhesion protein that is reported to be much regulated in a taxane (docetaxel) resistant cell line [50]. DMD is a large, rod-like cytoskeletal protein. KRT71 belongs to keratin family proteins which are intermediate filament proteins responsible for the structural integrity of cells. And the gene product of PCDH7 is an integral membrane protein that is thought to function in cell-cell recognition and adhesion. WNT5A and KREMEN2 encode proteins associated with Wnt signaling pathway. These suggest that drug resistance against Abraxane might also relate to the enhancement of cell adhesion and the activation of specific signaling pathways. In fact, cell adhesion has been demonstrated to be a mechanism mediated drug resistance [51–53]. Moreover, Hung et al. reported that WNT5A regulates ABCB1 expression in MDR cells through activation of PKA/β-catenin pathway [54]. All these need to be confirmed at the protein level. A proteomic analysis on these cells for protein expression patterns will be performed to understand more resistance mechanisms.
Conclusions
We successfully established a MDR cell line A549/Abr by exposing A549 cells to Abraxane in stepwise increments of drug concentrations. Through RNA-Seq data analysis and biological validation, our results showed the fact that MDR caused by nanoparticles, Abraxane, is closely associated with ABC transporters, especially P-gp. We speculate that this cell line can provide a tool to further investigate drug resistance mechanisms and facilitate NP-formulated medicine.
Supporting Information
The sequencing reads quality was good enough for later analysis.
(DOCX)
The expression profiles were highly reproducible between these two biological replicates (R2 = 0.84, p<0.0001).
(DOCX)
(DOCX)
(DOCX)
(DOCX)
Acknowledgments
We acknowledge funding from the National Natural Science Foundation of China (31270875), Chinese Academy of Science (YZ201217, Y4362911ZX), the International S&T Cooperation Program of China (2010DFB33880), the State Key Development Program for Basic Research of China grant (2011CB915502), the “Strategic Priority Research Program” of the Chinese Academy of Sciences, Stem Cell and Regenerative Medicine Research (XDA01040405 to X.F.), National Programs for High Technology Research and Development (863 Projects, 2012AA022502 to X.F.) and National “Twelfth Five-Year” Plan for Science & Technology Support (2013BAI01B09 to X.F.)”. We declare that we have no conflict of interest.
Data Availability
RNA-seq data have been submitted to the NCBI Gene Expression Omnibus (GEO) (http://www.ncbi.nlm.nih.gov/geo/) and can be accessed via http://www.ncbi.nlm.nih.gov/geo/query/acc.cgi?token=spanomywllunngf&acc=GSE56742.
Funding Statement
The authors acknowledge funding from the National Natural Science Foundation of China (31270875, 31470049), Chinese Academy of Science (YZ201217, Y4362911ZX), the International S&T Cooperation Program of China (2010DFB33880), the State Key Development Program for Basic Research of China grant (2011CB915502), the “Strategic Priority Research Program” of the Chinese Academy of Sciences, Stem Cell and Regenerative Medicine Research (XDA01040405 to X.F.), National Programs for High Technology Research and Development (863 Projects, 2012AA022502 to X.F.), National “Twelfth Five-Year” Plan for Science & Technology Support (2013BAI01B09 to X.F.), Shanghai Leading Academic Discipline Project (B502), Shanghai Key Laboratory Project (08DZ2230500), Science and Technology Commission of Shanghai Municipality Project (11nm0507000), and the Scientific Research Foundation for the Returned Overseas Chinese Scholars, State Education Ministry.
References
- 1. Cukierman E, Khan DR. The benefits and challenges associated with the use of drug delivery systems in cancer therapy. Biochemical pharmacology. 2010;80(5):762–70. Epub 2010/04/27. 10.1016/j.bcp.2010.04.020 [DOI] [PMC free article] [PubMed] [Google Scholar]
- 2. Matsumura Y, Kataoka K. Preclinical and clinical studies of anticancer agent-incorporating polymer micelles. Cancer science. 2009;100(4):572–9. Epub 2009/05/23. . [DOI] [PMC free article] [PubMed] [Google Scholar]
- 3. Sparreboom A, Scripture CD, Trieu V, Williams PJ, De T, Yang A, et al. Comparative preclinical and clinical pharmacokinetics of a cremophor-free, nanoparticle albumin-bound paclitaxel (ABI-007) and paclitaxel formulated in Cremophor (Taxol). Clinical cancer research: an official journal of the American Association for Cancer Research. 2005;11(11):4136–43. Epub 2005/06/03. 10.1158/1078-0432.CCR-04-2291 . [DOI] [PubMed] [Google Scholar]
- 4. Ma P, Mumper RJ. Paclitaxel Nano-Delivery Systems: A Comprehensive Review. Journal of nanomedicine & nanotechnology. 2013;4(2):1000164 Epub 2013/10/29. 10.4172/2157-7439.1000164 [DOI] [PMC free article] [PubMed] [Google Scholar]
- 5. Jordan MA, Wilson L. Microtubules as a target for anticancer drugs. Nature reviews Cancer. 2004;4(4):253–65. 10.1038/nrc1317 . [DOI] [PubMed] [Google Scholar]
- 6. Matsumura Y, Maeda H. A new concept for macromolecular therapeutics in cancer chemotherapy: mechanism of tumoritropic accumulation of proteins and the antitumor agent smancs. Cancer research. 1986;46(12 Pt 1):6387–92. Epub 1986/12/01. . [PubMed] [Google Scholar]
- 7. Wei C, Liu N, Xu P, Heller M, Tomalia DA, Haynie DT, et al. From bench to bedside: successful translational nanomedicine: highlights of the Third Annual Meeting of the American Academy of Nanomedicine. Nanomedicine: nanotechnology, biology, and medicine. 2007;3(4):322–31. Epub 2007/12/11. 10.1016/j.nano.2007.10.005 . [DOI] [PubMed] [Google Scholar]
- 8. Desai N, Trieu V, Yao Z, Louie L, Ci S, Yang A, et al. Increased antitumor activity, intratumor paclitaxel concentrations, and endothelial cell transport of cremophor-free, albumin-bound paclitaxel, ABI-007, compared with cremophor-based paclitaxel. Clinical cancer research. 2006;12(4):1317–24. [DOI] [PubMed] [Google Scholar]
- 9. Hutter G, Sinha P. Proteomics for studying cancer cells and the development of chemoresistance. Proteomics. 2001;1(10):1233–48. WOS:000171839400006. [DOI] [PubMed] [Google Scholar]
- 10. Gottesman MM, Fojo T, Bates SE. Multidrug resistance in cancer: role of ATP-dependent transporters. Nature reviews Cancer. 2002;2(1):48–58. Epub 2002/03/21. 10.1038/nrc706 . [DOI] [PubMed] [Google Scholar]
- 11. Ambudkar SV, Dey S, Hrycyna CA, Ramachandra M, Pastan I, Gottesman MM. Biochemical, cellular, and pharmacological aspects of the multidrug transporter. Annual review of pharmacology and toxicology. 1999;39:361–98. 10.1146/annurev.pharmtox.39.1.361 . [DOI] [PubMed] [Google Scholar]
- 12. Chen CJ, Chin JE, Ueda K, Clark DP, Pastan I, Gottesman MM, et al. Internal duplication and homology with bacterial transport proteins in the mdr1 (P-glycoprotein) gene from multidrug-resistant human cells. Cell. 1986;47(3):381–9. . [DOI] [PubMed] [Google Scholar]
- 13. Metzinger DS, Taylor DD, Gercel-Taylor C. Induction of p53 and drug resistance following treatment with cisplatin or paclitaxel in ovarian cancer cell lines. Cancer letters. 2006;236(2):302–8. Epub 2005/07/02. 10.1016/j.canlet.2005.05.016 . [DOI] [PubMed] [Google Scholar]
- 14. Dumontet C, Duran GE, Steger KA, Beketic-Oreskovic L, Sikic BI. Resistance mechanisms in human sarcoma mutants derived by single-step exposure to paclitaxel (Taxol). Cancer research. 1996;56(5):1091–7. [PubMed] [Google Scholar]
- 15. Panda D, Miller HP, Banerjee A, Luduena RF, Wilson L. Microtubule dynamics in vitro are regulated by the tubulin isotype composition. Proceedings of the National Academy of Sciences of the United States of America. 1994;91(24):11358–62. Epub 1994/11/22. [DOI] [PMC free article] [PubMed] [Google Scholar]
- 16. Tang C, Willingham MC, Reed JC, Miyashita T, Ray S, Ponnathpur V, et al. High levels of p26BCL-2 oncoprotein retard taxol-induced apoptosis in human pre-B leukemia cells. Leukemia. 1994;8(11):1960–9. Epub 1994/11/01. . [PubMed] [Google Scholar]
- 17. Dong X, Mattingly CA, Tseng MT, Cho MJ, Liu Y, Adams VR, et al. Doxorubicin and paclitaxel-loaded lipid-based nanoparticles overcome multidrug resistance by inhibiting P-glycoprotein and depleting ATP. Cancer research. 2009;69(9):3918–26. 10.1158/0008-5472.CAN-08-2747 [DOI] [PMC free article] [PubMed] [Google Scholar]
- 18. Nyman DW, Campbell KJ, Hersh E, Long K, Richardson K, Trieu V, et al. Phase I and pharmacokinetics trial of ABI-007, a novel nanoparticle formulation of paclitaxel in patients with advanced nonhematologic malignancies. Journal of clinical oncology: official journal of the American Society of Clinical Oncology. 2005;23(31):7785–93. Epub 2005/11/01. 10.1200/JCO.2004.00.6148 . [DOI] [PubMed] [Google Scholar]
- 19. Zhang L, Marrano P, Kumar S, Leadley M, Elias E, Thorner P, et al. Nab-paclitaxel is an active drug in preclinical model of pediatric solid tumors. Clinical cancer research: an official journal of the American Association for Cancer Research. 2013;19(21):5972–83. 10.1158/1078-0432.CCR-13-1485 . [DOI] [PubMed] [Google Scholar]
- 20. Stordal B, Hamon M, McEneaney V, Roche S, Gillet JP, O'Leary JJ, et al. Resistance to paclitaxel in a cisplatin-resistant ovarian cancer cell line is mediated by P-glycoprotein. PLoS One. 2012;7(7):e40717 10.1371/journal.pone.0040717 [DOI] [PMC free article] [PubMed] [Google Scholar]
- 21. Chauhan VP, Stylianopoulos T, Martin JD, Popovic Z, Chen O, Kamoun WS, et al. Normalization of tumour blood vessels improves the delivery of nanomedicines in a size-dependent manner. Nature nanotechnology. 2012;7(6):383–8. Epub 2012/04/10. 10.1038/nnano.2012.45 [DOI] [PMC free article] [PubMed] [Google Scholar]
- 22. Gardner ER, Dahut W, Figg WD. Quantitative determination of total and unbound paclitaxel in human plasma following Abraxane treatment. Journal of chromatography B, Analytical technologies in the biomedical and life sciences. 2008;862(1–2):213–8. 10.1016/j.jchromb.2007.12.013 [DOI] [PMC free article] [PubMed] [Google Scholar]
- 23. Sahay G, Alakhova DY, Kabanov AV. Endocytosis of nanomedicines. Journal of controlled release: official journal of the Controlled Release Society. 2010;145(3):182–95. Epub 2010/03/17. 10.1016/j.jconrel.2010.01.036 [DOI] [PMC free article] [PubMed] [Google Scholar]
- 24. Liu J, Zhao Y, Guo Q, Wang Z, Wang H, Yang Y, et al. TAT-modified nanosilver for combating multidrug-resistant cancer. Biomaterials. 2012;33(26):6155–61. Epub 2012/06/12. 10.1016/j.biomaterials.2012.05.035 . [DOI] [PubMed] [Google Scholar]
- 25. Fan JT, Su J, Peng YM, Li Y, Li J, Zhou YB, et al. Rubiyunnanins C-H, cytotoxic cyclic hexapeptides from Rubia yunnanensis inhibiting nitric oxide production and NF-kappaB activation. Bioorganic & medicinal chemistry. 2010;18(23):8226–34. Epub 2010/11/04. 10.1016/j.bmc.2010.10.019 . [DOI] [PubMed] [Google Scholar]
- 26. Chen X, Wen J. In situ wet-cell TEM observation of gold nanoparticle motion in an aqueous solution. Nanoscale research letters. 2012;7(1):598 10.1186/1556-276X-7-598 [DOI] [PMC free article] [PubMed] [Google Scholar]
- 27. Liu Y, Chen X, Noh KW, Dillon SJ. Electron beam induced deposition of silicon nanostructures from a liquid phase precursor. Nanotechnology. 2012;23(38):385302 10.1088/0957-4484/23/38/385302 . [DOI] [PubMed] [Google Scholar]
- 28. Kim D, Pertea G, Trapnell C, Pimentel H, Kelley R, Salzberg SL. TopHat2: accurate alignment of transcriptomes in the presence of insertions, deletions and gene fusions. Genome biology. 2013;14(4):R36 Epub 2013/04/27. 10.1186/gb-2013-14-4-r36 . [DOI] [PMC free article] [PubMed] [Google Scholar]
- 29. Trapnell C, Williams BA, Pertea G, Mortazavi A, Kwan G, van Baren MJ, et al. Transcript assembly and quantification by RNA-Seq reveals unannotated transcripts and isoform switching during cell differentiation. Nature biotechnology. 2010;28(5):511–5. 10.1038/nbt.1621 [DOI] [PMC free article] [PubMed] [Google Scholar]
- 30. Mortazavi A, Williams B, McCue K, Schaeffer L, Wold B. Mapping and quantifying mammalian transcriptomes by RNA-Seq. Nature methods. 2008;5(7):621–8. 10.1038/nmeth.1226 [DOI] [PubMed] [Google Scholar]
- 31. Wang J, Duncan D, Shi Z, Zhang B. WEB-based GEne SeT AnaLysis Toolkit (WebGestalt): update 2013. Nucleic acids research. 2013;41(Web Server issue):W77–83. 10.1093/nar/gkt439 [DOI] [PMC free article] [PubMed] [Google Scholar]
- 32. Ogata H, Goto S, Sato K, Fujibuchi W, Bono H, Kanehisa M. KEGG: Kyoto Encyclopedia of Genes and Genomes. Nucleic acids research. 1999;27(1):29–34. Epub 1998/12/10. [DOI] [PMC free article] [PubMed] [Google Scholar]
- 33. Yang Y, Wang H, Chang KH, Qu H, Zhang Z, Xiong Q, et al. Transcriptome dynamics during human erythroid differentiation and development. Genomics. 2013;102(5–6):431–41. 10.1016/j.ygeno.2013.09.005 . [DOI] [PMC free article] [PubMed] [Google Scholar]
- 34. Zhang F, Zhang L, Zhang B, Wei X, Yang Y, Qi RZ, et al. Anxa2 plays a critical role in enhanced invasiveness of the multidrug resistant human breast cancer cells. Journal of proteome research. 2009;8(11):5041–7. 10.1021/pr900461c [DOI] [PubMed] [Google Scholar]
- 35. Ke W, Yu P, Wang J, Wang R, Guo C, Zhou L, et al. MCF-7/ADR cells (re-designated NCI/ADR-RES) are not derived from MCF-7 breast cancer cells: a loss for breast cancer multidrug-resistant research. Medical oncology. 2011;28 Suppl 1:S135–41. 10.1007/s12032-010-9747-1 . [DOI] [PubMed] [Google Scholar]
- 36. Riganti C, Castella B, Kopecka J, Campia I, Coscia M, Pescarmona G, et al. Zoledronic acid restores doxorubicin chemosensitivity and immunogenic cell death in multidrug-resistant human cancer cells. PLoS One. 2013;8(4):e60975 10.1371/journal.pone.0060975 [DOI] [PMC free article] [PubMed] [Google Scholar] [Retracted]
- 37. Mungrue IN, Pagnon J, Kohannim O, Gargalovic PS, Lusis AJ. CHAC1/MGC4504 is a novel proapoptotic component of the unfolded protein response, downstream of the ATF4-ATF3-CHOP cascade. Journal of immunology. 2009;182(1):466–76. [DOI] [PMC free article] [PubMed] [Google Scholar]
- 38. Zhao X, Liu X, Su L. Parthenolide induces apoptosis via TNFRSF10B and PMAIP1 pathways in human lung cancer cells. Journal of experimental & clinical cancer research: CR. 2014;33(1):3 10.1186/1756-9966-33-3 . [DOI] [PMC free article] [PubMed] [Google Scholar]
- 39. Vara D, Morell C, Rodriguez-Henche N, Diaz-Laviada I. Involvement of PPARgamma in the antitumoral action of cannabinoids on hepatocellular carcinoma. Cell death & disease. 2013;4:e618 10.1038/cddis.2013.141 [DOI] [PMC free article] [PubMed] [Google Scholar]
- 40. van Vlerken LE, Amiji MM. Multi-functional polymeric nanoparticles for tumour-targeted drug delivery. Expert opinion on drug delivery. 2006;3(2):205–16. Epub 2006/03/02. 10.1517/17425247.3.2.205 . [DOI] [PubMed] [Google Scholar]
- 41. Pahor M, Guralnik JM, Salive ME, Corti MC, Carbonin P, Havlik RJ. Do calcium channel blockers increase the risk of cancer? American journal of hypertension. 1996;9(7):695–9. . [DOI] [PubMed] [Google Scholar]
- 42. Pahor M, Guralnik JM, Ferrucci L, Corti MC, Salive ME, Cerhan JR, et al. Calcium-channel blockade and incidence of cancer in aged populations. Lancet. 1996;348(9026):493–7. 10.1016/S0140-6736(96)04277-8 . [DOI] [PubMed] [Google Scholar]
- 43. Aller SG, Yu J, Ward A, Weng Y, Chittaboina S, Zhuo R, et al. Structure of P-glycoprotein reveals a molecular basis for poly-specific drug binding. Science. 2009;323(5922):1718–22. Epub 2009/03/28. 10.1126/science.1168750 [DOI] [PMC free article] [PubMed] [Google Scholar]
- 44. Johnstone RW, Ruefli AA, Smyth MJ. Multiple physiological functions for multidrug transporter P-glycoprotein? Trends in biochemical sciences. 2000;25(1):1–6. Epub 2000/01/19. . [DOI] [PubMed] [Google Scholar]
- 45. Desai N. Nab technology: A drug delivery platform utilising endothelial gp60 receptor-based transport and tumour-derived SPARC for targeting. Drug Delivery Report. 2007;16:37–41. [Google Scholar]
- 46. Grantab R, Sivananthan S, Tannock IF. The penetration of anticancer drugs through tumor tissue as a function of cellular adhesion and packing density of tumor cells. Cancer research. 2006;66(2):1033–9. 10.1158/0008-5472.CAN-05-3077 . [DOI] [PubMed] [Google Scholar]
- 47. Tredan O, Galmarini CM, Patel K, Tannock IF. Drug resistance and the solid tumor microenvironment. Journal of the National Cancer Institute. 2007;99(19):1441–54. 10.1093/jnci/djm135 . [DOI] [PubMed] [Google Scholar]
- 48. Marioni JC, Mason CE, Mane SM, Stephens M, Gilad Y. RNA-seq: an assessment of technical reproducibility and comparison with gene expression arrays. Genome research. 2008;18(9):1509–17. Epub 2008/06/14. 10.1101/gr.079558.108 [DOI] [PMC free article] [PubMed] [Google Scholar]
- 49. Wang Z, Gerstein M, Snyder M. RNA-Seq: a revolutionary tool for transcriptomics. Nature reviews Genetics. 2009;10(1):57–63. Epub 2008/11/19. 10.1038/nrg2484 [DOI] [PMC free article] [PubMed] [Google Scholar]
- 50. Armstrong SR, Narendrula R, Guo B, Parissenti AM, McCallum KL, Cull S, et al. Distinct genetic alterations occur in ovarian tumor cells selected for combined resistance to carboplatin and docetaxel. Journal of ovarian research. 2012;5(1):40 10.1186/1757-2215-5-40 [DOI] [PMC free article] [PubMed] [Google Scholar]
- 51. Shain KH, Dalton WS. Cell adhesion is a key determinant in de novo multidrug resistance (MDR): new targets for the prevention of acquired MDR. Molecular cancer therapeutics. 2001;1(1):69–78. . [PubMed] [Google Scholar]
- 52. Damiano JS, Cress AE, Hazlehurst LA, Shtil AA, Dalton WS. Cell adhesion mediated drug resistance (CAM-DR): role of integrins and resistance to apoptosis in human myeloma cell lines. Blood. 1999;93(5):1658–67. . [PMC free article] [PubMed] [Google Scholar]
- 53. McGrail DJ, Khambhati NN, Qi MX, Patel KS, Ravikumar N, Brandenburg CP, et al. Alterations in Ovarian Cancer Cell Adhesion Drive Taxol Resistance by Increasing Microtubule Dynamics in a FAK-dependent Manner. Scientific reports. 2015;5:9529 10.1038/srep09529 [DOI] [PMC free article] [PubMed] [Google Scholar]
- 54. Hung TH, Hsu SC, Cheng CY, Choo KB, Tseng CP, Chen TC, et al. Wnt5A regulates ABCB1 expression in multidrug-resistant cancer cells through activation of the non-canonical PKA/beta-catenin pathway. Oncotarget. 2014;5(23):12273–90. [DOI] [PMC free article] [PubMed] [Google Scholar]
Associated Data
This section collects any data citations, data availability statements, or supplementary materials included in this article.
Supplementary Materials
The sequencing reads quality was good enough for later analysis.
(DOCX)
The expression profiles were highly reproducible between these two biological replicates (R2 = 0.84, p<0.0001).
(DOCX)
(DOCX)
(DOCX)
(DOCX)
Data Availability Statement
RNA-seq data have been submitted to the NCBI Gene Expression Omnibus (GEO) (http://www.ncbi.nlm.nih.gov/geo/) and can be accessed via http://www.ncbi.nlm.nih.gov/geo/query/acc.cgi?token=spanomywllunngf&acc=GSE56742.