Supplemental Digital Content is available in the text
Abstract
A significant proportion of patients with papillary thyroid cancer (PTC) present with extrathyroidal extension (ETE) and lymph node metastasis (LNM). However, the molecular mechanism of tumor invasiveness in PTC remains to be elucidated.
The aim of this study is to understand the role of Hedgehog (Hh) signaling in tumor aggressiveness in patients with PTC.
Subjects were patients who underwent thyroidectomy from 2012 to 2013 in a single institution. Frozen or paraffin-embedded tumor tissues with contralateral-matched normal thyroid tissues were collected. Hh signaling activity was analyzed by quantitative RT-PCR (qRT-PCR) and immunohistochemical (IHC) staining. Datasets from Gene Expression Omnibus (GEO) (National Center for Biotechnology Information) were subjected to Gene Set Enrichment Analysis (GSEA). BRAFT1799A and telomerase reverse transcriptase promoter mutation C228T were analyzed by direct sequencing.
Among 137 patients with PTC, glioma-associated oncogene homolog 1 (GLI1) group III (patients in whom the ratio of GLI1 messenger ribonucleic acid (mRNA) level in tumor tissue to GLI1 mRNA level in matched normal tissue was in the upper third of the subject population) had elevated risk for ETE (odds ratio [OR] 4.381, 95% confidence interval [CI] 1.414–13.569, P = 0.01) and LNM (OR 5.627, 95% CI 1.674–18.913, P = 0.005). Glioma-associated oncogene homolog 2 (GLI2) group III also had elevated risk for ETE (OR 4.152, 95% CI 1.292–13.342, P = 0.017) and LNM (OR 3.924, 95% CI 1.097–14.042, P = 0.036). GSEA suggested that higher GLI1 expression is associated with expression of the KEGG gene set related to axon guidance (P = 0.031, false discovery rate < 0.05), as verified by qRT-PCR and IHC staining in our subjects.
GLI1 and GLI2 expressions were clearly related to aggressive clinicopathological features and aberrant activation of GLI1 involved in the axon guidance pathway. These results may contribute to development of new prognostic markers, as well as novel therapeutic targets.
INTRODUCTION
Papillary thyroid cancer (PTC) is generally associated with favorable outcomes. However, lymph node metastasis (LNM) occurs in 20% to 90% of patients with PTC.1–3 LNM is commonly associated with locoregional recurrence of PTC.4,5 Therapeutic central lymph node dissection (CLND) in patients with clinically diagnosed metastatic lymph nodes has been accepted as a standard therapy. However, prophylactic CLND in patients with no clinically detectable metastatic lymph nodes has remained controversial because of the limited therapeutic benefit and the risk of surgical complications.6,7 Previous reports have attempted to resolve this controversy by proposing clinical or molecular markers that might predict LNM and locoregional recurrence, such as, large tumor size, extrathyroidal extension (ETE), BRAFV600E mutation, and telomerase reverse transcriptase (TERT) promoter mutations.8–10
The Hedgehog (Hh) signaling pathway is an evolutionarily conserved system that is essential for patterning and organogenesis during embryonic development.11–14 The central components of the mammalian Hh pathway include 3 secretory ligands, Sonic Hedgehog (SHH), Desert Hedgehog (DHH), and Indian Hedgehog (IHH); patched (PTCH), a receptor involved in the negative regulation of the pathway; Hedgehog-interacting protein (HHIP), a negative regulation factor; and the glioma-associated oncogene (GLI) transcription factors [glioma-associated oncogene homolog 1 [GLI1], glioma-associated oncogene homolog 2 [GLI2], and GLI family zinc finger 3 (GLI3)].15 Recently, aberrant activation of the Hh signaling pathway has been linked with tumorigenesis in medulloblastoma (MB) and basal cell carcinoma (BCC).16,17 In addition, hyperactive Hh signaling has been reported in pancreatic, colon, gastric, lung, breast, and prostatic cancers, as well as leukemia and multiple myeloma.18,19
In this study, we measured the messenger ribonucleic acid (mRNA) expression levels of the central components of the Hh signaling pathway in patients with PTC. Mean mRNA levels of Hh signaling components in PTC were lower than the corresponding levels in matched normal thyroid tissues. However, patients with PTC expressing higher levels of GLI1 and GLI2 mRNA frequently presented with ETE and LNM. In addition, Gene Set Enrichment Analysis (GSEA) revealed that GLI1 expression was coordinately regulated with genes involved in axon guidance, as verified by quantitative RT-PCR (qRT-PCR) and immunohistochemical (IHC) staining.
MATERIALS AND METHODS
Subjects and Clinical Data
We enrolled 137 patients (21 men and 116 women) who underwent thyroidectomy for the management of conventional PTC between January 2012 and December 2013 at Severance Hospital, Yonsei Cancer Center, Seoul, South Korea. For a validation set, we also collected 103 patients independently (21 men and 82 women). The baseline clinicopathological characteristics of derivation and validation cohort are summarized in supplementary Table 1, http://links.lww.com/MD/A305. All of the samples were microscopically dissected at the time of surgery after confirmation of tissue diagnosis from frozen section, validated by hematoxylin–eosin staining after the operation. Samples were taken from the central part of the cancer and from histologically normal tissue. On histological examination, >90% of the cells were thyroid cancer cells. All of the patients provided informed consent before study participation, and the study protocol was approved by the institutional review board of Severance Hospital.
DNA Isolation and Sequencing
Genomic DNA from paraffin-embedded thyroid tissue specimens was prepared using QIAamp DNA Formalin-fixed, paraffin-embedded Tissue Kit (Qiagen, Venlo, The Netherlands). Exon 15 of the BRAF gene was amplified by Polymerase chain reaction (PCR) with the following primers: forward 5′-ATG CTT GCT CTG ATA GGA AA-3′ and reverse 5′-ATT TTT GTG AAT ACT GGG GAA-3′.20 For TERT promoter containing the hotspots of C228T and C250T, mutations was amplified using primers: forward 5′-AGT GGA TTC GCG GGC ACA GA-3′ and reverse 5′-CAG CGC TGC CTG AAA CTC-3′.10 The purified PCR products were sequenced on an ABI PRISM 3100 automated capillary DNA Sequencer, Foster City, CA using the BigDye Terminator Cycle Sequencing Ready Reaction Kit (Applied Biosystems, Foster City, CA).
RNA Isolation and Real-Time PCR
Total RNA was extracted from fresh frozen tissues using Trizol (Invitrogen, Carlsbad, CA), and the RNA quality was verified by using Agilent's 2100 Bioanalyzer System (Agilent Technologies, Santa Clara, CA) as shown in supplementary Figure 1, http://links.lww.com/MD/A305. Complementary DNA (cDNA) was prepared from total RNA using Moloney Murine Leukemia Virus Reverse Transcriptase (Invitrogen) and oligo-dT primers (Promega, Madison, WI). qRT-PCR was performed on the cDNA using the QuantiTect SYBR Green RT-PCR Kit (Qiagen, Valencia, CA). Primers used in qRT-PCR are listed in supplementary Table 2, http://links.lww.com/MD/A305. Relative expression was calculated using the StepOne Real-Time PCR System (Applied Biosystems). qRT-PCR experiments were repeated 3 times, and each experiment was performed in triplicate.
GSEA of GLI1-Correlated Genes
Microarray data from the Gene Expression Omnibus (GEO) of National Center for Biotechnology Information (NCBI) (DataSet Record GDS1732 and GSE33630 for PTC, GSE16515 for pancreatic cancer) were subjected to GSEA.21 Genes whose expression was strongly correlated to GLI1, or that were interesting for other reasons, were selected for validation by qRT-PCR using cDNA derived from our subjects. To verify our GSEA, the public data from The Cancer Genome Atlas Research Network has been subjected to statistical analyses [The Cancer Genome Atlas (TCGA), http://cancergenome.nih.gov].22
IHC Analysis
Paraffin-embedded tissue sections (4 μm thick) were deparaffinized in xylene and rehydrated in a graded series of ethanol (100%–80%). Antigens were retrieved in 0.01 M citrate buffer (pH 6.0) by heating the tissue sections in an autoclave (CHS-ACCE-860, Choong Wae Medical Corporation, Korea). The tissue sections were then placed in 3% hydrogen peroxide for 5 minutes to inactivate endogenous peroxidases and then blocked for 10 minutes with normal horse serum (UltraTech HRP kit; Immunotech, Marseille, France). The primary antibodies used for this study were anti-Gli1 (sc-20687; Santa Cruz Biotechnology, Santa Cruz, CA), anti-NFATc4 (sc-32985; Santa Cruz Biotechnology), anti-ABLIM3 (HPA003245, Sigma, St Louis, MO), and anti-FES (HPA-001376, Sigma). Sections were incubated for 60 minutes with appropriately diluted primary antibodies, incubated with biotinylated secondary antibody for 20 minutes, and then visualized with UltraTech HRP, streptavidin peroxidase (Immunotech) and aminoethylcarbazole solution for a further 10 minutes. Finally, the tissue sections were counterstained with hematoxylin for 10 seconds. All incubations were performed at room temperature.
Statistical and Graphical Analysis
Differences between means were analyzed by Mann–Whitney U test, paired t test, independent samples t test, or 1-way Analysis of variance, as indicated in figure and table legends. Comparisons between groups were performed by χ2 or linear-by-linear association. All analyses were performed using SPSS version 18.0 for Windows (SPSS Inc, Chicago, IL) or GraphPad Prism (GraphPad Software, Inc, San Diego, CA). All reported P values are 2-sided.
RESULTS
mRNA Expression of Central Components of the Hh Pathway is Reduced in PTC
Initially, we performed qRT-PCR and calculated the relative mRNA expression of each central component of the mammalian Hh pathway, normalized to the expression of the internal control gene GAPDH. In this step, we used tumor and contralateral matched normal samples from 137 patients with PTC. As shown in Figure 1A, relative mRNA expression of GLI1 in normal thyroid tissue was 1.73 ± 0.06. In PTC, GLI1 mRNA expression in PTC was statistically significantly reduced (0.88 ± 0.04; paired t test, P < 0.001). The other central components of the Hh pathway, including GLI2, GLI3, HHIP, PTCH1, SHH, DHH, and IHH, exhibited the same expression patterns, with significantly lower levels in PTC than in matched normal tissues (Figure 1B–H). Thus, our qRT-PCR data suggested that the Hh pathway activity might be generally reduced in PTC.
FIGURE 1.
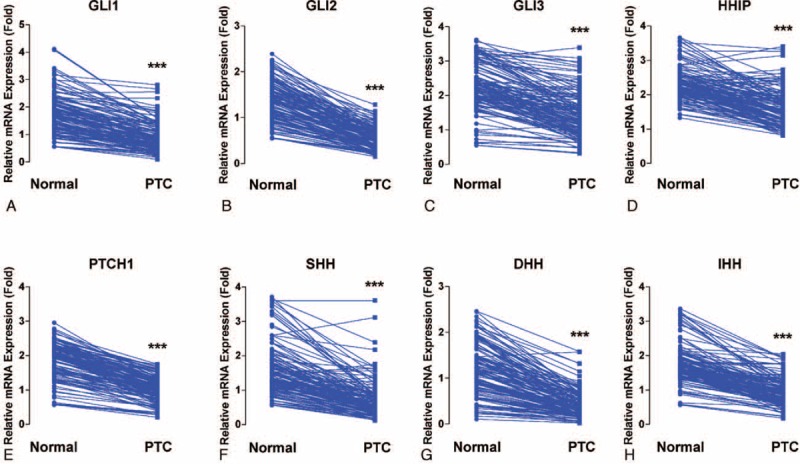
Comparison between PTC and matched normal thyroid tissues of mRNA expression of central components of Hh pathways: GLI1 (A), GLI2 (B), GLI3 (C), HHIP (D), PTCH1 (E), SHH (F), DHH (G), and IHH (H). Means were compared by paired t test. All data are means ± SEM. ∗P < 0.05, ∗∗P < 0.01, and ∗∗∗P < 0.001. DHH = Desert Hedgehog, GLI1 = glioma-associated oncogene homolog 1, GLI2 = glioma-associated oncogene homolog 2, Hh = Hedgehog, HHIP = Hedgehog-interacting protein, IHH = Indian Hedgehog, mRNA = messenger ribonucleic acid, PTC = papillary thyroid cancer, PTCH = patched, SHH = Sonic Hedgehog.
Relationship Between GLI1/GLI2 and HHIP Expression in Normal Thyroid Tissues and PTC
Three of the genes analyzed, GLI1, GLI2, and HHIP, are regarded as targets of the Hh pathway.14 To verify whether the GLI1-dependent transcriptional activities of these target genes are coordinately regulated in normal thyroid tissue and PTC, we analyzed the correlation between the mRNA expression levels of HHIP and GLI1 or GLI2. In normal thyroid tissues, we found a strong positive correlation between levels of GLI1 and HHIP mRNA levels (r = 0.55, P < 0.001), indicating that the negative-feedback loop of Hh pathway is functioning normally in normal thyroid tissues via expression of HHIP (Figure 2A). However, the correlation between GLI1 and HHIP mRNAs disappeared in PTC (Figure 2B). Likewise, expression of GLI2 (Figure 2C and D) was also positively correlated with that of HHIP in normal tissues (r = 0.17, P = 0.05) but not in PTC (r = 0.12, P = 0.17). Taken together, these data suggest that GLI1, GLI2, and HHIP are coordinately regulated by a negative-feedback loop in normal thyroid tissues. By contrast, in PTC, this negative-feedback loop might be dysregulated, or the GLI transcriptional factors might be induced independently of the canonical Hh pathway.
FIGURE 2.
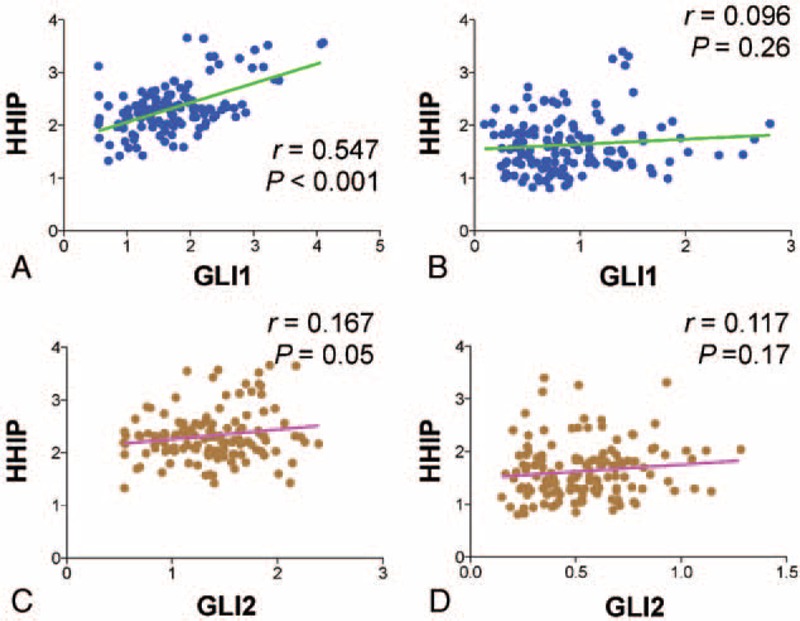
Correlation between expression levels of the central components of the Hh pathway. (A and B) Correlation between GLI1 and HHIP relative mRNA expression in normal thyroid tissues (A) and PTC (B). (C and D) Correlation between GLI2 and HHIP relative mRNA expression in normal thyroid tissues (C) and PTC (D). Linear correlations between 2 groups were analyzed by Pearson R correlation test. GLI1 = glioma-associated oncogene homolog 1, Hh = Hedgehog, HHIP = Hedgehog-interacting protein, mRNA = messenger ribonucleic acid, PTC = papillary thyroid cancer.
Relationship Between Expression of Hh Pathway Components and Clinicopathological Parameters
To determine the clinical implications of mRNA expression levels of the central Hh pathway components, we classified the study patients into 3 groups according to the ratio of mRNA expression in tumors versus normal tissue (ie, relative mRNA expression in PTC/relative mRNA expression in matched normal tissue): group I, lowest one third (n = 46); group II, middle one third (n = 46); group III, highest one third (n = 45, supplementary Figure 2, http://links.lww.com/MD/A305). In the initial statistical analysis of the effect of GLI1 mRNA expression on clinicopathological parameters (supplementary Table 3, http://links.lww.com/MD/A305), GLI1 group III presented with more frequent ETE (P = 0.002) and LNM (P < 0.001). Interestingly, GLI1 group III also indicated more frequent TERT promoter C228T mutation (supplementary Figure 3, http://links.lww.com/MD/A305 and supplementary Table 2, http://links.lww.com/MD/A305). Furthermore, as shown in supplementary Table 4 , http://links.lww.com/MD/A305, GLI2 group III also exhibited more frequent ETE (P = 0.005) and LNM (P = 0.005). By contrast, HHIP group III exhibited less frequent LNM (supplementary Table 5, http://links.lww.com/MD/A305, P = 0.025). Taken together, these data suggest that the expression of the zinc-finger transcription factors GLI1 and GLI2, as well as HHIP, a vertebrate-specific inhibitor of Hh signaling, might play important roles in ETE and LNM. The implication here is that Hh signaling contributes to tumor aggressiveness in PTC.
Impact of the Central Components of the Hh Pathway on ETE and LNM
To determine the factors affecting ETE and LNM in our study patients, we performed statistical analyses of clinicopathological parameters and mRNA expression of the central components of the Hh pathway, according to the presence or absence of ETE and LNM. As shown in Table 1 , ETE was associated with multifocality (P = 0.001), LNM (P = 0.001), TNM Classification of Malignant Tumours (TNM) stage (P = 0.001), GLI1 expression (P = 0.002), and GLI2 expression (P = 0.005). Remarkably, GLI1 group III was a strong positive predictor of ETE after adjusting for clinicopathological parameters, expression of Hh pathway components, the mutation status of BRAFT1799A and TERT promoter (Table 2; odds ratio [OR] 4.381, 95% confidence interval [CI] 1.414–13.569, P = 0.01) compared with group I. In the same multivariate analyses, GLI2 group III was also a positive predictor of ETE (Table 2; OR 4.152, 95% CI 1.292–13.342, P = 0.017).
TABLE 1.
Analyses of Clinicopathological Parameters and mRNA Expression of the Central Components of the Hh Pathway, According to Presence or Absence of ETE
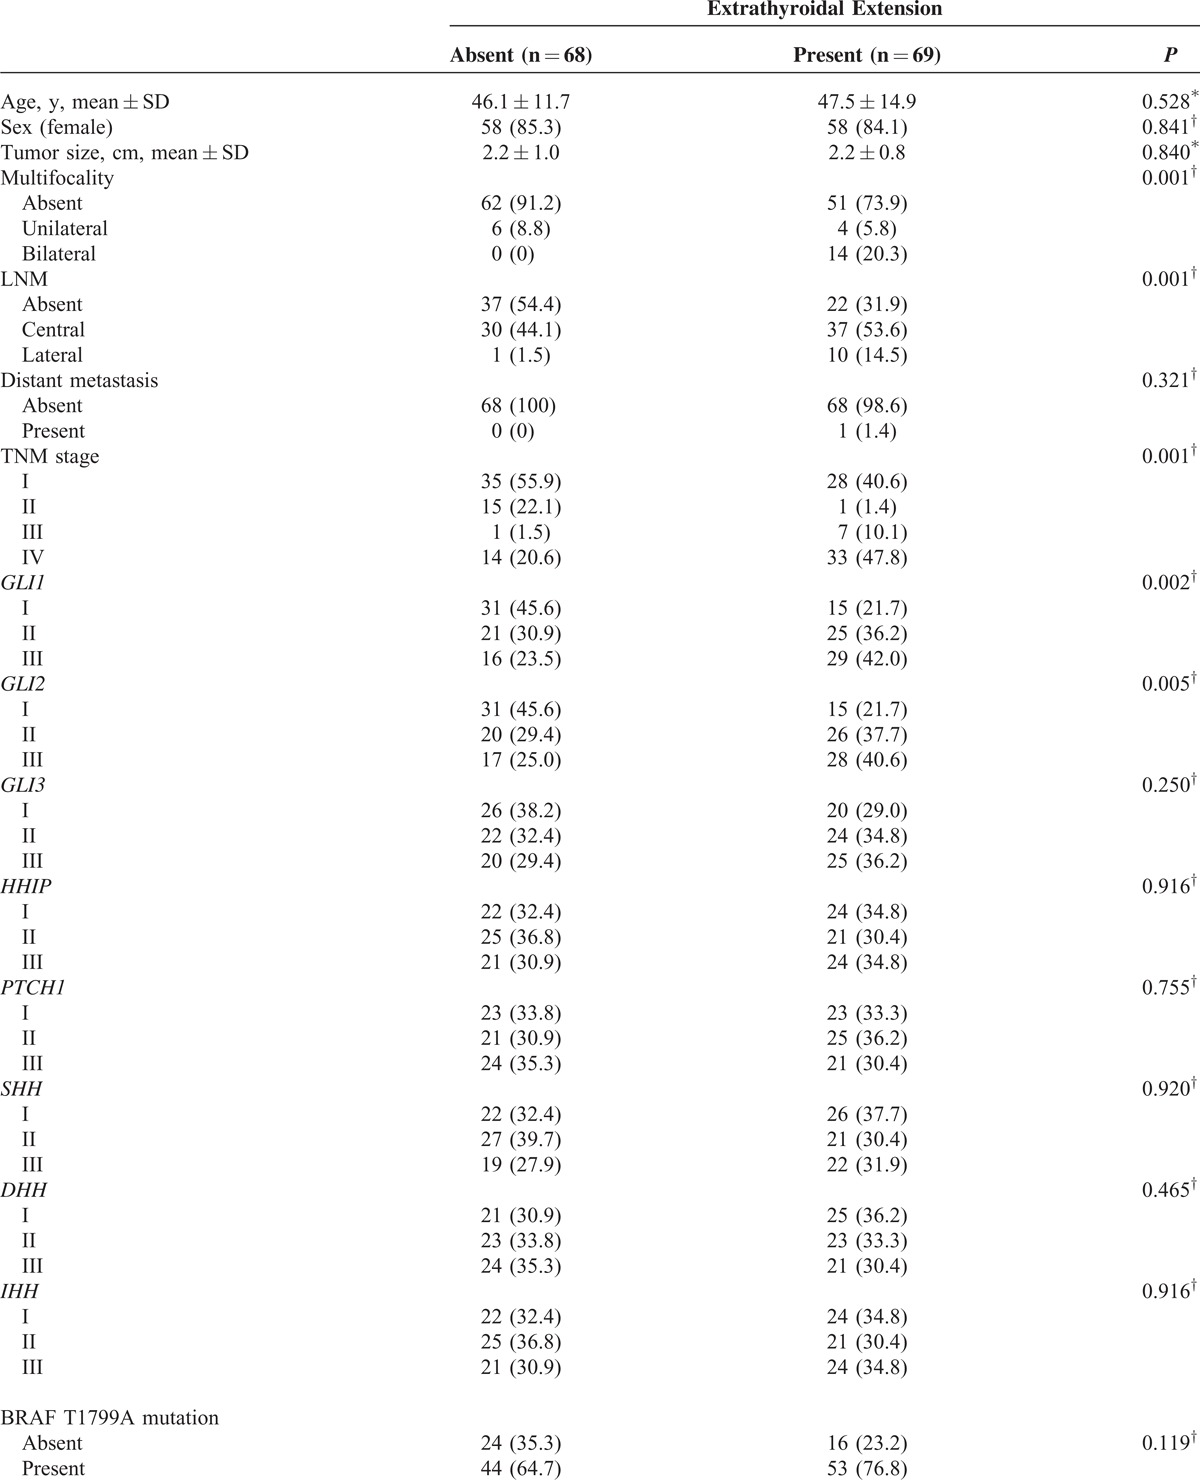
TABLE 1 (Continued).
Analyses of Clinicopathological Parameters and mRNA Expression of the Central Components of the Hh Pathway, According to Presence or Absence of ETE

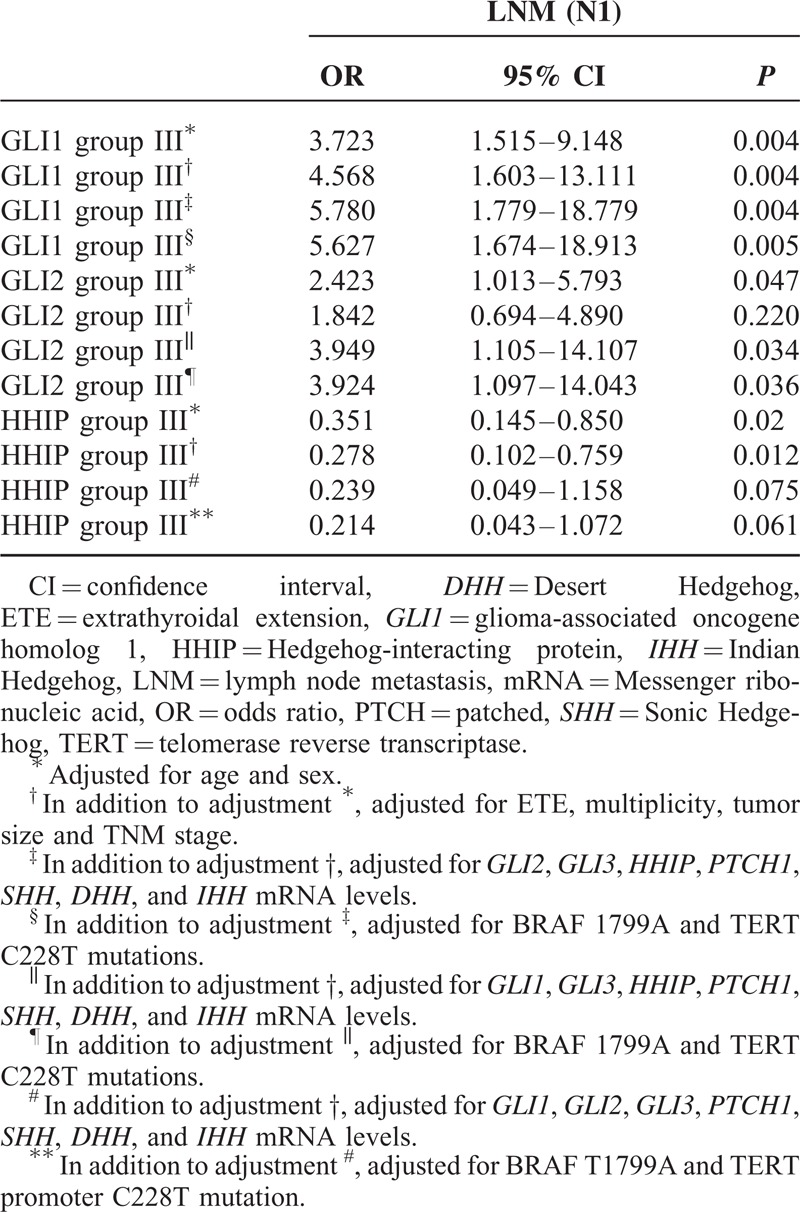
In the analyses of LNM (Table 3 ), several factors were identified as predictors: ETE (P = 0.003), TNM stage (P = 0.005), GLI1 (P < 0.001), GLI2 (P = 0.005), and HHIP (P = 0.025); all except HHIP were positive predictors. In multivariate analyses (Table 4), GLI1 group III was the strongest positive predictor of LNM (P = 0.005, OR 5.627, 95% CI 1.674–18.913) compared with group I, and GLI2 group III was also a strong positive indicator (P = 0.036, OR 3.924, 95% CI 1.097–14.043). Additionally, HHIP group III was a statistically significant negative predictor of LNM, even after adjusting for clinicopathological parameters (P = 0.012, OR 0.278, 95% CI 0.102–0.759).
TABLE 2.
Multivariate Analysis of the Association of ETE With GLI1 and GLI2 mRNA Expression Level
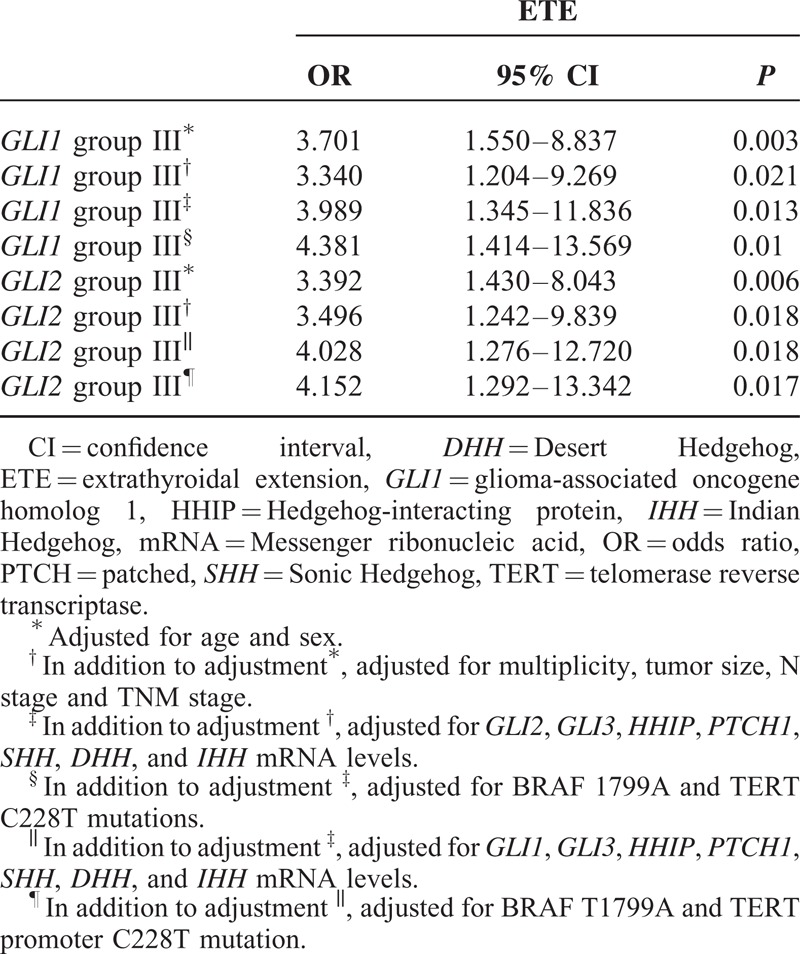
TABLE 3.
Analyses of Clinicopathological Parameters and mRNA Expression of the Central Components of Hh Pathway, According to Presence or Absence of LNM
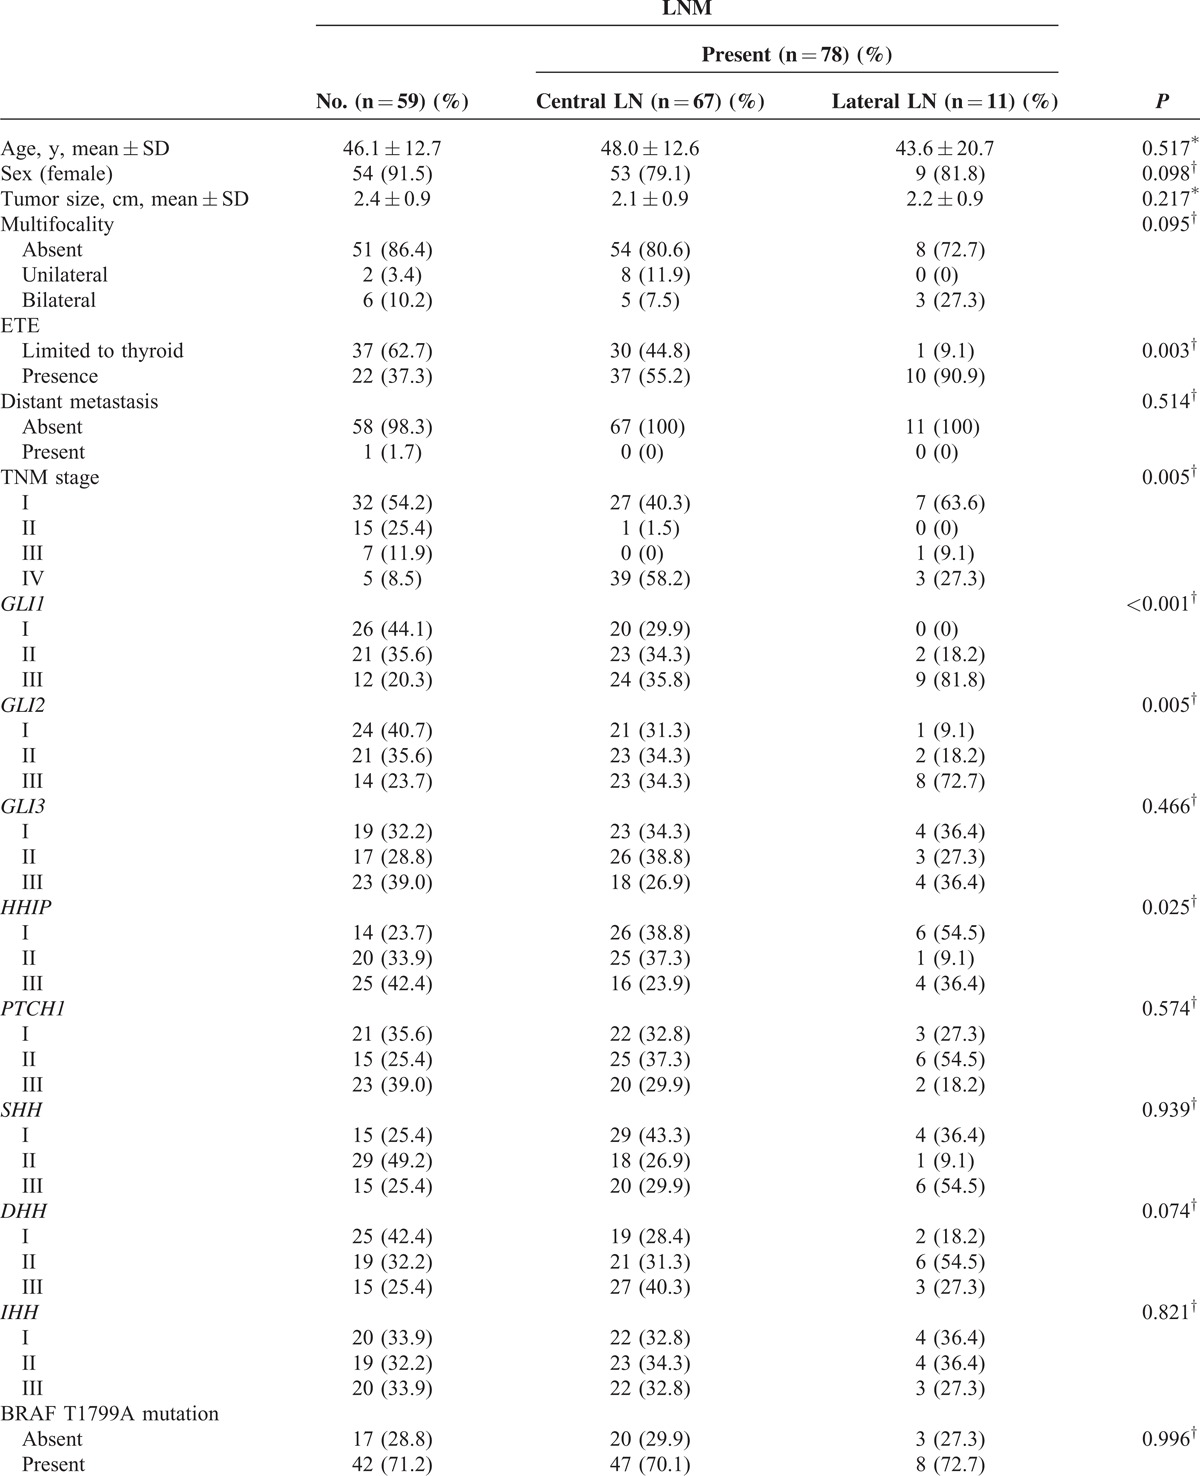
TABLE 4.
Multivariate Analysis of the Association of LNM With GLI1, GLI2, and HHIP mRNA Levels
To validate our data, we performed an independent analysis for 103 patients with conventional PTC. In this validation set, GLI1 group III was consistently related to ETE (P < 0.001) and LNM (P < 0.001) (supplementary Table 6, http://links.lww.com/MD/A305).
Strong Correlation of GLI1 Expression With Axon Guidance Gene Set
To obtain further insight into the mechanisms of GLI1 action, we performed GSEA using data from a public repository, NCBI GEO. The dataset GDS1732 contained expression profiles from 7 normal thyroid tissues and matched PTC specimens (14 total samples). In this dataset, GLI1 expression was quite heterogeneous in normal and tumor tissues (supplementary Figure 4A, http://links.lww.com/MD/A305); moreover, GSEA revealed no enrichment in genes associated with the Hh pathway in normal or PTC (supplementary Figure 4B, http://links.lww.com/MD/A305). However, when we performed GSEA on the samples with the lowest GLI1 expression (group 1: GSM85223 and GSM85225) and those with the highest GLI1 expression (group 2: GSM85222 and GSM85224), we observed that the top 20 KEGG gene sets enriched in group 2 included sets related to cell interaction and migration, for example, neuroactive ligand–receptor interaction, leukocyte transendothelial migration, cytokine and cytokine receptor interaction, and the Notch signaling pathway (supplementary Table 7, http://links.lww.com/MD/A305). In addition, the gene set “axon guidance” was significantly enriched in group 2 (supplementary Figure 5, http://links.lww.com/MD/A305; ES = −0.38328, nominal P value = 0.005165, false discovery rate q-value = 0.235033), indicating that GLI1 might increase the migration and invasion abilities of PTC by inducing expression of genes related to axon guidance. Furthermore, the dataset GSE33630 contained expression profiles from 45 normal thyroid tissues; 49 PTC and 11 anaplastic thyroid carcinoma (ATC) specimens (105 total samples) showed the enrichment of Hh signaling pathway in normal thyroid tissues (supplementary Figure 6, http://links.lww.com/MD/A305). However, when we selected 16 cases of high GLI1 expression (high GLI1 group) and 16 cases of low GLI1 expression (low GLI1 group) and performed the GSEA using those 2 groups, the gene sets related to axon guidance were consistently enriched in high GLI1 group (Figure 3A). Because the classic targets of Hh pathways such as GLI1, GLI2, and HHIP have been discovered in human pancreatic cancers, we performed GSEA using GSE16515 derived from pancreatic cancers.23 Compatible with our GSEA data using GDS1732 and GSE33630, the gene set encompassing the axon guidance was significantly enriched in pancreatic cancers with high GLI1 expression (supplementary Figure 7, http://links.lww.com/MD/A305). To validate the results of our GSEA, we performed qPCR, using cDNA derived from GLI1 groups I (n = 7) and III (n = 7), to detect mRNAs encoding actin binding LIM protein family, member 3 (ABLIM3); nuclear factor of activated T-cells, cytoplasmic, calcineurin-dependent 4 (NFATc4); L1 cell-adhesion molecule (L1CAM); sema domain, immunoglobulin domain, short basic domain, secreted, (semaphorin) 3D (SEMA3D); feline sarcoma oncogene (FES); plexin B3 (PLXNB3); sema domain, transmembrane domain, and cytoplasmic domain, (semaphorin) 6A (SEMA6A); roundabout, axon guidance receptor, homolog 3 (ROBO3); EPH receptor A8 (EPHA8). As expected, expression of all those axon guidance-related mRNAs was higher in group III than in group I (Figure 3B and C). In addition, IHC staining of paraffin-embedded tumor samples from the same patients used for the qRT-PCR analysis revealed that NFATc4, ABLIM3, and FES expressions are increased in high GLI1 PTC (Figure 4). Taken together, these data indicate that GLI1 expression is consistently associated with elevated aberrant expression of axon guidance genes.24,25 In addition, the correlation analyses using GSE33630, GLI2 mRNA expression showed a negative relationship with E-cadherin (CDH1) mRNA expression and a positive relationship with vimentin (VIM). Moreover, HHIP mRNA expression showed a negative relationship with VIM (data not shown) indicating GLI and HHIP expression might be also linked to these informative markers of the epithelial-mesenchymal transition (EMT).
FIGURE 3.
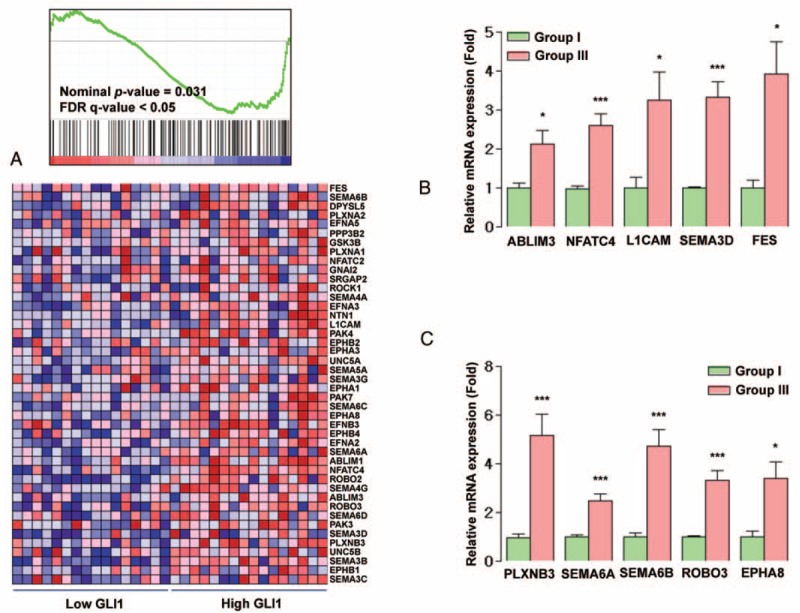
Relationship between expression levels of GLI1 and the KEGG axon guidance gene set. (A) GSEA using gene expression profiles selected from NCBI GEO Record GSE33630. (B and C) qRT-PCR analysis for representative axon guidance genes in 7 patients each from GLI1 groups I (ratio of GLI1 expression in PTC vs normal tissues in the lowest one third of all patients) and III (ratio in the highest one third). Means were compared and analyzed by Mann–Whitney U test. All data are means ± SEM, ∗P < 0.05, ∗∗P < 0.01, and ∗∗∗P < 0.001. GEO = Gene Expression Omnibus, GLI1 = glioma-associated oncogene homolog 1, GSEA = Gene Set Enrichment Analysis, NCBI = National Center for Biotechnology Information; PTC = papillary thyroid cancer, qRT-PCR = quantitative RT-PCR.
FIGURE 4.
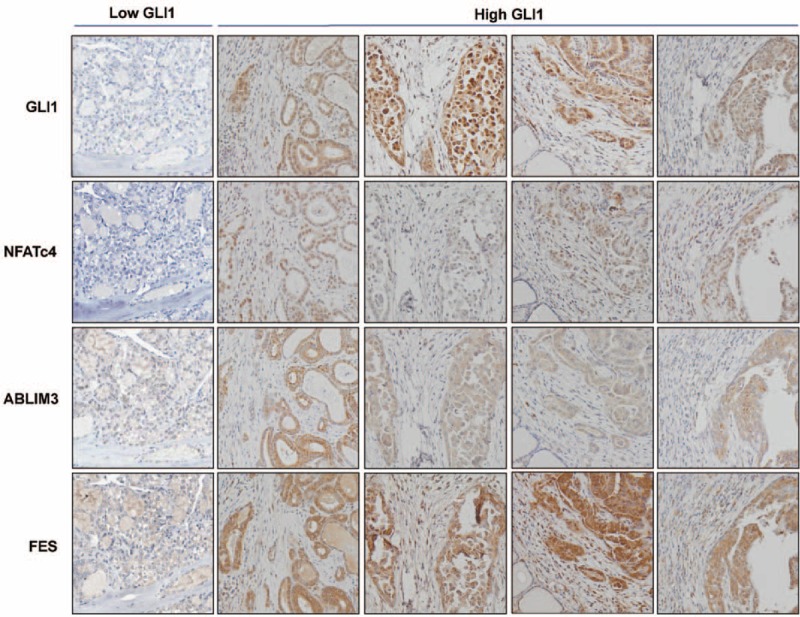
Representative IHC staining analysis for GLI1, NFATc4, ABLIM3, and FES in PTC from 1 patient in GLI1 group I and 2 patients classified into GLI1 group III (original magnification ×200). In low GLI1 PTC, GLI1, NFATc4, ABLIM3, and FES are barely detected. In high GLI1 PTC, GLI1, and NFATc4 are mainly detected in the nucleus. ABLIM3 and FES are exclusively located in the cytoplasm. FES = feline sarcoma oncogene, GLI1 = glioma-associated oncogene homolog 1, IHC = immunohistochemical, PTC = papillary thyroid cancer.
Validation Analyses Using the Public Data From the Cancer Genome Atlas Research Network
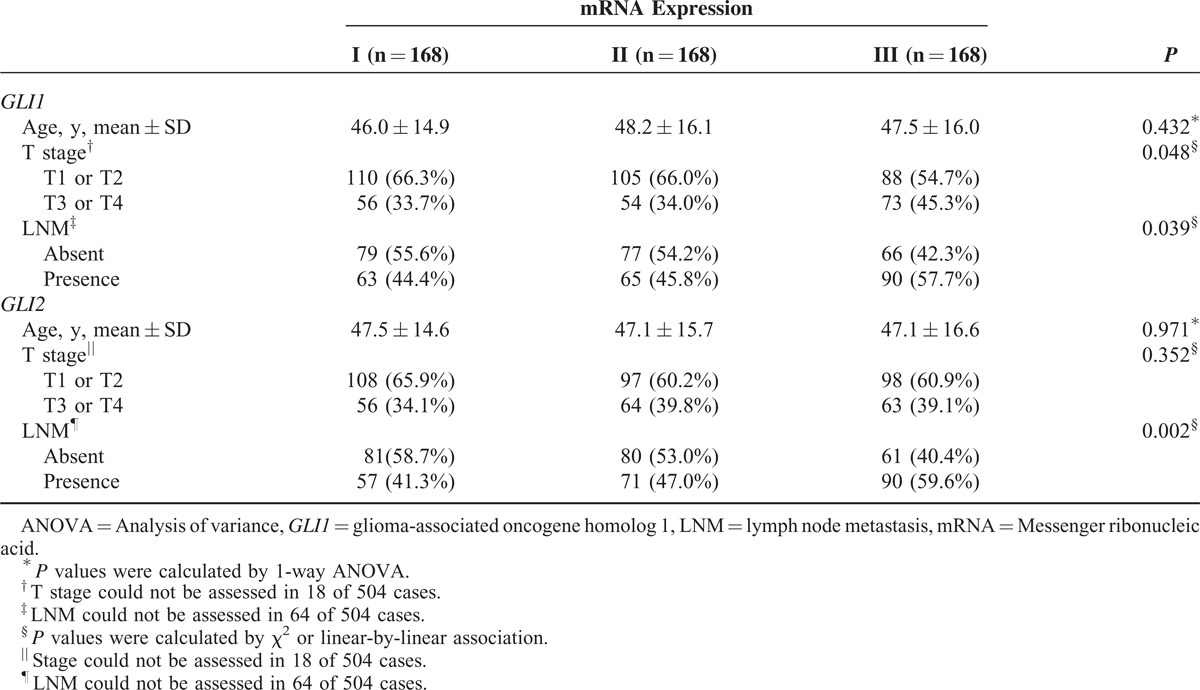
To verify our GSEA results, we performed additional analyses using the TCGA public data. As shown in Figure 5, the GLI1 and GLI2 mRNA expressions showed statistically significant positive correlation with the expressions of axon guidance genes such as ABLIM3, L1CAM, FES, PLXNB3, SEMA6A, SEMA6B, and ROBO3. Interestingly, the mRNA expressions of the EMT markers such as E-cadherin (CDH1) and VIM were exactly correspond to our idea (Figure 5H, I, S and T), but the expressions of AKT1 and mTOR1 were not related with the GLI1 mRNA expression (Figure 5J and K). In the validation of clinical data results, the TCGA public data indicated consistently that the GLI1 and GLI2 mRNA expressions can affect the clinical tumor progression (Table 5).
FIGURE 5.
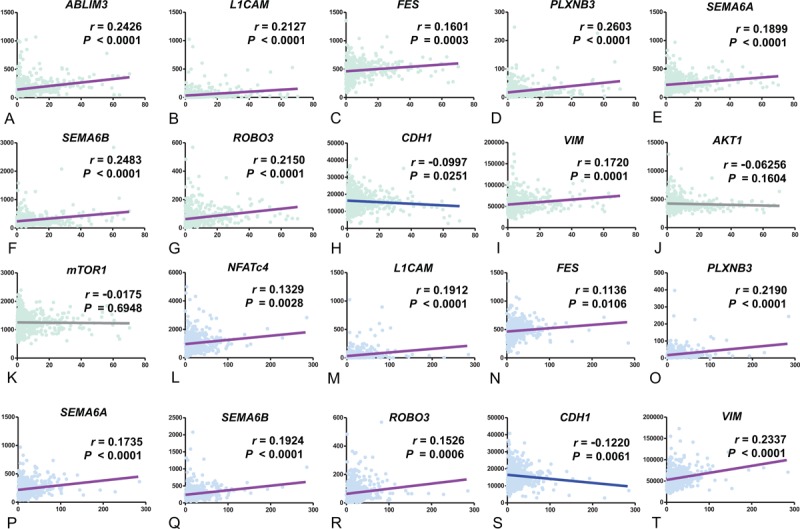
Correlation analyses of GLI1 (A-K) and GLI2 (L-T) with axon guidance genes using public repository data from The Cancer Genome Atlas Research Network. GLI1 = glioma-associated oncogene homolog 1, GLI2 = glioma-associated oncogene homolog 2.
TABLE 3 (Continued).
Analyses of Clinicopathological Parameters and mRNA Expression of the Central Components of Hh Pathway, According to Presence or Absence of LNM

TABLE 5.
Analysis of the Association of T Stage and LNM With GLI1 and GLI2 mRNA Levels Using Public Data From The Cancer Genome Atlas Research Network
DISCUSSION
ETE and LNM are important clinical and histological indicators that predict locoregional recurrence in patients with PTC. To date, however, the molecular details of the roles played by these 2 factors in PTC have remained unclear. One of the signature molecular mechanisms of tumor progression is EMT.26 Indeed, stem-like properties of cancer cells have been implicated in local invasion and metastasis.27 Consistent with this, expression levels of the EMT-associated factors Slug and Twist1 are elevated in thyroid cancers.28,29 In addition, overexpression of VIM, transforming growth factor-β (TGFβ), NF-κB, and integrin has been observed in invasive fronts of PTC.30–33 However, most studies of EMT have been performed in cell lines or tissues derived from ATC, and extensive verification of new EMT markers using clinical samples has not been performed.
Over the last 2 decades, many studies have mechanistically investigated the roles of aberrant activation or constitutive activation of the Hh pathway in cancer progression.14 Loss-of-function mutations in PTCH are frequently identified in BCC and MB.17,34 In addition, gain-of-function mutations in smoothened, frizzled class receptor (SMO), a G-protein-coupled receptor-like molecule that positively regulates Hh signaling, have also been detected in BCC, MB, and even in meningiomas.35 Ligand-dependent activation mechanism may also be important. For example, autocrine activation of the Hh pathway in tumor cells has been reported in cancers of the lung, breast, stomach, and prostate.36–39 Moreover, the Hh pathway may contribute to the maintenance and differentiation of cancer stem cells through ligand-dependent mechanisms.40
In this study, we compared relative mRNA expression of central components of the Hh pathway between PTC and matched normal tissues. These experiments revealed that PTC specimens expressed lower levels of the GLI1, GLI2, GLI3, HHIP, PTCH1, SHH, DHH, and IHH mRNAs than the corresponding matched normal tissues, suggesting that Hh pathway activity is reduced in PTC. In general, the zinc-finger transcription factor GLI1 and GLI2 act as the final effectors of upstream signaling pathways by inducing the expression of various genes in a context-specific manner. Hh target genes include GLI1, PTCH1, and HHIP. Although our qRT-PCR data did not demonstrate any relationship between GLI1 and PTCH1 expression levels in normal thyroid tissues (data not shown), we did observe a strong positive correlation between GLI1 and HHIP levels, indicating that the physiologically relevant negative-feedback loop is operational in normal follicular cells. However, this relationship disappeared in PTC, suggesting that the negative-feedback loop might be dysregulated in these cells, or alternatively that GLI1 expression is transcriptionally regulated independently of Hh signaling in these tumors PTC.41 Supporting our data, 2 NCBI DataSet Records (GDS1732 and GSE33630) did not show any correlation between GLI1 and HHIP expression in thyroid tumor tissues (data not shown).
Recently, BRAFV600E and TERT promoter mutations have been suggested to cooperatively identify recurrent PTC.42 In our study, GLI1 group III has more frequent TERT promoter C228T mutation. However, in our study, the prevalence (6.6%) of TERT promoter C228T mutation was relatively lower than previous western studies.10,43 In addition, TERT promoter C250T mutation was not detected. In fact, all of the PTCs in our study subjects were conventional PTC, which might be the reason of low frequency in TERT promoter mutations.10
A previous study suggested that the Hh pathway is activated in PTC, ATC, and follicular adenoma, as demonstrated by IHC staining to detect SHH, PTCH, SMO, and GLI1.44–46 However, those authors did not detect a correlation between Hh activation and any clinicopathological parameter. By contrast, in this study, we used qRT-PCR to quantitate mRNA levels in normal and tumor tissues, and then applied the resultant data to direct comparisons between paired samples. Through this approach, we could observe changes in Hh pathway-related gene expression separately in samples from individual patients, ultimately allowing us to categorize our study subjects into 3 groups according to Hh pathway activity. In particular, we divided our subjects into 3 groups, with group III expressing the highest ratio of GLI1 or GLI2 mRNA in PTC relative to normal tissue. Multivariate analyses revealed that patients in group III for GLI1 and GLI2 exhibited the highest risk of ETE and LNM, even after adjusting for clinicopathological parameters. Furthermore, HHIP group III was negatively associated with LNM.
However, genes encoding Hh pathway ligands, such as SHH, DHH, and IHH, were not valuable as prognostic indicators, and their expression levels were not related to those of GLI1, GLI2, and HHIP (data not shown). We postulated that these negative results reflect the role of the noncanonical GLI signaling in PTC.47,48 Moreover, GLI1 and GLI2 mRNA expressions were decreased in PTC compared with matched normal tissue indicating downregulation of Hh pathway might be occurred in carcinogenic process in PTC. Whereas, as our qRT-PCR data indicated, GLI1 and GLI2 group III showed small increases of mRNA expressions, suggesting the retention of GLI1 and GLI2 expression and/or the induction of GLI1 and GLI2 by noncanonical GLI signaling might be an important event in promoting more aggressive behavior in PTC. Indeed, although our correlation analyses using the TCGA data did not any correlation of the GLI1/2 mRNA expressions with AKT1 and mTOR1 expressions, recent molecular biological studies have revealed crosstalk between GLI signaling and the PI3K-AKT/mTOR pathways.49,50 Because the mRNA expressions of AKT1 and mTOR1 cannot be representative makers for AKT1 and mTOR1 activities, future studies need to be conducted to investigate the relationship of GLI signaling with the PI3K-AKT/mTOR pathways in PTC. Furthermore, TGFβ and constitutively active Kirsten rat sarcoma viral oncogene homolog have been reported to activate Hh signaling.51
In addition, our GSEA using data derived from a public repository revealed that GLI1 expression is coordinately regulated along with genes involved in axon guidance. Consistent with this, qRT-PCR data from our patients consistently indicated that GLI1 expression was closely related to expression of axon guidance genes such as ABLIM3, NFATc4, L1CAM, SEMA3D, FES, PLXNB3, SEMA6A, SEMA6B, ROBO3, and EPHA8 as further validated by IHC staining and the TCGA data analyses. These data suggest that GLI1 might be able to facilitate the EMT by inducing genes related to axon guidance. Supporting our idea, the mRNA expressions of the EMT markers such as CDH1 and VIM were accordingly related to the GLI1/2 expressions. Furthermore, our GSEA indicated that gene sets involved in neuroactive ligand–receptor interactions, cytokine–cytokine receptor interactions, and the Notch signaling pathways were also coordinately upregulated in association with GLI1 expression, suggesting these pathways might be involved in ETE and LNM in the context of GLI1-driven EMT. In the case of GLI2, the GSEA analysis using same data sets presented coordinately enrichment of gene sets involved in ribosome, DNA replication and pentose phosphate pathways suggesting sustained proliferative signaling (data not shown). Taken together, although we could not investigate the GLI1 and GLI2 expressions in the invasive front because of the ethical issues of our institute,33,52 all of our data from qRT-PCR, IHC, GSEA, statistical analyses using the TCGA data and our cohort consistently indicated that GLI1 and GLI2 expressions are linked to EMT and tumor progressions.
In summary, activation of the Hh pathway, as represented by GLI1 and GLI2 mRNA expression, predicts ETE and LNM and can therefore be considered a marker of poor prognosis. Future studies should investigate the molecular mechanisms underlying activation of GLI-mediated transcription in PTC, and the GLI proteins should be validated as novel drug targets. In addition, the noncanonical mechanisms of Hh pathway activation should be elucidated to improve our understanding of carcinogenesis in PTC.
Footnotes
Abbreviations: ABLIM3 = actin binding LIM protein family, member 3, ATC = anaplastic thyroid carcinoma, BCC = basal cell carcinoma, BRAF = v-raf murine sarcoma viral oncogene homolog B, CDH1 = E-cadherin, CLND = central lymph node dissection, DHH = Desert Hedgehog, EMT = epithelial-mesenchymal transition, EPHA8 = EPH receptor A8, ETE = extrathyroidal extension, FES = feline sarcoma oncogene, FTA = follicular adenoma, GLI1 = glioma-associated oncogene homolog 1, GLI2 = glioma-associated oncogene homolog 2, GSEA = Gene Set Enrichment Analysis, Hh = Hedgehog, HHIP = Hedgehog-interacting protein, IHC = immunohistochemical, IHH = Indian Hedgehog, L1CAM = L1 cell-adhesion molecule, LNM = lymph node metastasis, MB = medulloblastoma, NFATc4 = nuclear factor of activated T-cells, cytoplasmic, calcineurin-dependent 4, PLXNB3 = plexin B3, PTC = papillary thyroid cancer, PTCH = patched, ROBO3 = roundabout, axon guidance receptor. homolog 3, SEMA3D = sema domain, short basic domain, secreted, (semaphorin) 3D, SEMA6A = sema domain, cytoplasmic domain, (semaphorin) 6A, SHH = Sonic Hedgehog, TERT = telomerase reverse transcriptase, TGFβ = transforming growth factor-β, VIM = vimentin.
This study was supported by the National Research Foundation of Korea grant funded by the Korea government (MEST) (2012R1A2A2A01014672 and 2014R1A1A2059343).
The authors have no conflicts of interest to disclose.
Supplemental digital content is available for this article. Direct URL citations appear in the printed text and are provided in the HTML and PDF versions of this article on the journal's Website (www.md-journal.com).
REFERENCES
- 1.Mirallie E, Visset J, Sagan C, et al. Localization of cervical node metastasis of papillary thyroid carcinoma. World J Surg 1999; 23:970–973. [DOI] [PubMed] [Google Scholar]
- 2.Wada N, Duh QY, Sugino K, et al. Lymph node metastasis from 259 papillary thyroid microcarcinomas: frequency, pattern of occurrence and recurrence, and optimal strategy for neck dissection. Ann Surg 2003; 237:399–407. [DOI] [PMC free article] [PubMed] [Google Scholar]
- 3.Pereira JA, Jimeno J, Miquel J, et al. Nodal yield, morbidity, and recurrence after central neck dissection for papillary thyroid carcinoma. Surgery 2005; 138:1095–1100. [DOI] [PubMed] [Google Scholar]
- 4.Mazzaferri EL, Jhiang SM. Long-term impact of initial surgical and medical therapy on papillary and follicular thyroid cancer. Am J Med 1994; 97:418–428. [DOI] [PubMed] [Google Scholar]
- 5.DeGroot LJ, Kaplan EL, McCormick M, et al. Natural history, treatment, and course of papillary thyroid carcinoma. J Clin Endocrinol Metab 1990; 71:414–424. [DOI] [PubMed] [Google Scholar]
- 6.Henry JF, Gramatica L, Denizot A, et al. Morbidity of prophylactic lymph node dissection in the central neck area in patients with papillary thyroid carcinoma. Langenbecks Arch Surg 1998; 383:167–169. [DOI] [PubMed] [Google Scholar]
- 7.Lee YS, Kim SW, Kim SW, et al. Extent of routine central lymph node dissection with small papillary thyroid carcinoma. World J Surg 2007; 31:1954–1959. [DOI] [PubMed] [Google Scholar]
- 8.Alzahrani AS, Xing M. Impact of lymph node metastases identified on central neck dissection (CND) on the recurrence of papillary thyroid cancer: potential role of BRAFV600E mutation in defining CND. Endocr Relat Cancer 2013; 20:13–22. [DOI] [PMC free article] [PubMed] [Google Scholar]
- 9.Xing M, Alzahrani AS, Carson KA, et al. Association between BRAF V600E mutation and mortality in patients with papillary thyroid cancer. JAMA 2013; 309:1493–1501. [DOI] [PMC free article] [PubMed] [Google Scholar]
- 10.Liu X, Bishop J, Shan Y, et al. Highly prevalent TERT promoter mutations in aggressive thyroid cancers. Endocr Relat Cancer 2013; 20:603–610. [DOI] [PMC free article] [PubMed] [Google Scholar]
- 11.Riobo NA, Manning DR. Pathways of signal transduction employed by vertebrate Hedgehogs. Biochem J 2007; 403:369–379. [DOI] [PubMed] [Google Scholar]
- 12.Varjosalo M, Taipale J. Hedgehog: functions and mechanisms. Genes Dev 2008; 22:2454–2472. [DOI] [PubMed] [Google Scholar]
- 13.Jiang J, Hui CC. Hedgehog signaling in development and cancer. Dev Cell 2008; 15:801–812. [DOI] [PMC free article] [PubMed] [Google Scholar]
- 14.Scales SJ, de Sauvage FJ. Mechanisms of Hedgehog pathway activation in cancer and implications for therapy. Trends Pharmacol Sci 2009; 30:303–312. [DOI] [PubMed] [Google Scholar]
- 15.Eggenschwiler JT, Anderson KV. Cilia and developmental signaling. Annu Rev Cell Dev Biol 2007; 23:345–373. [DOI] [PMC free article] [PubMed] [Google Scholar]
- 16.Han YG, Kim HJ, Dlugosz AA, et al. Dual and opposing roles of primary cilia in medulloblastoma development. Nat Med 2009; 15:1062–1065. [DOI] [PMC free article] [PubMed] [Google Scholar]
- 17.Epstein EH. Basal cell carcinomas: attack of the Hedgehog. Nat Rev Cancer 2008; 8:743–754. [DOI] [PMC free article] [PubMed] [Google Scholar]
- 18.Rubin LL, de Sauvage FJ. Targeting the Hedgehog pathway in cancer. Nat Rev Drug Discov 2006; 5:1026–1033. [DOI] [PubMed] [Google Scholar]
- 19.Cohen DJ. Targeting the Hedgehog pathway: role in cancer and clinical implications of its inhibition. Hematol Oncol Clin North Am 2012; 26:565–588. [DOI] [PubMed] [Google Scholar]
- 20.Jo YS, Li S, Song JH, et al. Influence of the BRAF V600E mutation on expression of vascular endothelial growth factor in papillary thyroid cancer. J Clin Endocrinol Metab 2006; 91:3667–3670. [DOI] [PubMed] [Google Scholar]
- 21.Subramanian A, Tamayo P, Mootha VK, et al. Gene Set Enrichment Analysis: a knowledge-based approach for interpreting genome-wide expression profiles. Proc Natl Acad Sci U S A 2005; 102:15545–15550. [DOI] [PMC free article] [PubMed] [Google Scholar]
- 22.Cancer Genome Atlas Research N. Integrated genomic characterization of papillary thyroid carcinoma. Cell 2014; 159:676–690. [DOI] [PMC free article] [PubMed] [Google Scholar]
- 23.Morris JP, 4th, Wang SC, Hebrok M, et al. Wnt and the twisted developmental biology of pancreatic ductal adenocarcinoma. Nat Rev Cancer 2010; 10:683–695. [DOI] [PMC free article] [PubMed] [Google Scholar]
- 24.Chedotal A, Kerjan G, Moreau-Fauvarque C. The brain within the tumor: new roles for axon guidance molecules in cancers. Cell Death Differ 2005; 12:1044–1056. [DOI] [PubMed] [Google Scholar]
- 25.Biankin AV, Waddell N, Kassahn KS, et al. Pancreatic cancer genomes reveal aberrations in axon guidance pathway genes. Nature 2012; 491:399–405. [DOI] [PMC free article] [PubMed] [Google Scholar]
- 26.Hanahan D, Weinberg RA. Hallmarks of cancer: the next generation. Cell 2011; 144:646–674. [DOI] [PubMed] [Google Scholar]
- 27.Al-Hajj M, Clarke MF. Self-renewal and solid tumor stem cells. Oncogene 2004; 23:7274–7282. [DOI] [PubMed] [Google Scholar]
- 28.Salerno P, Garcia-Rostan G, Piccinin S, et al. TWIST1 plays a pleiotropic role in determining the anaplastic thyroid cancer phenotype. J Clin Endocrinol Metab 2011; 96:E772–E781. [DOI] [PubMed] [Google Scholar]
- 29.Buehler D, Hardin H, Shan W, et al. Expression of epithelial-mesenchymal transition regulators SNAI2 and TWIST1 in thyroid carcinomas. Mod Pathol 2013; 26:54–61. [DOI] [PMC free article] [PubMed] [Google Scholar]
- 30.Riesco-Eizaguirre G, Rodriguez I, De la Vieja A, et al. The BRAFV600E oncogene induces transforming growth factor beta secretion leading to sodium iodide symporter repression and increased malignancy in thyroid cancer. Cancer Res 2009; 69:8317–8325. [DOI] [PubMed] [Google Scholar]
- 31.Knauf JA, Sartor MA, Medvedovic M, et al. Progression of BRAF-induced thyroid cancer is associated with epithelial-mesenchymal transition requiring concomitant MAP kinase and TGFbeta signaling. Oncogene 2011; 30:3153–3162. [DOI] [PMC free article] [PubMed] [Google Scholar]
- 32.Ma R, Minsky N, Morshed SA, et al. Stemness in human thyroid cancers and derived cell lines: the role of asymmetrically dividing cancer stem cells resistant to chemotherapy. J Clin Endocrinol Metab 2014; 99:E400–E409. [DOI] [PMC free article] [PubMed] [Google Scholar]
- 33.Vasko V, Espinosa AV, Scouten W, et al. Gene expression and functional evidence of epithelial-to-mesenchymal transition in papillary thyroid carcinoma invasion. Proc Natl Acad Sci U S A 2007; 104:2803–2808. [DOI] [PMC free article] [PubMed] [Google Scholar]
- 34.Evans DG, Farndon PA, Burnell LD, et al. The incidence of Gorlin syndrome in 173 consecutive cases of medulloblastoma. Br J Cancer 1991; 64:959–961. [DOI] [PMC free article] [PubMed] [Google Scholar]
- 35.Reifenberger J, Wolter M, Weber RG, et al. Missense mutations in SMOH in sporadic basal cell carcinomas of the skin and primitive neuroectodermal tumors of the central nervous system. Cancer Res 1998; 58:1798–1803. [PubMed] [Google Scholar]
- 36.Watkins DN, Berman DM, Burkholder SG, et al. Hedgehog signalling within airway epithelial progenitors and in small-cell lung cancer. Nature 2003; 422:313–317. [DOI] [PubMed] [Google Scholar]
- 37.Mukherjee S, Frolova N, Sadlonova A, et al. Hedgehog signaling and response to cyclopamine differ in epithelial and stromal cells in benign breast and breast cancer. Cancer Biol Ther 2006; 5:674–683. [DOI] [PMC free article] [PubMed] [Google Scholar]
- 38.Berman DM, Karhadkar SS, Maitra A, et al. Widespread requirement for Hedgehog ligand stimulation in growth of digestive tract tumours. Nature 2003; 425:846–851. [DOI] [PubMed] [Google Scholar]
- 39.Karhadkar SS, Bova GS, Abdallah N, et al. Hedgehog signalling in prostate regeneration, neoplasia and metastasis. Nature 2004; 431:707–712. [DOI] [PubMed] [Google Scholar]
- 40.Merchant AA, Matsui W. Targeting Hedgehog—a cancer stem cell pathway. Clin Cancer Res 2010; 16:3130–3140. [DOI] [PMC free article] [PubMed] [Google Scholar]
- 41.Lauth M, Toftgard R. Non-canonical activation of GLI transcription factors: implications for targeted anti-cancer therapy. Cell Cycle 2007; 6:2458–2463. [DOI] [PubMed] [Google Scholar]
- 42.Xing M, Liu R, Liu X, et al. BRAF V600E and TERT promoter mutations cooperatively identify the most aggressive papillary thyroid cancer with highest recurrence. J Clin Oncol 2014; 32:2718–2726. [DOI] [PMC free article] [PubMed] [Google Scholar]
- 43.Liu X, Qu S, Liu R, et al. TERT promoter mutations and their association with BRAF V600E mutation and aggressive clinicopathological characteristics of thyroid cancer. J Clin Endocrinol Metab 2014; 99:E1130–E1136. [DOI] [PMC free article] [PubMed] [Google Scholar]
- 44.Xu X, Ding H, Rao G, et al. Activation of the Sonic Hedgehog pathway in thyroid neoplasms and its potential role in tumor cell proliferation. Endocr Relat Cancer 2012; 19:167–179. [DOI] [PubMed] [Google Scholar]
- 45.Bohinc B, Michelotti G, Diehl AM. Hedgehog signaling in human medullary thyroid carcinoma: a novel signaling pathway. Thyroid 2013; 23:1119–1126. [DOI] [PMC free article] [PubMed] [Google Scholar]
- 46.Hinterseher U, Wunderlich A, Roth S, et al. Expression of Hedgehog signalling pathway in anaplastic thyroid cancer. Endocrine 2014; 45:439–447. [DOI] [PubMed] [Google Scholar]
- 47.Aberger F, Kern D, Greil R, et al. Canonical and noncanonical Hedgehog/GLI signaling in hematological malignancies. Vitam Horm 2012; 88:25–54. [DOI] [PubMed] [Google Scholar]
- 48.Karamboulas C, Ailles L. Developmental signaling pathways in cancer stem cells of solid tumors. Biochim Biophys Acta 2013; 1830:2481–2495. [DOI] [PubMed] [Google Scholar]
- 49.Riobo NA, Lu K, Ai X, et al. Phosphoinositide 3-kinase and Akt are essential for Sonic Hedgehog signaling. Proc Natl Acad Sci U S A 2006; 103:4505–4510. [DOI] [PMC free article] [PubMed] [Google Scholar]
- 50.Wang Y, Ding Q, Yen CJ, et al. The crosstalk of mTOR/S6K1 and Hedgehog pathways. Cancer Cell 2012; 21:374–387. [DOI] [PMC free article] [PubMed] [Google Scholar]
- 51.Amakye D, Jagani Z, Dorsch M. Unraveling the therapeutic potential of the Hedgehog pathway in cancer. Nat Med 2013; 19:1410–1422. [DOI] [PubMed] [Google Scholar]
- 52.Vasko V, Saji M, Hardy E, et al. Akt activation and localisation correlate with tumour invasion and oncogene expression in thyroid cancer. J Med Genet 2004; 41:161–170. [DOI] [PMC free article] [PubMed] [Google Scholar]


