Abstract
The purpose of this work was to develop a quantitative method for evaluating the pulmonary inflammatory process (PIP) through the computational analysis of chest radiography exams in posteroanterior (PA) and lateral views. The quantification procedure was applied to patients with tuberculosis (TB) as the motivating application.
A study of high-resolution computed tomography (HRCT) examinations of patients with TB was developed to establish a relation between the inflammatory process and the signal difference-to-noise ratio (SDNR) measured in the PA projection. A phantom essay was used to validate this relation, which was implemented using an algorithm that is able to estimate the volume of the inflammatory region based solely on SDNR values in the chest radiographs of patients.
The PIP volumes that were quantified for 30 patients with TB were used for comparisons with direct HRCT analysis for the same patient. The Bland–Altman statistical analyses showed no significant differences between the 2 quantification methods. The linear regression line had a correlation coefficient of R2 = 0.97 and P < 0.001, showing a strong association between the volume that was determined by our evaluation method and the results obtained by direct HRCT scan analysis.
Since the diagnosis and follow-up of patients with TB is commonly performed using X-rays exams, the method developed herein can be considered an adequate tool for quantifying the PIP with a lower patient radiation dose and lower institutional cost. Although we used patients with TB for the application of the method, this method may be used for other pulmonary diseases characterized by a PIP.
INTRODUCTION
Pulmonary diseases, including tuberculosis (TB) infection, cause an unacceptably large number of deaths, even given that most are preventable if people can access healthcare for proper diagnosis and treatment.1,2 The launch of a new international strategy for TB care and control by the World Health Organization (WHO) in the mid-1990s allowed the development of new diagnostic and treatment methods.1,2 While new treatments for TB are being developed, tools that are used to monitor the efficacy of TB treatments and quantify the disease remain limited and antiquated in both preclinical and clinical settings.3
Tuberculosis and others pulmonary diseases involve inflammation of the lung parenchyma, resulting in ongoing fibrotic scar formation of the pulmonary interstitium and alveoli.4,5 Chest radiography and sputum bacilloscopy are the primary tools for medical examination and the routine diagnosis of TB, even in well-equipped medical centers where skin testing is available.6,7 Physicians generally make decisions on TB cases mainly based on radiologic findings, combined with demographic and clinical data.6,8 High-resolution computed tomography (HRCT) can be useful when chest radiographs are inconclusive or complications of TB are suspected.9 However, this method results in higher radiation doses for the patients (ie, 2 orders of magnitude higher than radiographic examinations) and is associated with extremely high costs to the institution compared with chest radiography.10–12 Moreover, in many cases the chest radiography is the only imaging examination in the diagnosis and follow-up of the patient.6,8
The quantification of TB by radiologists is commonly done on visual and subjective examination. An objective quantification tool is greatly important for the reliable and accurate assessment of TB's pulmonary inflammatory process (PIP).3 Reliable assessment helps physicians with follow-up of the patient's disease.3 The preliminary TB diagnosis is normally realized through chest radiography. However, the objective quantification of pulmonary diseases has been developed with HRCT scans3,4,13–15 because of its higher resolution.16
The purpose of this work was to develop an objective method for PIP quantification using chest radiography. The viability of the quantification of PIP based on radiography is demonstrated, with a lower radiation dose and cost, without the loss of a secure medical diagnosis or treatment follow-up. Furthermore, this method allows assess objectively patients which have only X-rays exams.
METHODS
Patient Selection
This study was developed with ethical approval from the authors’ institutions and national review panels under protocol number 8773-2013. The research involved 30 patients who were diagnosed with pulmonary TB and treated at the Infectious and Parasitic Diseases Service of the University Hospital, Botucatu Medical School, São Paulo State University, Brazil, between January 2007 and May 2014. The gender distribution was predominantly male (24 [80.0%]). The mean age of the patients was 49.7 ± 12.5 years.
The inclusion criteria were the following: patients with confirmed TB based on bacilloscopy, mycobacterium isolation in culture medium,17,18 and patients who underwent HRCT and chest radiography within a 7-day interval. Patients were excluded if they had any other disease that could compromise the lungs, systemic disease, or aggravating factors except smoking and alcoholism. Importantly, 63.3% of the patients were smokers, and 50.0% were alcoholics.
Data Acquisition
The X-ray exams were performed in an Agfa computed radiography (CR) system, with a 12-pulse 3-phase X-ray equipment (Multix B, Siemens AG Medical Engineering, Erlangen, Germany) and a CR-85X Reader (Agfa-Gevaert Group, Mortsel, Belgium) with MD 4.0 general cassette plates (43 cm × 35 cm2; effective pixel pitch, 0.1 mm). The source-detector distance was 180 cm. The HRCT scans were acquired using a Toshiba Activion 16 Helicoidal (Toshiba America Medical Systems, Tustin, CA) with the following parameters: the pixel size ranged from 0.59 mm × 0.59 mm to 0.80 mm × 0.80 mm, 512 × 512 pixel matrix, 5.0 mm increment between slices, 5.0 mm slice width and a tube voltage of 120 kV.
Patient Lung Volume Estimation
A semiautomatic algorithm was developed in Matlab R2013a (Mathworks, Natick, MA) for the objective quantification of PIP based on chest radiography. The lung was manually segmented from the X-ray exams by a radiologist in both the sagittal plane (lateral view) and coronal plane (PA—posteroanterior view), as shown in Figure 1A and B, respectively. The inflammatory process was segmented only in the coronal plane (Figure 1C) because the sagittal plane contains more superimposed structures.19
FIGURE 1.
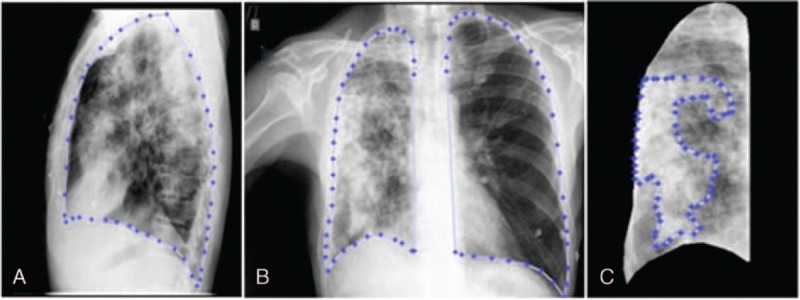
Manual lung segmentation performed by a radiologist. (A) Segmented lung in sagittal plane (lateral view). (B) Segmented lung in coronal plane (PA view). (C) Segmentation of pulmonary inflammatory process in coronal plane view of right lung.
The total volume of the lungs was obtained by the intersection of segmented lungs in sequentially expanded coronal and sagittal planes (Figure 2A and B), which is later used to calculate the PIP volume ratio.
FIGURE 2.
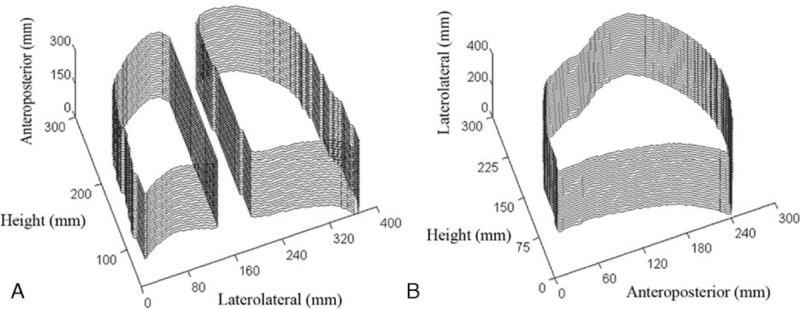
Segmented lungs in sequentially expanded coronal (A) and sagittal (B) planes.
Pulmonary Inflammatory Process and Correlation With SDNR in the Coronal Plane
The analysis consisted of employing measurements of PIP portions from chest radiography and HRCT in the same anatomical region. In the radiographic PA projection, the signal difference-to-noise ratio (SDNR) for the region of interest (ROI) was calculated. The current expression to define this quantity20 is given in Equation (1), where A is the average pixel intensity of the ROI of PIP, and B and C are the average pixel intensity and standard deviation of the healthy lung in a similar ROI (considered standard background), respectively.
 |
The ROIs that were evaluated by chest radiography (coronal plane) were small circular projections (∼40 mm2) of the PIP area measured from HRCT (axial plane). After locating the area in the HRCT slices that referred to the ROI from chest radiography, the PIP portion and total length of lung tissue of the area were measured. These measurements were performed very precisely in pixel unity of the HRCT scan after thresholding the slice images from HRCT. This threshold process separated the pulmonary structures of interest (inflammatory process and healthy tissue) in segmented regions using the intensity of the pixels in the slice histogram in Hounsfield Units. Morphological operations were applied to reduce false-positive pixels.15 The ratio of PIP portion to its total length in the evaluated area was defined as the Mean Fractional Length of Inflammatory Processes (MFLIP). This analysis was applied in 15 patients based on both HRCT and chest radiography to determine the relation between MFLIP and SDNR. For this, MFLIP values were plotted against corresponding SNDRs and a curve adjustment was made.
MFLIP Versus SDNR Behavior in a Phantom Essay
The observed relation for the patient examinations was validated with a phantom radiographic analysis. Different homogeneous volumes of inflammatory processes were implemented using 10 steps in a chest homogeneous phantom with appropriate thicknesses to simulate the desired volume of PIP tissue, as shown in Figure 3.
FIGURE 3.
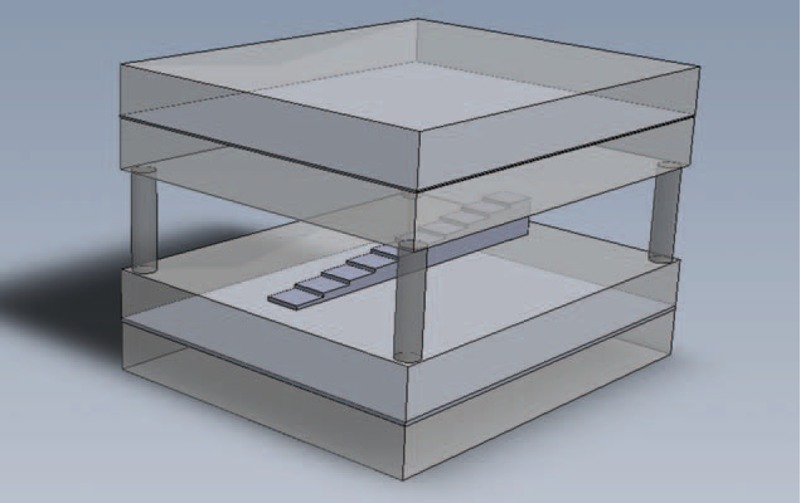
Structure of the chest homogeneous phantom used to simulate different volumes of pulmonary inflammatory processes and healthy lung background. The homogeneous phantom was constructed of 4 acrylic slabs (2.54 cm of thickness), an air gap (5.08 cm of thickness) and 2 aluminum plates (1.0 and 2.0 mm of thickness). All of the plates used measured 30.5 cm × 30.5 cm. The PIP volumes were simulated by 10 steps of polyvinyl chloride placed in the center of the phantom.
The chest homogeneous phantom consisted of 4 pieces of acrylic, 2 pieces of aluminum, and an air gap. The first acrylic pair (at the top) sandwiched a 1.0 mm aluminum plate. The second acrylic pair (at the bottom) contained a slightly wider (2 mm) aluminum slab inside. The second aluminum plate was designed to account for the greater amount of bone tissue, which results from the presence of the vertebral column.21 Between the upper and lower pairs of plates, an air gap of 5.08 cm was inserted.22 All of the plates used measured 30.5 × 30.5 cm2. The PIP volumes were simulated by 10 steps of polyvinyl chloride (PVC) placed in the center of the phantom.23
The phantom radiographic images were taken from the top to bottom using 3 different radiographic techniques that are currently used in the clinical routine: 85 kVp, 3.2 mAs; 90 kVp, 2.8 mAs, and 117 kVp, 1.25 mAs. The SDNRs were determined between each phantom's step and the ROI of the background (healthy lung tissue). The MFLIP versus SDNR behavior from the phantom essay was plotted and compared with the relation obtained from patients examinations, described in the section above.
Inflammatory Volume Determined From Radiography in Coronal and Sagittal Planes
Based on the mean SDNR in the areas segmented as PIP in the coronal plane and the relation obtained from patients examinations, the MFLIP that corresponds to that area can be directly determined. This fraction is multiplied by the lung length that is obtained by radiography in the sagittal plane to provide the length of the inflammatory process associated with that area. The PIP volume is then obtained through a disk dilation process. The objective quantification is calculated by the inflammatory process and lung volume ratio.
To evaluate the accuracy of the radiograph's quantification method based on the X-ray exams, the results of 30 patients were compared with HRCT's direct quantification method as a standard procedure.15 Statistical linear regressions and mean percentage differences were performed based on data from both methods for the same patient. The error measurement was made according to Bland and Altman.24 In order to visually compare the efficacy of the developed method, we reconstructed the 3D shaded surface of the lungs from HRCT and X-rays examinations for the same patient, highlighting the PIP. HRCT reconstruction was performed after threshold process of the healthy lung and PIP in each slice.
RESULTS
The obtained relation between MFLIP and SDNR from the analysis of 15 patient examinations is plotted in Figure 4, with an exponential curve adjustment. The regression for the adjustment of the curve had R2 = 0.80 with 95% prediction intervals. The 2 dashed curves display the limits of 2 SD of the data around the adjusted curve shown by the solid line, given by
FIGURE 4.
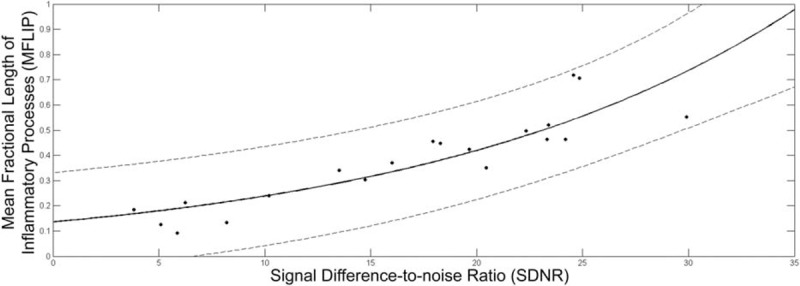
Relation between MFLIP and SDNR extracted from the analysis of 15 patient examinations, correlating measurements in the HRCT scan and PA radiographic exams of the patients, respectively. The analyzed points were adjusted with an exponential curve (solid line), with R2 = 0.80. The 2 dashed curves display the limits of 2 SD around the adjusted curve.
The MFLIP versus SDNR behavior that was extracted from the phantom image measurements for each step is plotted in Figure 5. The dashed curves reflect an exponential function adjustment to the points for the 3 different radiographic techniques in relation to the normalized steps, simulating different PIP volumes. For this analysis, the adjustment leads to R2 = ∼0.98 for each of the dashed curves for the different radiographic techniques. Figure 5 also shows the exponential curve that resulted from the study with the patient examinations (solid line).
FIGURE 5.
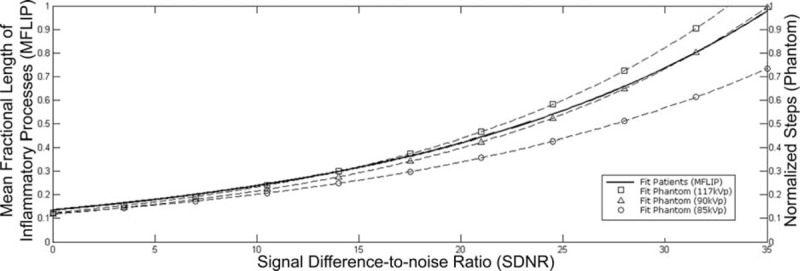
MFLIP versus SDNR behavior for the chest homogeneous phantom essays for 3 different radiographic techniques currently used in the clinical routine (dashed lines). The dashed lines reflect an exponential function adjustment (R2 = ∼0.98) of SDNR for each normalized steps. The solid line represents the relation obtained from patient examinations (Equation 2).
The volume quantification method that is presented herein and the direct measurement based on HRCT were compared from 30 patient examinations. The mean percentage difference between both methods was 9.2 ± 6.0%. The linear regression line between them (Figure 6A) was y = 1.02x + 0.03, with a correlation coefficient of R2 = 0.97 and P < 0.001. The statistical Bland–Altman plot is shown in Figure 6B for the difference and average between the 2 methods.
FIGURE 6.

Volume quantification agreement of the proposed method (chest radiograph), compared with reference standard (HRCT) for 30 patients with TB. (A) Linear regression line were determined by y = 1.02x + 0.03, with R2 = 0.97, demonstrating low dispersion between data. (B) Bland–Altman plot for both quantification methods. The difference refers to the reference standard minus the developed method. The central line corresponds to the mean value of deviations. The dashed lines indicate the interval of 2 SD, indicating an adequate level of statistical agreement.
An illustration of 3D shaded surface of the lungs from HRCT and X-rays examinations, highlighting the PIP is shown in Figure 7. The reconstruction of HRCT was realized after segmentation between healthy lung and PIP as shown in Figure 7A. The developed method was tested for the same patient, as illustrated in Figure 7B, and shows a visual similarity between both quantification methods.
FIGURE 7.

Reconstruction of 3D shaded surface of the lungs and pulmonary inflammatory process based on HRCT (A) visually compared with the presented quantification method using chest radiographs (B) for the same patient.
DISCUSSION
Our work focused on objective PIP quantification using TB model. We present a practical and objective method based on chest radiographs exams, obtaining a lower radiation dose and cost when compared with HRCT examinations.
The functional form of the curve, shown in Figure 4, was guided by the general exponential decay law of X-ray beam attenuation in tissue and material.25 Fluctuations of points around the adjusted curve occurs mainly due to variations in some elements of analysis, such as the different lengths of the lung in the axial plane according to the chosen region, points extracted from different anatomical profiles of patients, and the use of different radiographic techniques in the analyzed PA view of the patient exams. Despite this diversified nature of the data, the regression for the adjustment of the curve had R2 = 0.80 with 95% prediction intervals. However, the use of standardized radiographic technique in the follow-up of patients with TB will reduce fluctuations and increase the method accuracy.
Importantly, the exponential MFLIP versus SDNR behavior obtained in study of patient examinations was quite well reproduced by the phantom essay using the intermediate radiographic techniques, as shown in Figure 5. The phantom steps have a homogeneous structure. The background is also homogeneous, and the radiographic techniques are known. The exponential model adjustments are nearly perfect for the points from the different techniques. The phantom analysis provides a good level of confidence for the MFLIP versus SDNR relation extracted from patient examinations to determine inflammatory volumes directly from SDNRs in chest radiographs.
From the statistical analyses for the comparison between both quantification methods, the linear regression showed a strong association and low dispersion between variables. The Bland–Altman analyses showed no significant differences (P = −0.3%) between the 2 quantification methods. The limits of agreement at a 95% confidence interval were −2.1% and 1.5%. These differences were sufficiently small to have the same confidence level for the results for both quantification methods. The mean percentage difference between the present volume evaluation and HRCT quantifications was approximately 9% and can be attributed to the influence of superimposed structures (clavicles, ribs, and abnormalities)19,26 in the determination of SDNRs in radiographic images and the approximations incorporated into the adjustment and average values assumed by the method. Furthermore, in most cases, chest radiographs for patients with TB contain areas with diffuse abnormalities26 that can interfere with radiologists’ manual segmentation. Despite these differences, an analysis of Figure 7 shows a visual agreement between both quantification methods.
Various segmentation and quantification methods of anatomical structures and lung diseases are available in the literature which are based on radiographs19,27–29 and computed tomography (CT)3,14,15,30,31 examinations. These methods, manual or automatically, include visual quantitation scoring systems, image display, and anatomic image quantification.32 While these methods based on radiographs often use measurements on a 2D plane, volume and surface metrics are performed using CT examinations. The work reported here presents a volumetric quantification of PIP through chest radiographs, with reduction in radiation dose and cost. This represents an advantage when compared with HRCT examinations.
Recent developments in CT equipment are helping to reduce radiation dose without decreasing image quality. These equipment use alternative techniques of image reconstruction with iterative reconstruction (IR) algorithms to produce high-resolution images with low-dose protocol.33,34 All major CT vendors have recently introduced commercial IR algorithms.35 Despite low-dose CT has been extensively used,36,37 our method is applicable in institutions where such equipments are not available. Additionally, chest radiographs is being recommended by the WHO as the first-line imaging modality for TB diagnosis and screening.7,28 Other important advantage is that our method represents a low cost solution to diagnosis and follow-up of pulmonary disease. Furthermore, the proposed method is faster, about 3 minutes per exam, when compared to evaluation by HRCT, due to the low number of images.
CONCLUSION
The method developed herein proved to be efficient and applicable for the objective quantification of PIP caused by TB based on chest radiographs. This tool is important for patient care for diagnosis and monitoring the progression of the disease and therapeutic response. Although we used a TB model, this quantification methodology may be applied to other pulmonary diseases characterized by a PIP. Since the diagnosis and follow-up of patients with TB is commonly performed using X-rays exams, the method developed herein can help quantify pulmonary disease with lower radiation doses for the patient and lower institutional costs. Satisfactory precision in the quantification of inflammatory volume can be reached at doses that are orders of magnitude less than those used in direct HRCT analysis.
Acknowledgments
The authors thank Botucatu Medical School and CVE/SES-SP “Prof. Alexandre Vranjac” (GVE XVI—Botucatu) for support. The authors are also grateful to the Brazilian agencies CAPES, CNPQ, and FAPESP for their financial support.
Footnotes
Abbreviations: CR = computed radiography, CT = computed tomography, HRCT = high-resolution computed tomography, MFLIP = mean fractional length of inflammatory processes, PA = posteroanterior, PIP = pulmonary inflammatory process, PVC = polyvinyl chloride, ROI = region of interest, SDNR = signal difference-to-noise ratio, TB = tuberculosis, WHO = World Health Organization.
The authors have no funding or conflicts of interest to disclose.
REFERENCES
- 1.Baddeley A, Dean A, Dias HM, et al. Global Tuberculosis Report 2014. Geneva: World Health Organization; 2014. [Google Scholar]
- 2.Baddeley A, Dean A, Dias HM, et al. Global Tuberculosis Report 2013. Geneva: World Health Organization; 2013. [Google Scholar]
- 3.Xu Z, Bagci U, Kubler A, et al. Computer-aided detection and quantification of cavitary tuberculosis from CT scans. Med Phys 2013; 40:113701. [DOI] [PMC free article] [PubMed] [Google Scholar]
- 4.Zavaletta VA, Bartholmai BJ, Robb RA. High resolution multidetector CT-aided tissue analysis and quantification of lung fibrosis. Acad Radiol 2007; 14:772–787. [DOI] [PMC free article] [PubMed] [Google Scholar]
- 5.Huang H, Lu PX. Paving-stone CT finding in a pulmonary tuberculosis patient. Quant Imaging Med Surg 2013; 3:282–283. [DOI] [PMC free article] [PubMed] [Google Scholar]
- 6.Tan JH, Acharya UR, Tan C, et al. Computer-assisted diagnosis of tuberculosis: a first order statistical approach to chest radiograph. J Med Syst 2012; 36:2751–2759. [DOI] [PubMed] [Google Scholar]
- 7.Ahmedov S, Ayles H, Blok L, et al. Systematic Screening for Active Tuberculosis: Principles and Recommendations. Geneva: World Health Organization; 2013. [PubMed] [Google Scholar]
- 8.Shen R, Cheng I, Basu A. A hybrid knowledge-guided detection technique for screening of infectious pulmonary tuberculosis from chest radiographs. IEEE Trans Biomed Eng 2010; 57:2646–2656. [DOI] [PubMed] [Google Scholar]
- 9.Kim WS, Choi JI, Cheon JE, et al. Pulmonary tuberculosis in infants: radiographic and CT findings. AJR Am J Roentgenol 2006; 187:1024–1033. [DOI] [PubMed] [Google Scholar]
- 10.Bindman R, Lipson J, Marcus M, et al. Radiation dose associated with common computed tomography examinations and the associated lifetime attributable risk of cancer. Arch Intern Med 2009; 169:2078–2086. [DOI] [PMC free article] [PubMed] [Google Scholar]
- 11.Blackmore CC, Ramsey SD, Mann FA, et al. Cervical spine screening with CT in trauma patients: a cost-effectiveness analysis. Radiology 1999; 212:117–125. [DOI] [PubMed] [Google Scholar]
- 12.Mettler FA, Jr, Huda W, Yoshizumi TT, et al. Effective doses in radiology and diagnostic nuclear medicine: a catalog. Radiology 2008; 248:254–263. [DOI] [PubMed] [Google Scholar]
- 13.De Langhe E, Vande Velde G, Hostens J, et al. Quantification of lung fibrosis and emphysema in mice using automated micro-computed tomography. PLoS One 2012; 7:e43123. [DOI] [PMC free article] [PubMed] [Google Scholar]
- 14.Rosas IO, Yao J, Avila NA, et al. Automated quantification of high-resolution CT scan findings in individuals at risk for pulmonary fibrosis. Chest 2011; 140:1590–1597. [DOI] [PMC free article] [PubMed] [Google Scholar]
- 15.Alvarez M, Pina DR, de Oliveira M, et al. Objective CT-based quantification of lung sequelae in treated patients with paracoccidioidomycosis. Medicine 2014; 93:e167. [DOI] [PMC free article] [PubMed] [Google Scholar]
- 16.Hatipoglu ON, Osma E, Manisali M, et al. High resolution computed tomographic findings in pulmonary tuberculosis. Thorax 1996; 51:397–402. [DOI] [PMC free article] [PubMed] [Google Scholar]
- 17.Zumla A, Raviglione M, Hafner R, et al. Tuberculosis. N Engl J Med 2013; 368:745–755. [DOI] [PubMed] [Google Scholar]
- 18.Oliva VM, Cezário GAG, Cocato RA, et al. Pulmonary tuberculosis: hematology, serum biochemistry and the relation with the disease duration. J Venom Anim Toxins Incl Trop Dis 2008; 14:71–81. [Google Scholar]
- 19.van Ginneken B, ter Haar Romeny BM. Automatic segmentation of lung fields in chest radiographs. Med Phys 2000; 27:2445–2455. [DOI] [PubMed] [Google Scholar]
- 20.Bloomquist A, Bosmans H, Burch A, et al. IAEA Human Health Series No.17: Quality Assurance Programme for Digital Mammography. Vienna: International Atomic Energy Agency; 2011. [Google Scholar]
- 21.Pina DR, Souza RT, Duarte SB, et al. Analysis of biological tissues in infant chest for the development of an equivalent radiographic phantom. Med Phys 2012; 39:1357–1360. [DOI] [PubMed] [Google Scholar]
- 22.Chu RYL, Fisher J, Archer BR, et al. AAPM Report No. 31: Standardized Methods for Measuring Diagnostic X-Ray Exposures. New York: American Association of Physicists in Medicine by the American Institute of Physics; 1990. [Google Scholar]
- 23.Pina DR, Duarte SB, Ghilardi Netto T, et al. Optimization of standard patient radiographic images for chest, skull and pelvis exams in conventional x-ray equipment. Phys Med Biol 2004; 49:N215–N226. [DOI] [PubMed] [Google Scholar]
- 24.Bland JM, Altman DG. Measuring agreement in method comparison studies. Stat Methods Med Res 1999; 8:135–160. [DOI] [PubMed] [Google Scholar]
- 25.Bushberg JT. The Essential Physics of Medical Imaging. 2nd ed.Philadelphia: Lippincott Williams & Wilkins; 2002. [Google Scholar]
- 26.van Ginneken B, Katsuragawa S, ter Haar Romeny BM, et al. Automatic detection of abnormalities in chest radiographs using local texture analysis. IEEE Trans Med Imaging 2002; 21:139–149. [DOI] [PubMed] [Google Scholar]
- 27.Vittitoe NF, Vargas-Voracek R, Floyd CE., Jr Markov random field modeling in posteroanterior chest radiograph segmentation. Med Phys 1999; 26:1670–1677. [DOI] [PubMed] [Google Scholar]
- 28.Maduskar P, Hogeweg L, de Jong PA, et al. Cavity contour segmentation in chest radiographs using supervised learning and dynamic programming. Med Phys 2014; 41:071912. [DOI] [PubMed] [Google Scholar]
- 29.van Ginneken B, Stegmann MB, Loog M. Segmentation of anatomical structures in chest radiographs using supervised methods: a comparative study on a public database. Med Image Anal 2006; 10:19–40. [DOI] [PubMed] [Google Scholar]
- 30.Song YS, Park CM, Park SJ, et al. Volume and mass doubling times of persistent pulmonary subsolid nodules detected in patients without known malignancy. Radiology 2014; 273:276–284. [DOI] [PubMed] [Google Scholar]
- 31.Lassen BC, Jacobs C, Kuhnigk JM, et al. Robust semi-automatic segmentation of pulmonary subsolid nodules in chest computed tomography scans. Phys Med Biol 2015; 60:1307–1323. [DOI] [PubMed] [Google Scholar]
- 32.Goldin JG. Quantitative CT of the lung. Radiol Clin North Am 2002; 40:145–162. [DOI] [PubMed] [Google Scholar]
- 33.Yoon H, Kim MJ, Yoon CS, et al. Radiation dose and image quality in pediatric chest CT: effects of iterative reconstruction in normal weight and overweight children. Pediatr Radiol 2015; 45:337–344. [DOI] [PubMed] [Google Scholar]
- 34.Silva AC, Lawder HJ, Hara A, et al. Innovations in CT dose reduction strategy: application of the adaptive statistical iterative reconstruction algorithm. AJR Am J Roentgenol 2010; 194:191–199. [DOI] [PubMed] [Google Scholar]
- 35.Chen B, Ramirez Giraldo JC, Solomon J, et al. Evaluating iterative reconstruction performance in computed tomography. Med Phys 2014; 41:121913. [DOI] [PubMed] [Google Scholar]
- 36.Ha S, Mueller K. Low dose CT image restoration using a database of image patches. Phys Med Biol 2015; 60:869–882. [DOI] [PubMed] [Google Scholar]
- 37.Rampinelli C, Origgi D, Vecchi V, et al. Ultra-low-dose CT with model-based iterative reconstruction (MBIR): detection of ground-glass nodules in an anthropomorphic phantom study. Radiol Med 2015. [DOI] [PubMed] [Google Scholar]


