

Abstract
Adaptive immunity is initiated in secondary lymphoid tissues when naive T cells recognize foreign antigen presented as MHC-bound peptide on the surface of dendritic cells. Only a small fraction of T cells in the naive repertoire will express T cell receptors specific for a given epitope, but antigen recognition triggers T cell activation and proliferation, thus greatly expanding antigen-specific clones. Expanded T cells can serve a helper function for B cell responses or traffic to sites of infection to secrete cytokines or kill infected cells. Over the past decade, two- photon microscopy of lymphoid tissues has shed important light on T cell development, antigen recognition, cell trafficking and effector functions. These data have enabled the development of sophisticated quantitative and computational models that, in turn, have been used to test hypotheses in silico that would otherwise be impossible or difficult to explore experimentally. Here, we review these models and their principal findings and highlight remaining questions where modeling approaches are poised to advance our understanding of complex immunological systems.
1. Introduction
Understanding and ultimately manipulating the human immune response is key to improving human health. In many cases, the first line of defense (innate immunity) is sufficient to control an infection. However, the development of long-lived adaptive immunity to common bacterial and viral pathogens is vital to human health. Although adaptive immune responses often confer protection through humoral mechanisms (antibody production), the generation of activated CD4+ and CD8+ T cells within secondary lymphoid tissues such as the lymph nodes (LNs) and spleen are central to fighting infections such as caused by Mycobacterium tuberculosis, HIV-1, streptococci spp. and influenzae. Until recently, LNs have been in large part considered a “black box” by those studying immune dynamics. In this review, we first discuss recent two-photon work that has allowed a ray of light into this “black box” and then focus on modeling studies that are being conducted in parallel to better understand the role of LNs in initiating and regulating immunity.
There are many challenges to modeling the generation of activated T cells in LNs. At a basic level, an attempt must be made to recapitulate the detailed structure of the LN and understand how the environment and cell-cell interactions influence cell behavior. From this framework, one can then begin to ask questions such as: how do cells locate each other to exchange information? What is the impact of infection on cell behavior? What is the relationship between LN input (circulating naive T cells and antigen-presenting cells) and LN output (activated T cells), and does that change over the course of infection and for different infections? In vitro or in vivo experimental approaches to these questions are time consuming, costly, and often not tractable with currently available techniques, and thus a systems biology approach is warranted (Bogle and Dunbar, 2010b; Kirschner et al., 2007). After first summarizing experimental studies on the LN and its function, we discuss how modeling approaches are being used to probe the fundamental cell dynamics that underlie immune responses.
2. Experimental studies on lymph node anatomy and cell dynamics
2.1. Structure and components of the T cell zone of the lymph node
LNs in humans and non-human primates vary in size from a few millimeters to a few centimeters. The LN paracortex or T cell zone is that region occupied by T cells and professional antigen-presenting cells (APCs), such as dendritic cells (DCs) (Fig. 1a). In the steady-state, circulating naive T cells enter the T cell zone of a LN via high endothelial venules (HEVs). Adhesion molecules such as L-selectin facilitate T cell rolling along the endothelial surface. Chemokines and integrins expressed by endothelial cells induce increased T cell adhesion, ultimately leading to firm arrest and transendothelial migration across the endothelium (extravasation) (Sage and Carman, 2009).
Figure 1.
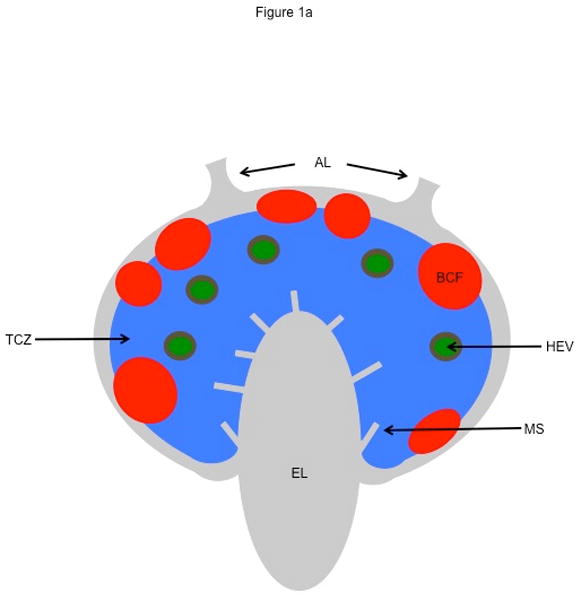
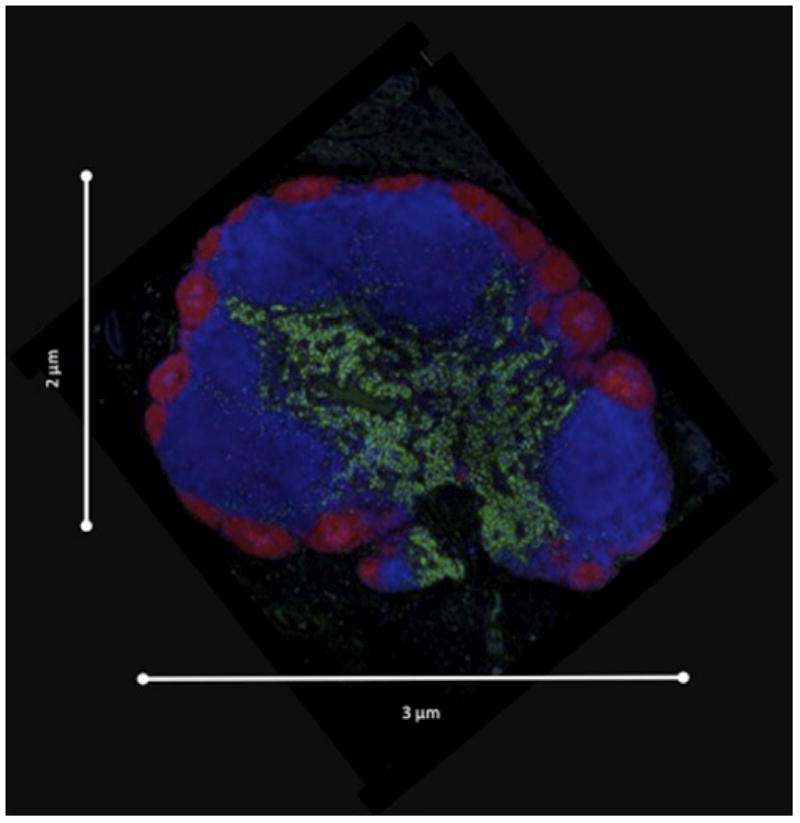
Lymph node structure. (a) Schematic of a lymph node showing afferent lymphatics (AL), high endothelial venules (HEV), medullary sinuses (MS), efferent lymphatics (EL), T cell zone (TCZ), and B cell follicles (BCF). Our focus is a TCZ where activation of T cells occurs. The LN is also the site of B cell activation. B cells are generally confined to the BCF and are not discussed here. (b) Fluorescent image of a Cynomologus macaque lymph node cross-section showing T cells (CD3+, blue), B cells (CD20+, red), and macrophages and dendritic cells (CD11+, green). Lymph node is approximately 3 mm × 2 mm. Image courtesy of JoAnne Flynn and Josh Mattila (Univ. of Pittsburgh).
T cells exist in large numbers within the T cell zone of a LN, on the order of 106 in a 2 mm diameter LN (Catron et al., 2004), consuming roughly 60% of the volume (Bogle and Dunbar, 2008). A feature of a LN-T cell zone is the dense fibroblastic reticular cell (FRC) network. The FRC network was originally thought solely to provide structural support, but it is clear that it also serves as a conduit through which low molecular weight antigens may enter a LN to be taken up by DCs for processing and display (Anderson and Shaw, 1993). More recently, T cells have been observed crawling along the surface of the FRC network, suggesting that it serves as a track for T cell movement (Bajenoff et al., 2006; Mueller and Germain, 2009). The extracellular and intracellular factors controlling T cell motility in the LN are complex and are the topic of a recent review (Worbs and Forster, 2009). As T cells migrate through LN parenchyma they eventually enter the medullary sinuses, which drain into the efferent lymphatic (EL) vessels, returning cells into the circulation. Resting T cells transit through LNs (transit time) in less than one day, on average, for humans and in less than 12 hours, on average, for mice and rats (Ford and Simmonds, 1972; Tomura et al., 2008; Westermann et al., 1988; Westermann et al., 1993). T cell egress from the LN is sphingosine-1-phosphate (S1P) dependent, and its receptor (S1P1) is down-regulated during T cell activation (Matloubian et al., 2004; Wei et al., 2005), leading to retention of activated T cells in LNs for a number of days.
In response to inflammation, conventional DCs acquire antigen from peripheral tissues and ferry them into LNs by trafficking through the lymphatics. When immature DCs take up (phagocytose) bacteria, they undergo a maturation process that reduces phagocytosis activity and induces processing and presentation of antigen on major histocompatibility complexes I and II (MHCI and MHCII) (von Adrian and Mempel, 2003; Randolph et al. 2005). During maturation, the expression of chemokine receptors on DCs, in particular CCR7, facilitate DC recruitment to nearby lymphatic vessels (Sallusto et al., 1998). Antigen-bearing DCs (Ag-DCs) enter LNs from afferent lymphatic (AL) vessels and migrate to T cell zones where they interact with T cells. In contrast to T cells, Ag-DCs are thought to be relatively short-lived so presumably once they enter the LN paracortex they will remain there until they die. DCs, while much less motile than T cells, are able to sample a large volume using their dendrites, which extend up to twice their body length (Miller et al., 2004a),
T cell zones of LNs serve as meeting grounds for DCs and T cells. The specificity of T cell receptors (TCRs) for peptide bound to MHC (peptide-MHC complexes, or pMHC) on an Ag-DC is highly diverse. Estimates for αβ TCR repertoire diversity range from greater than 2×10⁷ in humans (Arstila et al., 1999; Naylor et al., 2005) to approximately 2×10⁶ in mice (Casrouge et al., 2000). Therefore within the LN, only a small fraction of naive T cells will have TCRs capable of recognizing any given antigenic epitope (Blattman et al., 2002; Casrouge et al., 2000). DCs typically express tens to thousands of pMHC molecules on the surface; a minimum of approximately 200 to 350 pMHC molecules have been found to be necessary to elicit a T-cell response (Demotz et al., 1990; Harding and Unanue, 1990). The specific binding of the TCR to pMHC sets in motion an intracellular signaling cascade within a T cell that leads to activation and proliferation. After several rounds of proliferation, differentiated T cells begin to egress from a LN and enter the circulation via efferent lymphatics. In response to inflammation, circulating effector T cells are recruited to sites of infection where they can directly kill infected cells or secrete cytokines to augment cellular immune responses to clear a pathogen.
2.2. Measurement of cell motion and behavior in lymph nodes
LNs in mice, rats, sheep and humans have been studied for centuries with dissection and optical microscopy (e.g. Hall et al. 1976; Gowans 1959). These studies have provided a general sense of LN size, shape, weight, and sub-architecture. Stunning images that identify LN anatomical features and provide insight into the localization of components and their densities have more recently become available (Fig. 1b). Cell density information can be obtained through flow cytometry.
Since 2002, two-photon microscopy (2PM) has been used extensively for the quantitative analysis of cell motility and behavior in LNs. In a typical 2PM experiment, cells are labeled with fluorescent dyes or by the expression of a fluorescent protein. Fluorescence excitation is achieved when two near IR photons from a femtosecond pulsed Ti:Sapphire laser are absorbed by the fluorophore nearly instantaneously. The two photons together provide the same quantum of energy (equivalent to a single higher energy photon) to promote a pi orbital electron to an excited state. The electron loses energy by non-radiative processes and then returns to the ground state, emitting the remaining energy as photon, just as with single photon fluorescence excitation. However, unlike single photon excitation, 2P excitation requires very high photon densities and is therefore restricted to the point of focus in the sample. Because 2PM uses long wavelength near IR light, it can image several hundred microns deep into scattering tissues. Moreover, because excitation is confined to a small volume of the sample, less photodamage is induced, which translates into better tissue viability and more physiological cell behaviors (Wei et al., 2003; Miller 2010).
2PM of mouse LNs (Fig. 2) has revealed specific T cell motility patterns in the absence of infection (e.g. Miller et al., 2002; Wei et al., 2003). Visually, cells appear to move in straight lines, on average for several minutes at a time (short-term persistence), and to traverse a mean free path of ~ 20–30 μm. Longer-term T cell motion resembles diffusion, with a motility coefficient, analogous to a diffusion coefficient, of 50 – 100 μm2/min. Initially, instantaneous speed T cell was measured in 2D maximum intensity projections and gave values that ranged from 9.6–11.8 μm/min for CD4 T cells, though the distribution of speeds is long-tailed and some move as quickly as 25 μm/min (Miller et al. 2002; Miller et al., 2003; Miller et al. 2004b). These 2D speed measurements underestimate actual T cell speeds since motion in the z-plane is not measured. Moreover, reported values for T cell speed can vary considerably due to differences in experimentally approach, image acquisition rate and the tracking methods used. However, subsequent 3D measurements for CD4 and CD8 T cell speeds in vivo are roughly in agreement with the early 2D estimates giving values of ~9 um/min for CD4 T cells (Shakhar et al., 2005) and CD8 T cells (Mempel et al., 2004).
Figure 2.
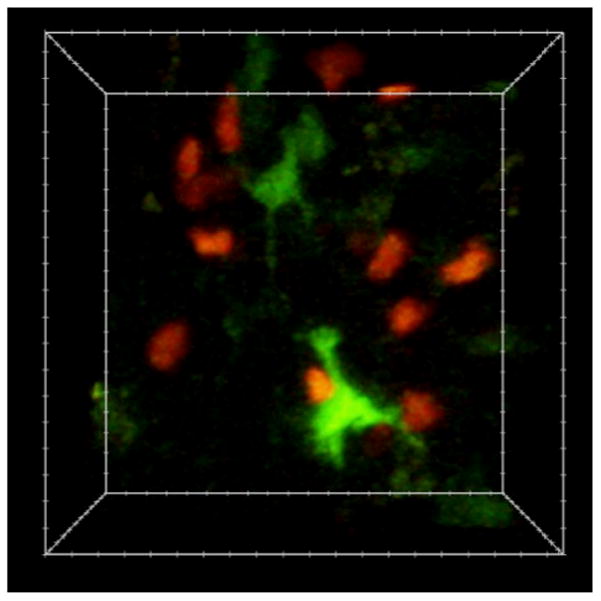
Single-cell imaging of T cell and DCs dynamics with two-photon microscopy. The image is an individual frame from a 3D time-lapse video recording of dye-labeled T cells (red) and DCs (green) in the mouse lymph node. The image volume is approximately 100×80×50μm.
Several 2PM imaging studies have examined T cell priming dynamics in LNs [Miller et al., 2002; Bousso and Robey, 2003; Miller et al., 2004b, Mempel et al., 2004, Shakhar et al., 2005]. In the absence of cognate antigen, naive CD4+ T cells display random motility and make multiple contacts with DCs within minutes (search time) as a consequence of robust T cell motility and a dynamic extension of DC dendrites into the surrounding space (repertoire scanning) (Miller et al., 2004a; Miller et al., 2004b). Various reports have estimated that DCs can contact between 500–5000 T cells/hr (scanning rate) and that initial contacts last about three minutes on average (contact time) (Bousso and Robey, 2003; Miller et al., 2004a). Similar to CD4+ T cells, CD8+ T cells were also found to migrate randomly preceding contact with DCs (Bousso and Robey, 2003, Mempel et al., 2004), while a more recent work reported that licensed DCs enhanced the recruitment of CD8+ T cells by chemotaxis (Castellino et al., 2006, Beuneu et al., 2006]. For both CD4+ T cells, the recognition of cognate antigen leads to stereotypical changes in both in cell motility and T cell- DC contact durations. Miller et al. (Miller et al., 2004b) suggested that CD4+ T cell priming behaviors could be grouped into five distinct stages. The initial contact of a T cell with a DC is represented by Stage I, which last for several minutes and is antigen independent. If cognate pMHC is not detected, the T cell will break contact with the DC and move away, allowing another T cell to interact with the DC. However, if antigen is detected, then a T cell enters the stage II, which is characterized by decreased T cell speed and increased turning behavior (stop signal). This change in motility facilitates multiple interactions with both the original stimulating DC as well as other DCs in the vicinity that are likely to be presenting cognate antigen. For CD4 T cells, stage II interactions occur typically on DC dendrites, last tens of minutes and frequently involve serial contacts with multiple DCs during (Miller et al., 2004b). At 2 hours after T cell transfer, many T cells will begin to enter stage III, characterized by stable contacts with DCs, in some cases persisting for greater than several hours producing T cell clusters on DCs. While clusters can be observed over the first 24h of priming, beginning ~18h cells after transfer, some cells will display an additional dynamic interaction stage, or stage IV behavior (Miller et al., 2004b). The percentage of T cells that find their cognate Ag-DC during their time in the LN is defined as the match percentage (Linderman et al., 2010). Stage IV is characterized by partial resumption of T cell motility and a decrease in the duration of T cell-DC contacts from >30 minutes to tens of minutes. After 24 hours, CD4+ T cell behavior is described as stage V. This stage is characterized by a resumption of motility and brief interactions with DCs (similar to naive T cells) that is interspersed with periods of cell arrest and cytokinesis. In contrast, the activation behavior of antigen-specific CD8+ T cells has been divided into 3 phases an early dynamic interaction phase, stable interaction phase and the resumption of motility [Bousso and Robey, 2003; Mempel et al., 2004]. These phases are similar to stages II, III and IV described for CD4 T cell priming dynamics, with the exception that a late dynamic DC interaction stage (stage IV) has not been well documented for CD8 T cells. As a caveat, the contact between T cells and DCs can take various forms depending on both the T cell type, activation state and the antigen presenting cell phenotype (Lin et al., 2005), so the choreography of T cell priming must be taken as a general description of potential behaviors during antigen recognition rather than an immutable sequence of events. For example, Bousso’s group showed that a large dose of soluble peptide could cause T cells to bypass the dynamic interaction phase and form sustained contacts directly with DCs (Celli et al., 2007). Moreover, while long-lived T cell contacts are typically associated with antigen recognition, dynamic serial interactions that last on the order of minutes have also been reported in other systems [Zinselmeyer et al., 2005; Shakhar et al., 2005]. Figure 3 provides an overview summary of current thought regarding activity in a LN T cell zone: it captures dynamics from recruitment and movement of T cells and DCs, influenced by the dense LN environment, the FRC network and the cytokine environment, through T cell dynamics during activation, proliferation, and egress.
Figure 3.

Principal dynamics leading to T cell priming by Ag-DCs in the T cell zone of a LN during an immune response. T cells enter through HEVs while DCs enter through ALs. Motile T cells exhibit short-term persistence but maintain a longer- term random walk as they scan DCs for cognate antigen, exhibiting characteristic free path lengths, speed distributions, and motility coefficients. This is supported by a LN environment that contains a dense FRC network and chemical signals. Once cognate antigen is located, T cells proceed through a multi-phase activation process, with Phase 1, transient interactions, and Phase 2, more prolonged interactions that include T cell clusters and swarms, defined based on 2PM data (Miller et al. 2004b; Mempel et al. 2004), (see above section 2.2 for greater details on phases). Ultimately, successful interactions lead to T cell activation, proliferation and egress to site of infection.
While 2PM studies have uncovered important features of cell motion and interactions in LNs, they do so only over short distances (a few hundred microns) and short times (minutes to a few hours); in other words, T cells travel greater distances and remain in a LN longer than can documented by 2PM. In addition, adoptive transfer approaches result in super-physiological precursor frequencies for antigen-specific T cells, e.g., an increase in frequency from 10−5 or 10−6 to 3×10⁻² (Bousso and Robey, 2003; Celli et al., 2008; Mempel et al., 2004; Miller et al., 2002; Miller et al., 2004a; Miller et al., 2004b). Computational biology approaches can complement and extend experimental results, for example by determining how local (observed) motility is translated into global long range trafficking behavior through the entire LN, or how the output of effector T cells from a LN scales with precursor frequency. Such approaches can often test competing mechanistic explanations for observed phenomena or suggest novel hypotheses, as we discuss in the sections below.
Early 2PM studies examined T cell and DC dynamics following immunization with model protein antigens (non-pathogenic and non-replicating) such as ovalbumin in adjuvants or in response to transferred peptide-pulsed DCs. However, during an actual infection, the pathogen-induced inflammatory response, as well as the amount and distribution of foreign antigen, will profoundly impact the T cell response elicited. Moreover, pathogens have evolved an arsenal of counter measures and immune evasion strategies to modulate a host immune response. As the ultimate goal is to understand immune dynamics during infection, the use of a model antigens might preclude some insights. Recently, 2PM has been used to examine host-pathogen interaction dynamics and study T cell responses during infection (Konjufca and Miller, 2009). Listeria monocytogenes (Lm) is an intracellular bacterial pathogen widely used to study innate and adaptive immune responses to infection in mice. Several groups are using Lm as a model pathogen in their 2PM studies (Aoshi et al., 2008; Sathaliyawala et al., 2010; Waite et al., 2011). Aoshi et al. showed that splenic DCs transport live Lm from the marginal zone, where it is initially captured, to the periarteriolar lymphoid sheath (PALS) to initiate antigen presentation to T cells. Preventing the entry of Lm into the PALS by pre- treating mice with pertussis toxin inhibited both the progression of Lm infection and antigen presentation to CD8+ T cells. This finding suggests that DC trafficking from the marginal zone to the PALS serves an analogous antigen transport function to the migration of DCs from inflamed peripheral tissues to draining LNs. Waite et al. focused on the effector responses that serve to capture and kill Lm in the red pulp of the spleen. There is also great interest in understanding the pathogenesis of Mycobacterium tuberculosis (M. tuberculosis) infection and 2PM studies have generated beautiful images during granuloma formation; however BCG (a non- pathogenic cousin of M. tuberculosis) was used in this work and imaging was performed on the livers of mice (Egen et al., 2008). Thus, it is unclear how well results from this experimental system reflect infection with pathogenic M. tuberculosis in human lungs. Bacterial pathogenesis and outcomes are highly dependent on the host organism, the species of bacteria and the tissue that is infected (Engelmayer et al., 1999; McFadden and Murphy, 2000; Tortorella et al., 2000). For example, M. tuberculosis may interfere with processing and presentation of antigen by DCs (Harding et al., 2003; Hmama et al., 1998; Mazzaccaro et al., 1996; Moreno et al., 1988; Noss et al., 2000) and Shigella and Salmonella sp. can activate DC apoptosis via caspase 1 (Yrlid and Wick, 2000; Yrlid et al., 2001). In theoretical models, the effects of pathogens on particular pathways or mechanisms, e.g. on recruitment, maturation or survival of DCs, and the implications for immunity can be explored and perhaps bridge the gap between model systems and human infections (Chang et al., 2005; Linderman et al., 2010).
3. Types of models
Many early models of LNs were built as systems of differential equations and were used to describe flux through a LN and changes in constituent concentrations of cells over time (e.g., Bajaria et al. (2002) and Marino et al. (2004)). These deterministic models are fairly easy to build, both conceptually and practically, and one can obtain a numerical solution quickly. These advantages continue to make them an occasional modeling choice (Marino et al., 2010b). However, they fail to capture stochastic and discrete behaviors inherent in cell dynamics and less flexibly describe spatial variation. More importantly, these models tend to be phenomenological rather than mechanistic, making them less appealing for studies aimed at elucidating biological mechanisms.
2PM data show individual T cells and DCs crawling in LNs and, when they contact each other, interacting. It is thus typically assumed that interactions between T and DC cells are transport-limited (e.g., Preston et al. (2006)) or at least partially transport-controlled (e.g., Linderman et al. (2010) and Riggs et al. (2008)). If the process is transport-limited, activation of cognate T cells by DCs is governed by how long it takes two cells to find each other. If partially transport-controlled, activation depends not only on the duration for cells to find each other but also on the details of the interactions. With either assumption, modeling T cell activation in LNs requires a reasonable representation of the dynamics of cell motion.
Monte Carlo and agent-based models (ABMs, also known as individual based models, or IBMs) have recently become preferred for representing cell motion and cell interactions within LN T cell zones because events can be made stochastic quite naturally and because sophisticated rules can be established to govern behavior of individual agents (cells) and their associations (Bauer et al., 2009). Though there is no requirement that these simulations be spatially discrete (i.e., built on a 2- dimensional (2-D) or 3-D lattice), the norm is to do so to restrict possible locations of agents, making computation more tractable. Agents (e.g., T cells or DCs) are positioned within a lattice according to their known distributions and densities. The size of a lattice compartment and time it takes for an agent to move from one micro- compartment to another are scaled to conform to known biology. Probabilities are established for motion in each allowed direction. Additional features, like ALs, ELs, HEVs, and the FRC network can be added to the lattice to allow for influx and efflux of cell components and stromal structure. To capture dynamics of an immune response, rules are established based on known interactions of T cells and DCs, including conditions leading to T cell activation, duration of the activation period, and rate of T cell proliferation.
Cellular Potts models (CPM), which can be considered specialized types of ABMs, have also been employed to describe T cell motility in LNs. Individual agents (e.g. T cells) are depicted as collections of contiguous lattice compartments and agents evolve according to a Hamiltonian that determines the probability of lattice-site updates (Glazier and Graner, 1993; Graner and Glazier, 1992). In this way, shapes of individual cells are allowed to change with time, giving a more realistic representation of motion. Additionally, CPMs allow for incorporation of cell-cell interactions (e.g., adhesion), although due to computational demands the number of cells that can be simulated at such high resolution is typically limited to a few cells, as compared to thousands for an ABM.
4. Building a lymph node model in stages
One can think of building a LN model in stages, first describing individual cell motion, then incorporating cell-cell interactions that lead to T cell activation, and finally capturing the dynamics of an entire LN T zone by including influx and efflux of cells and proliferation occurring over the time course of an infection (Fig. 3). The modeling community has met some of these challenges individually and some in combination as first steps toward building a complete LN representation (Table 1).
Table 1.
Summary of Lymph Node Models
| Authors | Model Type | Model Dimension |
Lattice Size | Compartment Size (μm/edge) |
T Cells/ Compartment |
Estimated % of Volume Filled by T Cells |
FRC Present? | Chemotaxis Incorporated? |
T Cell Motility Compared to 2PM? |
T Cell/DC Interaction? |
LN Input/ Output during Infection? |
|---|---|---|---|---|---|---|---|---|---|---|---|
| Preston et al. (2006) | PDE/ Monte Carlo | 3D | N/A | N/A | N/A | N/A | No | No | Yes | Yes | No |
| Beauchemin et al. (2007) | Random Walk Model | 3D | N/A | N/A | N/A | N/A | No | No | Yes | No | No |
| Meyer-Hermann & Maini (2005) | CPM | 2D | N/A | 0.4 | 1/241 | N/A | No | No | Yes | No | No |
| Grigorova et al. (2010) | Markov Model | 3D | N/A | N/A | N/A | N/A | No | No | Yes | No | No |
| Beltman et al/ (2007a) | CPM | 3D | 100 × 100 × 100 | 1 | 1/150 (At Full Size) | 53% | Yes (17% of Volume) | No | Yes | Yes | No |
| Beltman et al. (2007b) | CPM | 3D | 100 × 100 × 100 | 1 | 1/150 (At Full Size) | 45% | Yes (17% of Volume) | No | Yes | Yes | No |
| Bogle & Dunbar (2008) | ABM | 3D | 100 × 100 × 100 | 6.6 | Usually 1 | 60% | No | No | Yes | No | No |
| Bogle & Dunbar (2010) | ABM | 3D | Variable | 6.6 | Usually 1 | ??? | No | No | Yes | Yes | Yes |
| Riggs et al. (2007) | ABM | 2D | 100 × 100 | 5 | At Most 1 | 11% | No | Yes | Yes | Yes | No |
| Linderman et al. (2010) | ABM | 2D | 25 × 200 | 20 | At Most 4 | 9% | No | No | Yes | Yes | Yes |
| Baldazzi et al. (2009) | ABM | 3D | Not Specified | Mean displacement of CD4+ T Cell in 30 Min | Many | Not Specified | No | Yes | No | Yes | Yes |
| Zheng et al. (2008) | ABM | 3D | 30 × 30 × 30 | 10 | At Most 1 | At most 7.5%s | No | No | Yes | Yes | No |
4.1. T cell motility in lymph nodes
Several models of T cell motion in the LN have been developed and are successful at reproducing key features of 2PM data (Table 1). The first model was a CPM formulated by Meyer-Hermann and Maini (2005). During each time step, subunits that comprise a single cell are allowed to change location on a lattice while maintaining contiguity, but overall cell volume is held constant. Thus, there is a correlation between movement and deformation. Their model predicts that movement can be described as a random walk; however, over 2 minute horizons, persistence of orientation is maintained. Beauchemin et al. (2007) simulate T cell motility as a random walk expressible via three parameters that describe an inherent motility program: the duration a T cell travels along a free path (short-term persistence), the speed of a T cell along that path, and a pause time after which the cell chooses a new random orientation. Several 2PM data sets were used to fit parameters, and a mean free path of 38 μm is predicted, about twice the mean FRC network branch length (Bajenoff et al. 2006). Assuming T cells do in fact migrate on the network, they would therefore change branches ~50% of the time when arriving at an intersection.
In contrast to the inherent motility program assumed by Beauchemin et al. (2007), Beltman et al. (2007b) employ a 3-D CPM incorporating realistic cell densities to suggest that observed T cell motility could arise solely from a dense LN environment. T cells are given a preferred direction of motion and allowed to move only into empty compartments (not containing other T cells or FRC). The lattice contains an FRC network composed of rods, and the modeler can choose the extent to which the T cells adhere to the FRC network. The authors find that T cells move persistently for small amounts of time and randomly over larger amounts of time, with the latter caused both by the random changes in T cell direction and an environment that keeps the T cells from moving in straight lines. These results are obtained whether or not T cells are allowed to adhere preferentially to the FRC network. While this finding does not speak definitively to the degree of involvement of the FRC network in the coordination of T cell motion in vivo, it does indicate that reasonable agreement with 2PM data can be achieved without it. Moreover, the model predicted the existence of dynamic T cell streams (an emergent phenomena), which were subsequently confirmed by experiment (Beltman et al., 2007b). T cell streams were indicated by the correlation between the angles of cell displacement and the cell distances in space and time. The average angle between T cell displacement vectors for cells that were within 6 microns of each other was significantly different from cells that were farther away. T cell streams persisted for several minutes before dissipating and can be thought of T cell “drafting” behavior (e.g., bicycle or car racing) such that nearby cells moving in the same direction tend to follow the path of least resistance, until a collision or obstacle induces a change in their direction. It is worth noting that the existence of short-lived and localized T cell streams is inconsistent with a popular notion of T cell trafficking where cells move exclusively along the LN FRC network (Bajenoff et al., 2006), since if this were true, then sustained and well defined T cell paths should be evident in the in vivo data.
T cell motion has also been successfully described using ABMs. The 2-D simulations of Riggs et al. (2008) use realistic cell densities, lattice compartments that hold at most one T cell, and motion only into empty compartments. Purely random motion was found to be inconsistent with 2PM data; the addition of short-term persistence was necessary. 3-D ABM simulations of T cell motion in Bogle and Dunbar (2008) also include short-term persistence with a biased random walk but use a somewhat different approach for filling their lattice and allowing T cell movement. Their model is capable of handling biologically realistic numbers of T cells (up to 1,000,000) at realistic densities. When a compartment contains a T cell, ~60% of the volume of the compartment is occupied by the cell. Since the authors initiate their model with all compartments filled, ~60% of the volume of the T cell zone of a LN is consumed by T cells – roughly in accord with known experimental data. Since all compartments are filled at the initiation of a simulation, no movement would occur if T cells were not permitted to double up in compartments. The authors allow this to occur with some small probability such that, at most, ~17% of the compartments are doubly occupied, temporarily. Two additional parameters are employed and fit to experimental data: one (ρ) establishes the probability that motion will continue in the direction taken at the previous time step (short-term persistence), and a second (β) establishes the probability that a T cell will move.
Thus T cell motility described by several different model formulations can produce reasonable agreement with 2PM data. 2PM data also show movement of DCs, but these larger cells move much more slowly than T cells (Miller et al., 2004a) and thus their motion is less important in determining the rate at which T cells and DCs find each other. In ABM models, DC motion is typically captured by a simple random walk with a speed much less than seen for T cells (Linderman et al., 2010; Riggs et al., 2008) or they are immobile (Zheng et al., 2008).
The current understanding of lymphocyte recirculation from LNs into lymphatics under non-inflammatory conditions is that naive lymphocytes encounter their exit sites (medullary sinuses) within LNs while moving through a LN, driven by a stromally guided random walk (Grigorova et al., 2009; Pham et al., 2008; Sinha et al., 2009). Upon encounter they either turn back into parenchyma or transmigrate into the sinuses, where they can become captured by flow and carried into the efferent lymphatics (Grigorova et al., 2009; Grigorova et al., 2010). To study whether this scenario is consistent with the measured residence time of T cells in inguinal LNs, Grigorova et al. (2010) also developed a quantitative model of T cell recirculation through murine LNs. T cell residence time in the LNs was then calculated using two different approaches to model T-cell motility within the LN: (1) their own approach (see below, the conditional probability model) and (2) a simple model previously developed by Beauchemin et al. (2007) (discussed above). Both models of lymphocyte egress predict that ≈30% of T cells arriving in inguinal LNs through HEVs encounter the exit structures within the first 30 min, and by 2 h half of them encounter the sinuses at least once. Their results suggest that the overall correlated random walk characteristics describing T cell motility may be sufficient to explain T- cell movement along the sinus border, and no additional mechanism for T-cell retention at the sinuses has to be present. The conditional probability model of Grigorova et al. (2010) is based on cells retaining memory of a previous trajectory and thus it better approximates a random walk.
4.2. T cells finding and interacting with DCs in lymph nodes
Before a cognate T cell can be activated, it must contact an Ag-DC. Several models have been developed that predict the key metrics identified by 2PM (and defined earlier) to characterize T cell-DC interactions, e.g. search time, scanning rate and contact time.
Beltman et al. (2007b) evaluate interactions between T cells and non-antigen- bearing DCs using a CPM and find contact times of up to ten minutes but averaging one to two minutes, compared to three minutes observed in vivo (Bousso and Robey, 2003; Miller et al., 2004a). Each DC scans ~3000 total (and 2000 unique) T cells/hour, compared to 500–5000 T cells/hour estimated from experiments (Bousso and Robey, 2003; Miller et al., 2004a). Moreover, each DC is in contact with ~75 T cells at any instant, compared to 250 from experiments (Miller et al., 2004a). From these simulation data the authors estimate that, with 95% probability, a set of 100 Ag-DCs in their system volume of 1 × 106 μm3 would find a cognate T cell within two hours if the fraction of cognates in the T cell population is 10−5. In Beltman et al. (2007a) the authors extend their CPM to include the cognate interactions between Ag-DCs and T cells. T cells are provided with a strong preference to adhere to the FRC network. Here the authors create virtual DCs that differ significantly in character from T cells: successive actin bundles push against the cell membranes in directions that are randomly chosen, giving rise to multiple dendrites which subsequently retract. DCs themselves have no preferential direction of motion and are mostly fixed in space. Simulations suggest that movement from repertoire scanning to Phase 1 DC-T cell interactions requires a specific stop signal but not strong Ag-DC/cognate T cell adhesion while transition to Phase 2 DC-T cell interactions require both (c.f., Figure 3). The model is also able to predict an average total contact time between T cells and DCs, which is not presently determinable by direct observation via 2PM because the imaging experiments are limited to a 30–60 minute observation window. Analysis of the simulation data in Beltman et al. (2007a) leads to the conclusion that the average contact time is ~1.5 hours. However, while some biophysical data (e.g., calcium response (Agrawal and Linderman (1995)) support the notion that T cell activation is quickly initiated, other data suggest an extended period (>10 hours) of T cell/DC association (Miller et al., 2004b). A recent mathematical interpretation of the available 2PM data (Beltman et al., 2009) concludes that the period of T cell/DC association lasts ~3 hours. Clearly more study is required.
Some studies suggest that DCs secrete chemokines to lure T cells to them, although that work was done with CD8+ T cells (Castellino et al., 2006). Riggs et al. (2008) use an ABM that accurately captures T cell motility to help determine the impact of chemotactic attraction of T cells to DCs on repertoire scanning. To accommodate the long dendrites of DCs, which can contact T cells at some distance from the body of the DC, simulations allow contact to occur even when cells are separated by 1–2 neighboring micro-compartments (Moore neighborhood; Weisstein 2011). A T cell moves randomly with short-term persistence until it encounters a chemokine gradient around a DC, at which point probabilities are chosen so that a T cells is more likely to move toward the DC. Chemokine gradients were captured in a simple way, by assigning concentrations in the Moore neighborhood up to ~ 20 um from the DC surrounding a DC. Chemotaxis parameters include strength (related to the likelihood of moving toward the DC), duration (time before desensitization occurs; DeFea 2007) and recovery (time before a T cell can again detect a chemokine gradient). Without chemotaxis, search times averaged ~30 min and scanning rates were ~ 2000 T cells per hour, both within experimental ranges. As strength and duration increased, the total number of T cell-DC contacts increased but the number of unique T cell-DC contacts decreased, suggesting that an increased competition of T cells for DCs that results from chemotactic-driven movement of T cells toward DCs interferes with efficient repertoire scanning. They conclude that a better strategy for efficient scanning is to briefly contact and then clear non-cognate T cells away from an Ag-DC to make room for different, potentially cognate T cells, to scan.
Zheng et al. (2008) use a 3-D ABM to explore the nature of the transition in cognate T cells from high-motility phase 1 behavior to low-motility phase 2 behavior (c.f., Figure 3). T cells that move to compartments abutting a DC are held immobile for three time steps (3 min) while being scanned by the DC. The authors explore two scenarios of cognate T cell – cognate DC interaction leading to a stop signal and subsequent T cell activation: one in which a T cell requires sufficient antigen display (i.e., pMHC concentration) on a single DC, and one in which T cells can integrate pMHC levels from multiple DCs. While both scenarios produced activated T cells, it was found that T cell activation is elevated in those in silico environments where signal integration from multiple cognate DCs is permitted, an important conclusion that requires more elaboration and mechanistic detail. The authors find, additionally, that the initial concentration of pMHC and its TCR binding characteristics, the pMHC degradation rate, and the number of DCs presenting antigen determine the average time required to transition from phase 1 to 2.
In the models described in this review, molecular details of APC-T cell interactions are not included. Instead, simple descriptions such as a sigmoidal relationship between pMHC concentration and T cell binding or activation are used (Linderman et al., 2010). We note that there are several models exploring the molecular details of APC-T cell interactions, including formation of the immune synapse (e.g., Coombs et al. (2002), Gonzalez et al. (2005), Meier-Schellersheim et al. (2006), Figge and Meyer-Hermann (2009) and Wylie et al. (2007)) although as yet these details have not been integrated into the larger scale models for T cell and DC motion described above.
4.3. Toward a model of overall lymph node function
The models described above aim to mechanistically reproduce features of cell motility and T cell/DC interactions, often in an attempt to match 2PM data. But of course we are interested in the behavior of immune cells within a whole LN: what is the relationship between cellular input (numbers of DCs, pMHC concentration on DCs, numbers of cognate and non-cognate T cells, etc.) and output (activated CD4+ or CD8+ T cells), and how does it depend on a pathogen in question? Although no current model captures all the necessary biology, several recent ones are making strides in that direction.
First, in order to accurately capture the time it might take a T cell to traverse a LN and to calculate the probability that a cognate T cell finds its Ag-DC match during that time, it is necessary to have an accurate model of LN anatomy – the size of a T cell zone as well as the locations of cellular entrances (HEVs and ALs) and exits. Riggs et al. (2008) used their ABM model to explore the impact of variation in HEV- to-EL distance and the effect of variation in EL number on search and transit times. Mice images suggest an average HEV-to-EL distance of 325 um, although there is likely wide variation in this distance (see Fig. 1) (Riggs et al. 2008). Riggs et al. (2008) also used a model and found that increases in HEV-to-EL distance increased transit times while increases in the number of EL lowered transit times. In mouse LNs, ALs are oriented in such a way that as T cells enter they flow past DCs near the HEVs on their way toward the ELs and MS; currently there are no data available for primates on this orientation. Thus, the authors hypothesize that this arrangement is optimal for maximization of DC-T cell contacts and subsequent T cell activation and proliferation. To test this hypothesis using a computer model, the positions of the ALs and HEVs on the grid was “flipped” while maintaining AL-to-HEV and HEV-to-EL distances. This arrangement leads to a substantial increase in search times and significant reductions in DC-T cell contacts and activated T cell output while maintaining transit time and efflux rates for non-cognate T cells, validating their hypothesis. These simulations suggest that the configuration of the LN T zone is optimal in terms of simultaneously accommodating short search times, large scanning rates, and reasonable transit times.
LNs may become larger during infection (lymphadenopathy), due to a reduced ability of T cells to exit the LN, an increase in flow of T cells to the LN, and the proliferation of T cells within (Cahill et al., 1976; Catron et al., 2004; Chyou et al., 2008; Hay and Hobbs, 1977; Jain, 2003; Lo et al., 2005; Smith and Ford, 1983; Soderberg et al., 2005; Steeber et al., 1987; Webster et al., 2006; Westermann et al., 1988). This may be an important phenomenon that has implications for T cell-DC interactions and has been initially addressed by Bogle and Dunbar (2010a). Here they allow their 3-D simulation to change size (i.e., grow) during an immune response by incrementing the size of their grid by one empty-edge compartment each time a T cell enters through an HEV or divides and decrementing the grid by one empty edge compartment each time a T cell exits or dies (and also decrementing the grid by seven empty edge compartments each time a DC dies), although they do not study in detail how this expanding LN affects output.
Both Bogle and Dunbar (2010a) and Linderman et al. (2010) model infection in the LN by incorporating T cell influx though HEVs and efflux through ELs. DCs are able to interact with T cells arriving in a neighborhood close to the DC. Both models assume that interactions between non-cognates last only a few minutes, but cognates T cells can bind DCs for hours (Fig. 3). Activation of T cells is modeled as a function of pMHC density on the Ag-DC, which decays exponentially with time to account for peptide degradation. Linderman et al. (2010) looked at the dynamics of both acute and chronic infection scenarios. In order to simulate acute infection, the time course of total DC numbers was estimated from a human experimental study, and the influx rate of cells flowing into their model LN was calibrated accordingly. This approach produces a spike in mature DCs that peaks ~1 day after the start of infection and a secondary spike in licensed DCs (mature DCs that have interacted with activated CD4+ T cells) that peaks ~3 days after infection. Cumulatively, activated CD4+ T cell output levels off at ~5 days after infection with less than a 3 order-of-magnitude expansion, while cumulative activated CD8+ T cell output levels off at ~6 days post-infection with more than a 3 order-of-magnitude expansion, both roughly recapitulating (scant) experimental data (see Linderman et al., 2010). A comparative computational study of a virtual chronic infection scenario, in which total DC numbers reach a steady state value after ~1 day past infection, produced similar results – though total cumulative activated CD4+ and CD8+ T cell output continue to rise with time.
Unlike the model studies described earlier that compare easily to 2PM data, few data are available to indicate what are reasonable cellular inputs and outputs to LNs (number of cells as a function of time) or pMHC concentrations on entering Ag-DCs (Linderman et al., 2010). In addition, values of many fundamental parameters and probabilities used in these ABMs are largely not measurable. Thus techniques to perform parameter uncertainty and sensitivity analyses are particularly helpful and have been used in many ABMs (Marino et al., 2008; Fallahi-Sichani et al., 2011), including ABMs of the LN. Both Bogle and Dunbar (2010a) and Linderman et al. (2010) find that the simulated response (production of activated T cells leaving the LN) is roughly proportional to the cognate frequency. Experimental preparations such as 2PM often increase the density of cognate CD4+ T cells (and DCs) beyond physiological range to facilitate observation (Bousso and Robey, 2003; Celli et al., 2008; Mempel et al., 2004; Miller et al., 2002; Miller et al., 2004a; Miller et al., 2004b), so understanding the relationship between activated T cell production within LNs and cognate frequency using a theoretical model will indicate how information from these studies can be interpreted. Linderman et al. (2010) further calculate what might be termed a LN efficiency, the ratio of activated CD4+ T cells leaving the LN to the number of cognate CD4+ T cells entering the LN, and find it to be approximately 2–4, providing a potentially useful rule of thumb for simpler calculations. Responses are not proportional to Ag-DC frequency; at higher frequencies saturation is seen. They also find that high numbers of mature DCs can compensate (or trade-off) for low initial levels of pMHC on each mature DC, and vice-versa. These features of the response have implications for responding to an infection, e.g., what is the optimal number of Ag-DCs to be generated and trafficked to the LN, and what should the distribution of the number of pMHC on those Ag-DCs be?
Further enlarging the scope of LN biology included in an ABM, Baldazzi et al. (2009) produced a 3-D ABM of the entire LN (not just the T cell zone) that incorporates CD4+ T cells, B cells and DCs as agents. In addition, the secretion and diffusion of four chemokines with time are tracked deterministically. In the presence of antigen, CD4+ T cells and B cell influx rates rise proportionally. Each cell type has receptors for antigen and chemokine, and DCs and B cells also have MHCII receptors for antigen presentation. Receptors and ligands are represented as binary strings and binding is based on early works by Celada and Seiden (1992). Baldazzi et al. (2009) do not attempt to produce realistic-looking T cell motility in agreement with 2PM data but rather a representative immune response and a platform to do in silico experiments to assess LN output. The authors use their model to study and manipulate the timing of the immune response, e.g. by removal of DCs at various points in the immune response or by down-regulation of the S1P receptor.
We are aware of no models of T cell activation in the LN that address a particular pathogen directly. However, Linderman et al. (2010) have used their ABM together with sensitivity analyses to identify parameters that most significantly control the generation, proliferation and egress of activated CD4+ T cells. They predict that these processes are most affected by half-life of pMHC on the Ag-DC surface and thresholds that describe binding, priming, and release of T cells by DCs. Do pathogens target these processes, alone or in combination, to improve their success? Given vast data on the effects of both bacteria and viruses on DC recruitment, maturation and survival as well as DC-T cell interactions (McFadden and Murphy, 2000; Tortorella et al., 2000; Yrlid and Wick, 2000; Yrlid et al., 2001), it is likely that pathogens have evolved strategies to specifically target these highly sensitive processes.
5. Open Questions
Existing computational models of dynamics of immune cells interacting within LNs have successfully mimicked many aspects of T cell motility, DC-T cell interactions, and the generation of adaptive immunity. These models have helped to address controversies (e.g. whether T cells use chemotaxis to locate DCs) and have even identified previously unrecognized behaviors (e.g., T cell streaming). Nevertheless, many open questions regarding within LN dynamics remain. Even our understanding of T cell anatomy is still evolving. For example, only recently was the proximal relationship between HEVs and sinuses (leading to T cell egress from the LN) clarified, at least for mice (Grigorova et al., 2009; Grigorova et al., 2010); it is now known that they can be extremely close to one another, that many newly arrived T cells leave via these sinuses in as little as 20 minutes, and that many T cells make multiple round trips between the sinuses and the T cell zone (Grigorova et al., 2009; Grigorova et al., 2010). Similarly, imaging of the LN has just now advanced to the point where trustworthy T cell density numbers can be established (see Fig. 1b). In light of these newer data, which suggest that T cell volume densities in the T cell zone are ~60%, it may be that some models (Table 1) have used T cell densities that are too low. These new data will need expression in next-generation models.
The work of Beltman et al. used a CPM of the T cell zone of the LN, and showed that T cell movement exclusively along the FRC network is not necessary to produce realistic T cell motility (Beltman et al., 2007b). In addition, other models have validated many of the cell motility and cell-cell interactions without the FRC present. Obvious questions remain. What is the actual preference of T cells for the FRC network and does it vary with time? Is the preference lower during infection, when the LN swells and the number of T cells rises dramatically? If so, what role, if any, does this serve in the immune response? Formulating models to specifically address these questions may play an important role here in elucidating biological mechanisms.
One can imagine that the distribution of T cells, or T cell density, in the T cell zone of a LN is not uniform. If this is the case, then it is likely that these spatial variations would manifest as local differences in T cell motility and that productive DC-T cell encounters could be affected by their location. Analysis in vivo would be difficult, but modeling can offer an opportunity for exploration. Indeed, it is likely that at least some of the existing models display non-uniform T cell density gradients, but none have shown or discussed this emergent behavior. However, as described above, Riggs et al. (2008) have shown that reversal of AL and HEV position substantially increases T cell search times, lowers scanning rates and decreases production of activated T cells. Could it be that these observed rate changes are the result of a dramatic alteration in T cell density at the site of maximal DC concentration?
While Zheng et al. (2008) have shown that integration of signals from multiple DCs leads to more efficient CD8+ T cell activation than from a single DC, the mechanism by which this might be accomplished remains unclear. Further, whether these results translate to CD4+ T cells remain unknown. Can modeling help to suggest how signaling pathways might allow signals from individual DCs to be summed by scanning cognate T cells?
The cytokine environment of the T cell zone surely affects LN output of activated cells. For example, CCL19 and CCL21 levels play a role in T cell motility (Okada and Cyster, 2007; Worbs et al., 2007). Yet, the role of the cytokine environment in LN models has not been studied in any detail. Of particular interest is the role that chemotaxis might play in the movement of T cells toward DCs. Though it was demonstrated through modeling that chemotactic attraction of CD4+ T cells by DCs actually lowers output of activated T cells (Riggs et al., 2008), further study is required. For example, experiments have shown that CD8+ T cells move toward activated CD4+ T cell-DC complexes (Castellino et al., 2006). Whether an attraction is necessary for cells, or for which types, is not definitive, and models developed to specifically address these issues can lend important insights. Obviously, the development of any model requires a tradeoff between an attempt to capture reality and computational efficiency. The tendency not to build cytokine diffusion into LN models likely arises in part from the realization that doing so would greatly increase simulation time, although not to an untenable level (Baldazzi et al., 2009; Fallahi-Sichani et al., 2011; Zheng et al., 2008). This is clearly a larger problem when the model is three, rather than two, dimensional or when performing numerous simulations needed for sensitivity analyses. Several models (Linderman et al., 2010; Riggs et al., 2008) have been devised in 2-D for this reason. Nonetheless, it is not altogether clear how well conclusions drawn in 2-D relate to 3-D, and further study here is also required.
In immunocompetent individuals, all infectious diseases (and some non-infectious ones) engage LNs as the site of generation of adaptive immunity. While sharing some similar characteristics, many diseases elicit unique responses both in LN and also at the site of infection, where the host-pathogen interaction occurs. The manifestations specific to each pathogen invasion must be studied individually, in the same way that pathogens are studied individually in a wet-lab setting. Thus once developed, it is likely that the general immune response models of a LN described above must be tailored to study unique infection scenarios. The creation of computer models to address particular diseases will be a challenging task and will require the incorporation of additional agents (e.g., macrophages, B cells, etc) ) and cytokine and chemokine diffusion. Further, a number of diseases, including cancer and HIV-1, can also induce infection within LNs, either by disrupting the LN environment or immune cells (or both). In other diseases such as tuberculosis, cat scratch disease, and sarcoidosis, granulomas can develop in LNs as a result of pathogen presence there (Diedrich et al., 2010). In cases where specific infections are explored, treatment and vaccine strategies can also be studied using models (e.g. Fallahi-Sichani et al., 2010).
To understand whether or not interventions are successful, one may need a multi- compartment model (such as lung and LN) to test whether the immune response generated in LNs is sufficient to combat the localized infection (Marino et al., 2004; Marino et al., 2010b). Finally, to explore, for example, potential gene therapies or immunotherapies, one may need a multi-scale model that accounts for events occurring at multiple scales of the immune system (genetic, molecular, cellular, tissue) to allow a more comprehensive study capturing events occurring over biological levels (Fallahi-Sichani et al., 2011; Kirschner et al., 2007; Kirschner, 2007; Kirschner and Linderman, 2009; Marino et al., 2010a; Young et al., 2008). It is clear theoretical approaches can assist experimentation in understanding immune responses, but the collaboration between scientists will likely lead to the most realistic models and greater chance of success.
Acknowledgments
This work was supported by National Institute of Health (NIH) grants R33HL092844, R33HL092853, R01 HL106804. We thank Josh Mattila and JoAnne Flynn for helpful discussions and the data in Figure 1b. We thank anonymous reviewers for their helpful comments.
Contributor Information
Henry Philip Mirsky, Email: mirsky@umich.edu.
Mark J. Miller, Email: miller@pathology.wustl.edu.
Jennifer J. Linderman, Email: linderma@umich.edu.
Denise E. Kirschner, Email: kirschne@umich.edu.
References
- Anderson AO, Shaw S. T cell adhesion to endothelium: the FRC conduit system and other anatomic and molecular features which facilitate the adhesion cascade in lymph node. Semin Immunol. 1993;5(4):271–82. doi: 10.1006/smim.1993.1031. [DOI] [PubMed] [Google Scholar]
- Agrawal NG, Linderman JJ. Calcium response of helper T lymphocytes to antigen-presenting cells in a single-cell assay. Biophys J. 1995;69:1178–1190. doi: 10.1016/S0006-3495(95)79992-1. [DOI] [PMC free article] [PubMed] [Google Scholar]
- Aoshi T, Zinselmeyer BH, Konjufca V, Lynch JN, Zhang X, Koide Y, Miller MJ. Bacterial entry to the splenic white pulp initiates antigen presentation to CD8+ T cells. Immunity. 2008;29:476–486. doi: 10.1016/j.immuni.2008.06.013. [DOI] [PubMed] [Google Scholar]
- Arstila TP, Casrouge A, Baron V, Even J, Kanellopoulos J, Kourilsky P. A direct estimate of the human alphabeta T cell receptor diversity. Science. 1999;286 (5441):958–961. doi: 10.1126/science.286.5441.958. [DOI] [PubMed] [Google Scholar]
- Bajaria SH, Webb G, Cloyd M, Kirschner D. Dynamics of naive and memory CD4+ T lymphocytes in HIV-1 disease progression. J Acquir Immune Defic Syndr. 2002;30:41–58. doi: 10.1097/00042560-200205010-00006. [DOI] [PubMed] [Google Scholar]
- Bajenoff M, Egen JG, Koo LY, Laugier JP, Brau F, Glaichenhaus N, Germain RN. Stromal cell networks regulate lymphocyte entry, migration, and territoriality in lymph nodes. Immunity. 2006;25:989–1001. doi: 10.1016/j.immuni.2006.10.011. [DOI] [PMC free article] [PubMed] [Google Scholar]
- Baldazzi V, Paci P, Bernaschi M, Castiglione F. Modeling lymphocyte homing and encounters in lymph nodes. BMC Bioinformatics. 2009;10:387. doi: 10.1186/1471-2105-10-387. [DOI] [PMC free article] [PubMed] [Google Scholar]
- Bauer AL, Beauchemin CA, Perelson AS. Agent-based modeling of host-pathogen systems: The successes and challenges. Inf Sci (Ny) 2009;179:1379–1389. doi: 10.1016/j.ins.2008.11.012. [DOI] [PMC free article] [PubMed] [Google Scholar]
- Beauchemin C, Dixit NM, Perelson AS. Characterizing T cell movement within lymph nodes in the absence of antigen. J Immunol. 2007;178:5505–5512. doi: 10.4049/jimmunol.178.9.5505. [DOI] [PubMed] [Google Scholar]
- Beltman JB, Henrickson SE, von Andrian UH, de Boer RJ, Maree AF. Towards estimating the true duration of dendritic cell interactions with T cells. J Immunol Methods. 2009;347:54–69. doi: 10.1016/j.jim.2009.05.013. [DOI] [PMC free article] [PubMed] [Google Scholar]
- Beltman JB, Maree AF, de Boer RJ. Spatial modelling of brief and long interactions between T cells and dendritic cells. Immunol Cell Biol. 2007a;85:306–314. doi: 10.1038/sj.icb.7100054. [DOI] [PubMed] [Google Scholar]
- Beltman JB, Maree AF, Lynch JN, Miller MJ, de Boer RJ. Lymph node topology dictates T cell migration behavior. J Exp Med. 2007b;204:771–780. doi: 10.1084/jem.20061278. [DOI] [PMC free article] [PubMed] [Google Scholar]
- Beuneu H, Garcia Z, Bousso P. Cutting edge: cognate CD4 help promotes recruitment of antigen-specific CD8 T cells around dendritic cells. J Immunol. 2006 Aug 1;177(3):1406–10. doi: 10.4049/jimmunol.177.3.1406. [DOI] [PubMed] [Google Scholar]
- Blattman JN, Antia R, Sourdive DJ, Wang X, Kaech SM, Murali-Krishna K, Altman JD, Ahmed R. Estimating the precursor frequency of naive antigen-specific CD8 T cells. J Exp Med. 2002;195:657–664. doi: 10.1084/jem.20001021. [DOI] [PMC free article] [PubMed] [Google Scholar]
- Bogle G, Dunbar PR. Agent-based simulation of T-cell activation and proliferation within a lymph node. Immunol Cell Biol. 2010a;88:172–179. doi: 10.1038/icb.2009.78. [DOI] [PubMed] [Google Scholar]
- Bogle G, Dunbar PR. T cell responses in lymph nodes. Wiley Interdiscip Rev Syst Biol Med. 2010b;2:107–116. doi: 10.1002/wsbm.47. [DOI] [PubMed] [Google Scholar]
- Bogle G, Dunbar PR. Simulating T-cell motility in the lymph node paracortex with a packed lattice geometry. Immunol Cell Biol. 2008;86:676–687. doi: 10.1038/icb.2008.60. [DOI] [PMC free article] [PubMed] [Google Scholar]
- Bousso P, Robey E. Dynamics of CD8+ T cell priming by dendritic cells in intact lymph nodes. Nat Immunol. 2003;4:579–585. doi: 10.1038/ni928. [DOI] [PubMed] [Google Scholar]
- Cahill RN, Frost H, Trnka Z. The effects of antigen on the migration of recirculating lymphocytes through single lymph nodes. J Exp Med. 1976;143:870–888. doi: 10.1084/jem.143.4.870. [DOI] [PMC free article] [PubMed] [Google Scholar]
- Casrouge A, Beaudoing E, Dalle S, Pannetier C, Kanellopoulos J, Kourilsky P. Size estimate of the alpha beta TCR repertoire of naive mouse splenocytes. J Immunol. 2000;164:5782–5787. doi: 10.4049/jimmunol.164.11.5782. [DOI] [PubMed] [Google Scholar]
- Castellino F, Huang AY, Altan-Bonnet G, Stoll S, Scheinecker C, Germain RN. Chemokines enhance immunity by guiding naive CD8+ T cells to sites of CD4+ T cell-dendritic cell interaction. Nature. 2006;440:890–895. doi: 10.1038/nature04651. [DOI] [PubMed] [Google Scholar]
- Catron DM, Itano AA, Pape KA, Mueller DL, Jenkins MK. Visualizing the first 50 hr of the primary immune response to a soluble antigen. Immunity. 2004;21:341–347. doi: 10.1016/j.immuni.2004.08.007. [DOI] [PubMed] [Google Scholar]
- Celada F, Seiden PE. A computer model of cellular interactions in the immune system. Immunol Today. 1992;13:56–62. doi: 10.1016/0167-5699(92)90135-T. [DOI] [PubMed] [Google Scholar]
- Celli S, Lematre F, Bousso P. Real-time manipulation of T cell-dendritic cell interactions in vivo reveals the importance of prolonged contacts for CD4+ T cell activation. Immunity. 2007 Oct;27(4):625–34. doi: 10.1016/j.immuni.2007.08.018. [DOI] [PubMed] [Google Scholar]
- Celli S, Garcia Z, Beuneu H, Bousso P. Decoding the dynamics of T cell-dendritic cell interactions in vivo. Immunol Rev. 2008;221:182–187. doi: 10.1111/j.1600-065X.2008.00588.x. [DOI] [PubMed] [Google Scholar]
- Chang ST, Linderman JJ, Kirschner DE. Multiple mechanisms allow Mycobacterium tuberculosis to continuously inhibit MHC class II-mediated antigen presentation by macrophages. Proc Natl Acad Sci U S A. 2005;102:4530–4535. doi: 10.1073/pnas.0500362102. [DOI] [PMC free article] [PubMed] [Google Scholar]
- Chyou S, Ekland EH, Carpenter AC, Tzeng TC, Tian S, Michaud M, Madri JA, Lu TT. Fibroblast-type reticular stromal cells regulate the lymph node vasculature. J Immunol. 2008;181:3887–3896. doi: 10.4049/jimmunol.181.6.3887. [DOI] [PMC free article] [PubMed] [Google Scholar]
- Coombs D, Kalergis AM, Nathenson SG, Wofsy C, Goldstein B. Activated TCRs remain marked for internalization after dissociation from pMHC. Nat Immunol. 2002;3:926–931. doi: 10.1038/ni838. [DOI] [PubMed] [Google Scholar]
- DeFea KA. Stop that cell! Beta-arrestin-dependent chemotaxis: a tale of localized actin assembly and receptor desensitization. Annu Rev Physiol. 2007;69:535– 560. doi: 10.1146/annurev.physiol.69.022405.154804. [DOI] [PubMed] [Google Scholar]
- Demotz S, Grey HM, Sette A. The minimal number of class II MHC- antigen complexes needed for T cell activation. Science. 1990;249:1028–1030. doi: 10.1126/science.2118680. [DOI] [PubMed] [Google Scholar]
- Diedrich CR, Mattila JT, Klein E, Janssen C, Phuah J, Sturgeon TJ, Montelaro RC, Lin PL, Flynn JL. Reactivation of latent tuberculosis in cynomolgus macaques infected with SIV is associated with early peripheral T cell depletion and not virus load. PLoS One. 2010;5:e9611. doi: 10.1371/journal.pone.0009611. [DOI] [PMC free article] [PubMed] [Google Scholar]
- Egen JG, Rothfuchs AG, Feng CG, Winter N, Sher A, Germain RN. Macrophage and T cell dynamics during the development and disintegration of mycobacterial granulomas. Immunity. 2008;28:271–284. doi: 10.1016/j.immuni.2007.12.010. [DOI] [PMC free article] [PubMed] [Google Scholar]
- Engelmayer J, Larsson M, Subklewe M, Chahroudi A, Cox WI, Steinman RM, Bhardwaj N. Vaccinia virus inhibits the maturation of human dendritic cells: a novel mechanism of immune evasion. J Immunol. 1999;163:6762–6768. [PubMed] [Google Scholar]
- Fallahi-Sichani M, El-Kebir M, Marino S, Kirschner DE, Linderman JJ. Multiscale Computational Modeling Reveals a Critical Role for TNF-{alpha} Receptor 1 Dynamics in Tuberculosis Granuloma Formation. J Immunol. 2011 doi: 10.4049/jimmunol.1003299. [DOI] [PMC free article] [PubMed] [Google Scholar]
- Fallahi-Sichani M, Schaller MA, Kirschner DE, Kunkel SL, Linderman JJ. Identification of key processes that control tumor necrosis factor availability in a tuberculosis granuloma. PLoS Comput Biol. 2010;6:e1000778. doi: 10.1371/journal.pcbi.1000778. [DOI] [PMC free article] [PubMed] [Google Scholar]
- Figge MT, Meyer-Hermann M. Modeling receptor-ligand binding kinetics in immunological synapse formation. Eur Phys J D. 2009;51:153–160. [Google Scholar]
- Ford WL, Simmonds SJ. The tempo of lymphocyte recirculation from blood to lymph in the rat. Cell Tissue Kinet. 1972;5:175–189. doi: 10.1111/j.1365-2184.1972.tb01014.x. [DOI] [PubMed] [Google Scholar]
- Glazier JA, Graner F. Simulation of the differential adhesion driven rearrangement of biological cells. Phys Rev E Stat Phys Plasmas Fluids Relat Interdiscip Topics. 1993;47:2128–2154. doi: 10.1103/physreve.47.2128. [DOI] [PubMed] [Google Scholar]
- Gonzalez PA, Carreno LJ, Coombs D, Mora JE, Palmieri E, Goldstein B, Nathenson SG, Kalergis AM. T cell receptor binding kinetics required for T cell activation depend on the density of cognate ligand on the antigen- presenting cell. Proc Natl Acad Sci U S A. 2005;102:4824–4829. doi: 10.1073/pnas.0500922102. [DOI] [PMC free article] [PubMed] [Google Scholar]
- Gowans JL. The recirculation of lymphocytes from blood to lymph in the rat. J Physiol. 1959;146:54–69. doi: 10.1113/jphysiol.1959.sp006177. [DOI] [PMC free article] [PubMed] [Google Scholar]
- Graner F, Glazier JA. Simulation of biological cell sorting using a two- dimensional extended Potts model. Phys Rev Lett. 1992;69:2013–2016. doi: 10.1103/PhysRevLett.69.2013. [DOI] [PubMed] [Google Scholar]
- Grigorova IL, Panteleev M, Cyster JG. Lymph node cortical sinus organization and relationship to lymphocyte egress dynamics and antigen exposure. Proc Natl Acad Sci U S A. 2010;107:20447–20452. doi: 10.1073/pnas.1009968107. [DOI] [PMC free article] [PubMed] [Google Scholar]
- Grigorova IL, Schwab SR, Phan TG, Pham TH, Okada T, Cyster JG. Cortical sinus probing, S1P1-dependent entry and flow-based capture of egressing T cells. Nat Immunol. 2009;10:58–65. doi: 10.1038/ni.1682. [DOI] [PMC free article] [PubMed] [Google Scholar]
- Hall J, Scollay R, Smith M. Studies on the lymphocytes of sheep. I Recirculation of lymphocytes through peripheral lymph nodes and tissues. Eur J Immunol. 1976;6:117–120. doi: 10.1002/eji.1830060209. [DOI] [PubMed] [Google Scholar]
- Harding CV, Ramachandra L, Wick MJ. Interaction of bacteria with antigen presenting cells: influences on antigen presentation and antibacterial immunity. Curr Opin Immunol. 2003;15:112–119. doi: 10.1016/s0952-7915(02)00008-0. [DOI] [PubMed] [Google Scholar]
- Harding CV, Unanue ER. Quantitation of antigen-presenting cell MHC class II/peptide complexes necessary for T-cell stimulation. Nature. 1990;346:574–576. doi: 10.1038/346574a0. [DOI] [PubMed] [Google Scholar]
- Hay JB, Hobbs BB. The flow of blood to lymph nodes and its relation to lymphocyte traffic and the immune response. J Exp Med. 1977;145:31–44. doi: 10.1084/jem.145.1.31. [DOI] [PMC free article] [PubMed] [Google Scholar]
- Hmama Z, Gabathuler R, Jefferies WA, de Jong G, Reiner NE. Attenuation of HLA-DR expression by mononuclear phagocytes infected with Mycobacterium tuberculosis is related to intracellular sequestration of immature class II heterodimers. J Immunol. 1998;161:4882–4893. [PubMed] [Google Scholar]
- Jain RK. Molecular regulation of vessel maturation. Nat Med. 2003;9:685–693. doi: 10.1038/nm0603-685. [DOI] [PubMed] [Google Scholar]
- Kirschner DE. Silico Immunology. Springer; US: 2007. The Multi-scale Immune Response to Pathogens: M. tuberculosis as an Example; pp. 289–311. [Google Scholar]
- Kirschner DE, Chang ST, Riggs TW, Perry N, Linderman JJ. Toward a multiscale model of antigen presentation in immunity. Immunol Rev. 2007;216:93–118. doi: 10.1111/j.1600-065X.2007.00490.x. [DOI] [PubMed] [Google Scholar]
- Kirschner DE, Linderman JJ. Mathematical and computational approaches can complement experimental studies of host-pathogen interactions. Cell Microbiol. 2009;11:531–539. doi: 10.1111/j.1462-5822.2008.01281.x. [DOI] [PMC free article] [PubMed] [Google Scholar]
- Konjufca V, Miller MJ. Two-photon microscopy of host-pathogen interactions: acquiring a dynamic picture of infection in vivo. Cell Microbiol. 2009;11(4):551–9. doi: 10.1111/j.1462-5822.2009.01289.x. [DOI] [PubMed] [Google Scholar]
- Lin J, Miller MJ, Shaw AS. The c-SMAC: sorting it all out (or in) J Cell Biol. 2005 Jul 18;170(2):177–82. doi: 10.1083/jcb.200503032. [DOI] [PMC free article] [PubMed] [Google Scholar]
- Linderman JJ, Riggs T, Pande M, Miller M, Marino S, Kirschner DE. Characterizing the dynamics of CD4+ T cell priming within a lymph node. J Immunol. 2010;184:2873–2885. doi: 10.4049/jimmunol.0903117. [DOI] [PMC free article] [PubMed] [Google Scholar]
- Lo CG, Xu Y, Proia RL, Cyster JG. Cyclical modulation of sphingosine-1-phosphate receptor 1 surface expression during lymphocyte recirculation and relationship to lymphoid organ transit. J Exp Med. 2005;201:291–301. doi: 10.1084/jem.20041509. [DOI] [PMC free article] [PubMed] [Google Scholar]
- Marino S, Hogue IB, Ray CJ, Kirschner DE. A methodology for performing global uncertainty and sensitivity analysis in systems biology. J Theor Biol. 2008;254:178–196. doi: 10.1016/j.jtbi.2008.04.011. [DOI] [PMC free article] [PubMed] [Google Scholar]
- Marino S, Linderman JJ, Kirschner DE. A multifaceted approach to modeling the immune response in tuberculosis. Wiley Interdiscip Rev Syst Biol Med. 2010a doi: 10.1002/wsbm.131. [DOI] [PMC free article] [PubMed] [Google Scholar]
- Marino S, Myers A, Flynn JL, Kirschner DE. TNF and IL-10 are major factors in modulation of the phagocytic cell environment in lung and lymph node in tuberculosis: a next-generation two-compartmental model. J Theor Biol. 2010b;265:586–598. doi: 10.1016/j.jtbi.2010.05.012. [DOI] [PMC free article] [PubMed] [Google Scholar]
- Marino S, Pawar S, Fuller CL, Reinhart TA, Flynn JL, Kirschner DE. Dendritic cell trafficking and antigen presentation in the human immune response to Mycobacterium tuberculosis. J Immunol. 2004;173:494–506. doi: 10.4049/jimmunol.173.1.494. [DOI] [PubMed] [Google Scholar]
- Matloubian M, Lo CG, Cinamon G, Lesneski MJ, Xu Y, Brinkmann V, Allende ML, Proia RL, Cyster JG. Lymphocyte egress from thymus and peripheral lymphoid organs is dependent on S1P receptor 1. Nature. 2004;427:355–360. doi: 10.1038/nature02284. [DOI] [PubMed] [Google Scholar]
- Mazzaccaro RJ, Gedde M, Jensen ER, van Santen HM, Ploegh HL, Rock KL, Bloom BR. Major histocompatibility class I presentation of soluble antigen facilitated by Mycobacterium tuberculosis infection. Proc Natl Acad Sci U S A. 1996;93:11786–11791. doi: 10.1073/pnas.93.21.11786. [DOI] [PMC free article] [PubMed] [Google Scholar]
- McFadden G, Murphy PM. Host-related immunomodulators encoded by poxviruses and herpesviruses. Curr Opin Microbiol. 2000;3:371–378. doi: 10.1016/s1369-5274(00)00107-7. [DOI] [PubMed] [Google Scholar]
- Meier-Schellersheim M, Xu X, Angermann B, Kunkel EJ, Jin T, Germain RN. Key role of local regulation in chemosensing revealed by a new molecular interaction-based modeling method. PLoS Comput Biol. 2006;2:e82. doi: 10.1371/journal.pcbi.0020082. [DOI] [PMC free article] [PubMed] [Google Scholar]
- Mempel TR, Henrickson SE, Von Andrian UH. T-cell priming by dendritic cells in lymph nodes occurs in three distinct phases. Nature. 2004;427:154–159. doi: 10.1038/nature02238. [DOI] [PubMed] [Google Scholar]
- Meyer-Hermann ME, Maini PK. Interpreting two-photon imaging data of lymphocyte motility. Phys Rev E Stat Nonlin Soft Matter Phys. 2005;71:061912. doi: 10.1103/PhysRevE.71.061912. [DOI] [PubMed] [Google Scholar]
- Miller MJ. MJ Miller’s introduction for the Seminars in Immunopathology special issue on two-photon imaging immunity. Semin Immunopathol. 2010;32(3):211–3. doi: 10.1007/s00281-010-0218-8. [DOI] [PubMed] [Google Scholar]
- Miller MJ, Hejazi AS, Wei SH, Cahalan MD, Parker I. T cell repertoire scanning is promoted by dynamic dendritic cell behavior and random T cell motility in the lymph node. Proc Natl Acad Sci U S A. 2004a;101:998–1003. doi: 10.1073/pnas.0306407101. [DOI] [PMC free article] [PubMed] [Google Scholar]
- Miller MJ, Safrina O, Parker I, Cahalan MD. Imaging the single cell dynamics of CD4+ T cell activation by dendritic cells in lymph nodes. J Exp Med. 2004b;200:847–856. doi: 10.1084/jem.20041236. [DOI] [PMC free article] [PubMed] [Google Scholar]
- Miller MJ, Wei SH, Parker I, Cahalan MD. Two-photon imaging of lymphocyte motility and antigen response in intact lymph node. Science. 2002;296:1869–1873. doi: 10.1126/science.1070051. [DOI] [PubMed] [Google Scholar]
- Moreno C, Mehlert A, Lamb J. The inhibitory effects of mycobacterial lipoarabinomannan and polysaccharides upon polyclonal and monoclonal human T cell proliferation. Clin Exp Immunol. 1988;74:206–210. [PMC free article] [PubMed] [Google Scholar]
- Mueller SN, Germain RN. Stromal cell contributions to the homeostasis and functionality of the immune system. Nat Rev Immunol. 2009;9:618–629. doi: 10.1038/nri2588. [DOI] [PMC free article] [PubMed] [Google Scholar]
- Naylor K, Li G, Vallejo AN, Lee WW, Koetz K, Bryl E, Witkowski J, Fulbright J, Weyand CM, Goronzy JJ. The influence of age on T cell generation and TCR diversity. J Immunol. 2005;174(11):7446–52. doi: 10.4049/jimmunol.174.11.7446. [DOI] [PubMed] [Google Scholar]
- Noss EH, Harding CV, Boom WH. Mycobacterium tuberculosis inhibits MHC class II antigen processing in murine bone marrow macrophages. Cell Immunol. 2000;201:63–74. doi: 10.1006/cimm.2000.1633. [DOI] [PubMed] [Google Scholar]
- Okada T, Cyster JG. CC chemokine receptor 7 contributes to Gi- dependent T cell motility in the lymph node. J Immunol. 2007;178:2973–2978. doi: 10.4049/jimmunol.178.5.2973. [DOI] [PubMed] [Google Scholar]
- Pham TH, Okada T, Matloubian M, Lo CG, Cyster JG. S1P1 receptor signaling overrides retention mediated by G alpha i-coupled receptors to promote T cell egress. Immunity. 2008;28:122–133. doi: 10.1016/j.immuni.2007.11.017. [DOI] [PMC free article] [PubMed] [Google Scholar]
- Preston SP, Waters SL, Jensen OE, Heaton PR, Pritchard DI. T-cell motility in the early stages of the immune response modeled as a random walk amongst targets. Phys Rev E Stat Nonlin Soft Matter Phys. 2006;74:011910. doi: 10.1103/PhysRevE.74.011910. [DOI] [PubMed] [Google Scholar]
- Randolph GJ, Angeli V, Swartz MA. Dendritic-cell trafficking to lymph nodes through lymphatic vessels. Nat Rev Immunol. 2005;5:617–628. doi: 10.1038/nri1670. [DOI] [PubMed] [Google Scholar]
- Riggs T, Walts A, Perry N, Bickle L, Lynch JN, Myers A, Flynn J, Linderman JJ, Miller MJ, Kirschner DE. A comparison of random vs. chemotaxis- driven contacts of T cells with dendritic cells during repertoire scanning. J Theor Biol. 2008;250:732–751. doi: 10.1016/j.jtbi.2007.10.015. [DOI] [PMC free article] [PubMed] [Google Scholar]
- Sage PT, Carman CV. Settings and mechanisms for trans-cellular diapedesis. Front Biosci. 2009;14:5066–5083. doi: 10.2741/3587. [DOI] [PMC free article] [PubMed] [Google Scholar]
- Sallusto F, Schaerli P, Loetscher P, Schaniel C, Lenig D, Mackay CR, Qin S, Lanzavecchia A. Rapid and coordinated switch in chemokine receptor expression during dendritic cell maturation. Eur J Immunol. 1998;28:2760–2769. doi: 10.1002/(SICI)1521-4141(199809)28:09<2760::AID-IMMU2760>3.0.CO;2-N. [DOI] [PubMed] [Google Scholar]
- Sathaliyawala T, O’Gorman WE, Greter M, Bogunovic M, Konjufca V, Hou ZE, Nolan GP, Miller MJ, Merad M, Reizis B. Mammalian target of rapamycin controls dendritic cell development downstream of Flt3 ligand signaling. Immunity. 2010;33:597–606. doi: 10.1016/j.immuni.2010.09.012. [DOI] [PMC free article] [PubMed] [Google Scholar]
- Shakhar G, Lindquist RL, Skokos D, Dudziak D, Huang JH, Nussenzweig MC, Dustin ML. Stable T cell-dendritic cell interactions precede the development of both tolerance and immunity in vivo. Nat Immunol. 2005 Jul;6(7):707–14. doi: 10.1038/ni1210. [DOI] [PMC free article] [PubMed] [Google Scholar]
- Sinha RK, Park C, Hwang IY, Davis MD, Kehrl JH. B lymphocytes exit lymph nodes through cortical lymphatic sinusoids by a mechanism independent of sphingosine-1-phosphate-mediated chemotaxis. Immunity. 2009;30:434–446. doi: 10.1016/j.immuni.2008.12.018. [DOI] [PMC free article] [PubMed] [Google Scholar]
- Smith ME, Ford WL. The recirculating lymphocyte pool of the rat: a systematic description of the migratory behaviour of recirculating lymphocytes. Immunology. 1983;49:83–94. [PMC free article] [PubMed] [Google Scholar]
- Soderberg KA, Payne GW, Sato A, Medzhitov R, Segal SS, Iwasaki A. Innate control of adaptive immunity via remodeling of lymph node feed arteriole. Proc Natl Acad Sci U S A. 2005;102:16315–16320. doi: 10.1073/pnas.0506190102. [DOI] [PMC free article] [PubMed] [Google Scholar]
- Steeber DA, Erickson CM, Hodde KC, Albrecht RM. Vascular changes in popliteal lymph nodes due to antigen challenge in normal and lethally irradiated mice. Scanning Microsc. 1987;1:831–839. [PubMed] [Google Scholar]
- Tomura M, Yoshida N, Tanaka J, Karasawa S, Miwa Y, Miyawaki A, Kanagawa O. Monitoring cellular movement in vivo with photoconvertible fluorescence protein “Kaede” transgenic mice. Proc Natl Acad Sci U S A. 2008;105:10871–10876. doi: 10.1073/pnas.0802278105. [DOI] [PMC free article] [PubMed] [Google Scholar]
- Tortorella D, Gewurz BE, Furman MH, Schust DJ, Ploegh HL. Viral subversion of the immune system. Annu Rev Immunol. 2000;18:861–926. doi: 10.1146/annurev.immunol.18.1.861. [DOI] [PubMed] [Google Scholar]
- von Andrian UH, Mempel TR. Homing and cellular traffic in lymph nodes. Nat Rev Immunol. 2003;3:867–878. doi: 10.1038/nri1222. [DOI] [PubMed] [Google Scholar]
- Waite J, Leirner I, Lauer P, Rae CS, Barbet G, Zheng H, Portnoy DA, Pamer EG, Dustin ML. Dynamic imaging of the effector immune response to Listeria infection in vivo. PLoS Pathog. 2011;7(3):e1001326. doi: 10.1371/journal.ppat.1001326. [DOI] [PMC free article] [PubMed] [Google Scholar]
- Webster B, Ekland EH, Agle LM, Chyou S, Ruggieri R, Lu TT. Regulation of lymph node vascular growth by dendritic cells. J Exp Med. 2006;203:1903–1913. doi: 10.1084/jem.20052272. [DOI] [PMC free article] [PubMed] [Google Scholar]
- Wei SH, Parker I, Miller MJ, Cahalan MD. A stochastic view of lymphocyte motility and trafficking within the lymph node. Immunol Rev. 2003;195:136–159. doi: 10.1034/j.1600-065x.2003.00076.x. [DOI] [PubMed] [Google Scholar]
- Wei SH, Rosen H, Matheu MP, Sanna MG, Wang SK, Jo E, Wong CH, Parker I, Cahalan MD. Sphingosine 1-phosphate type 1 receptor agonism inhibits transendothelial migration of medullary T cells to lymphatic sinuses. Nat Immunol. 2005;6:1228–1235. doi: 10.1038/ni1269. [DOI] [PubMed] [Google Scholar]
- Weisstein Eric W. “Moore Neighborhood.” From MathWorld--A Wolfram Web Resource. http://mathworld.wolfram.com/MooreNeighborhood.html.
- Westermann J, Persin S, Matyas J, van der Meide P, Pabst R. IFN- gamma influences the migration of thoracic duct B and T lymphocyte subsets in vivo. Random increase in disappearance from the blood and differential decrease in reappearance in the lymph. J Immunol. 1993;150:3843–3852. [PubMed] [Google Scholar]
- Westermann J, Puskas Z, Pabst R. Blood transit and recirculation kinetics of lymphocyte subsets in normal rats. Scand J Immunol. 1988;28:203–210. doi: 10.1111/j.1365-3083.1988.tb02432.x. [DOI] [PubMed] [Google Scholar]
- Worbs T, Forster R. T cell migration dynamics within lymph nodes during steady state: an overview of extracellular and intracellular factors influencing the basal intranodal T cell motility. Curr Top Microbiol Immunol. 2009;334:71–105. doi: 10.1007/978-3-540-93864-4_4. [DOI] [PubMed] [Google Scholar]
- Worbs T, Mempel TR, Bolter J, von Andrian UH, Forster R. CCR7 ligands stimulate the intranodal motility of T lymphocytes in vivo. J Exp Med. 2007;204:489–495. doi: 10.1084/jem.20061706. [DOI] [PMC free article] [PubMed] [Google Scholar]
- Wylie DC, Das J, Chakraborty AK. Sensitivity of T cells to antigen and antagonism emerges from differential regulation of the same molecular signaling module. Proc Natl Acad Sci U S A. 2007;104:5533–5538. doi: 10.1073/pnas.0611482104. [DOI] [PMC free article] [PubMed] [Google Scholar]
- Young D, Stark J, Kirschner D. Systems biology of persistent infection: tuberculosis as a case study. Nat Rev Microbiol. 2008;6:520–528. doi: 10.1038/nrmicro1919. [DOI] [PubMed] [Google Scholar]
- Yrlid U, Svensson M, Kirby A, Wick MJ. Antigen-presenting cells and anti-Salmonella immunity. Microbes Infect. 2001;3:1239–1248. doi: 10.1016/s1286-4579(01)01484-8. [DOI] [PubMed] [Google Scholar]
- Yrlid U, Wick MJ. Salmonella-induced apoptosis of infected macrophages results in presentation of a bacteria-encoded antigen after uptake by bystander dendritic cells. J Exp Med. 2000;191:613–624. doi: 10.1084/jem.191.4.613. [DOI] [PMC free article] [PubMed] [Google Scholar]
- Zheng H, Jin B, Henrickson SE, Perelson AS, von Andrian UH, Chakraborty AK. How antigen quantity and quality determine T-cell decisions in lymphoid tissue. Mol Cell Biol. 2008;28:4040–4051. doi: 10.1128/MCB.00136-08. [DOI] [PMC free article] [PubMed] [Google Scholar]
- Zinselmeyer BH, Dempster J, Gurney AM, Wokosin D, Miller M, Ho H, Millington OR, Smith KM, Rush CM, Parker I, Cahalan M, Brewer JM, Garside P. In situ characterization of CD4+ T cell behavior in mucosal and systemic lymphoid tissues during the induction of oral priming and tolerance. J Exp Med. 2005 Jun 6;201(11):1815–23. doi: 10.1084/jem.20050203. [DOI] [PMC free article] [PubMed] [Google Scholar]