

Abstract
Objective
Stress has been associated with high-calorie, low-nutrient food intake (HCLN) and emotion-driven eating (EDE). However, effects on healthy food intake remain unknown. This study examined two facets of stress (self-efficacy, perceived helplessness) and food consumption, mediated by EDE.
Methods
Cross-sectional data from fourth-graders (n = 978; 52% female, 28% Hispanic) in an obesity intervention used self-report to assess self-efficacy, helplessness, EDE, fruit/vegetable (FV) intake, and high-calorie/low-nutrient (HCLN) food.
Results
Higher stress self-efficacy was associated with higher FV intake, β = .354, p < 0.001, and stress perceived helplessness had an indirect effect on HCLN intake through emotion-driven eating, indirect effect = .094, p < 0.001; χ2(347) = 659.930, p < 0.001, CFI = 0.940, TLI = 0.930, RMSEA = 0.030, p = 1.00, adjusting for gender, ethnicity, BMI z-score, and program group.
Conclusions and Implications
Stress self-efficacy may be more important for healthy food intake and perceived helplessness may indicate emotion-driven eating and unhealthy snack food intake. Obesity prevention programs may consider teaching stress management techniques to avoid emotion-driven eating.
Keywords: executive function, child obesity, stress, nutrition, emotion driven eating, junk food, snack food
The prevalence of childhood obesity has prompted widespread investigation into factors influencing healthy eating behavior in children (Barlow & Dietz, 1998; Ebbeling, Pawlak, & Ludwig, 2002; Story, Nanney, & Schwartz, 2009). Childhood obesity has been associated with earlier puberty in girls, metabolic syndrome, and adult obesity, which may increase risk of cancer in adulthood (Biro & Wien, 2010). Recent research has begun to suggest that stress may increase consumption of high-calorie/low-nutrient foods (HCLN) high in fat, salt, and sugar, at least for certain types of stress (e.g., socio-emotional) (Michels et al., 2012; Tryon, Carter, DeCant, & Laugero, 2013; Tryon, DeCant, & Laugero, 2013). Chronic stress may alter the brain’s activation patterns in response to high-calorie foods, increasing activity in areas associated with reward and decreasing activation in pre-frontal areas associated with emotional control (Tryon, Carter et al., 2013). If stress prompts increased consumption of unhealthy foods, healthier options may be crowded out of the diet. In this case, children experiencing high stress may consume fewer fruits and vegetables and have greater intake of high-fat, sugary foods.
Socio-economic disadvantage and stressful experiences could increase child negative affect through many paths including changes in the family environment, and disruptions could prompt emotional eating as a coping technique, contributing to obesity (Hemmingsson, 2014; Pervanidou & Chrousos, 2011). Indeed, some evidence indicates that 4th grade children who experience a greater number of negative events report eating fewer fruits and vegetables, even controlling for emotional eating behavior (Michels et al., 2012). Using cortisol as an indicator of stress, hypercortisolism is associated with more frequent consumption of sweet and fatty snack foods but not fruits and vegetables (Michels et al., 2013). Finally, although Hispanic and African-American populations may be at higher risk for obesity in the US (Lutfiyya, Garcia, Dankwa, Young, & Lipsky, 2008), limited studies have investigated these effects within minority populations (Nguyen-Michel, Unger, & Spruijt-Metz, 2007).
Emotion-driven eating is the tendency to consume food as a means to cope with moods or stress rather than physical hunger (Nguyen-Rodriguez, Chou, Unger, & Spruijt-Metz, 2008; Rollins et al., 2011; Spruijt-Metz, 1999) and may be an important underlying process connecting stress to dietary intake. Among children, emotion-driven eating has been associated with stressful life events (Hou et al., 2013; Michels et al., 2012) and intake of sweet and salty energy-dense foods (Nguyen-Michel et al., 2007; Rollins et al., 2011). Emotion-driven eating has been associated with higher snack food intake with television and video-gaming in children (Pentz, Spruijt-Metz, Chou, & Riggs, 2011; Snoek, van Strien, Janssens, & Engels, 2006). Emotional eating has been found to occur at higher rates for girls, (Hou et al., 2013) yet is associated with more frequent fruit and vegetable consumption (Nguyen-Michel et al., 2007) and high-calorie/low nutrient food intake in boys (Rollins et al., 2011). Stress may increase emotional eating in adolescents (Kubiak, Vogele, Siering, Schiel, & Weber, 2008; Pentz et al., 2011). One study tested a cross-sectional mediational model in pre-adolescents for three types of stressors: problems, life events, and daily hassles (Michels et al., 2012). They found that problems were associated with higher sweet and fatty food consumption, yet events were associated with higher fruit and vegetable intake. Although emotional eating was associated with both types of stressors, none of the relationships were mediated by emotional eating (Michels et al., 2012). Thus, the type of stress may impact how diet is affected. Yet study findings are inconclusive, with some studies finding no relationships between stress, emotional eating, and healthy eating habits (Austin, Smith, & Patterson, 2009; Markus, Verschoor, & Smeets, 2012). While previous research has shown a correlation between stress and unhealthy food intake, effects of stress on emotion-driven eating and healthy food intake remain unclear.
One potential reason for contradictory findings is that researchers often conceptualize and measure stress as a uni-dimensional construct (Austin et al., 2009; Nguyen-Rodriguez et al., 2008). The Perceived Stress Scale was originally designed as a uni-dimensional measure using Cronbach’s alpha as a measure of internal consistency reliability in a college student sample (Cohen, Kamarck, & Mermelstein, 1983). However, more recent validation studies have used exploratory and confirmatory factor analysis and find that stress falls predominantly into two factors: (a) perceived self-efficacy and (b) perceived helplessness (Andreou et al., 2011; Lee, 2012). High perceived self-efficacy indicates confidence in one’s ability to manage stressors, whereas high perceived helplessness reflects negative affectivity and feeling unable to cope or exert control. In a recent review of studies examining psychometric properties of the Perceived Stress Scale, Lee (2012) found that most studies indicated this two-factor structure for the 10- and 14-item versions. Thus, these separate factors seem to reflect two distinct constructs—confidence in managing stressors and negative affective responses. Accordingly, a person could theoretically score high on both dimensions. These two facets of stress could relate differently to dietary intake of healthy and unhealthy foods. For example, the ability to manage stressors could decrease the tendency to engage in overconsumption of highly palatable “comfort” foods even in the face of stress, allowing children to maintain healthier dietary consumption patterns. Conversely, negative affective reactivity could lead to emotion-driven eating that prompts consumption of foods high in fat, salt and sugar. Some studies suggest a mediating mechanism of the brain’s reward system becoming sensitized to high-calorie, palatable foods (Tryon, Carter et al., 2013; Wagner, Boswell, Kelley, & Heatherton, 2012).
This cross-sectional study investigated whether two facets of stress had direct and indirect effects on self-reported intake of HCLN and fruits/vegetables, mediated by emotion-driven eating. Hypotheses were: (a) perceived helplessness would be associated with higher consumption of HCLN foods and lower fruit/vegetable intake; (b) perceived self-efficacy would be associated with higher fruit/vegetable consumption and lower HCLN intake; (c) these relationships would be mediated by emotion-driven eating.
Methods
Participants were from the baseline wave of a controlled, school-based obesity intervention study called Pathways to Health (Riggs, Sakuma, & Pentz, 2007). The program was designed to improve executive function skills, dietary intake, and physical activity levels (Riggs, Sakuma, & Pentz, 2007). Participants were 4th grade students from across 28 Southern California elementary schools. Schools were randomized to the intervention or control condition and had an average of 35 participating classrooms (range = 2 – 77; median 32). The average number of students per classroom was 12 (range = 1 – 26; median = 10.5). Of the 1,587 participants at baseline, 1,005 had full active consent. Those whose parents gave only passive consent (or did not request that their child be excluded) were not tracked over time. The survey was administered aloud during a 45-minute session in the classroom, with trained staff available to answer comprehension questions. Due to the limited amount of time for survey administration, abbreviated scales were used, which is typical in school-based research (Gortmaker et al., 1999). Participant height and weight were measured by study staff. All procedures were approved by [blinded for review]. Age- and sex-adjusted Body Mass Index (BMI) was calculated based on Centers for Disease Control (CDC) guidelines (www.cdc.gov), which were validated using US national data (CDC, 2002). Obesity was defined as BMI ≥ 95thpercentile. The sample was 52% female, 9.26 years of age (SD = 0.48), 28% Hispanic, 25% free/reduced lunch, and 24% obese.
Perceived stress was measured with eight items from the Perceived Stress Scale, a validated measure of stress, with slight wording modification to increase comprehensibility among 4th graders (Cohen et al., 1983). Eight items were selected for the current study to adhere to the survey length limitations. Examples include “I was angry because of things that happened that were outside of my control.” and “I felt that I could handle important changes that were happening in my life.” (reverse-coded) (see Table 3 for a complete list). Response options for stress experienced in the past week (7 days) were: 1 = Never; 2 = Sometimes; 3 = Often. Positively-worded items were reverse-coded such that higher scores represented greater stress. Emotion-driven eating was measured with the six items of the Emotion Driven factor from the Eating in Emotional Situations Questionnaire (Rollins et al., 2011). Response options were: 1 = Never; 2 = Sometimes; 3 = Often; higher scores indicated greater emotion-driven eating. Self-reported intake of HCLN foods (5 items) and fruits/vegetables (7 items) was measured with items from an open-source food frequency questionnaire (Willett et al., 1985). The question stem was “How often do you eat/drink… ?” for both. For HCLN intake, the items were fries, chips, doughnuts, candy, and soda. For fruit/vegetables, they were fruit, fruit juice, vegetable juice, green salad, potatoes, vegetable soups, and other vegetables. Response options were: 1 = Less than once a week, 2 = Once a week, 3 = 2-3 times a week, 4 = 4-6 times a week, 5 = Once a day, 6 = 2 or more of these a day.
Table 3.
Standardized Factor Loadings and Covariances for Final Measurement Model
| Item | Parameter estimate |
|---|---|
| Stress - perceived helplessness (α = .60) | |
| I got upset because of something that happened all of a sudden. | 0.66 |
| I felt nervous and “anxious.” | 0.53 |
| I was angry because of things that happened that were outside of my control. | 0.53 |
| Stress - perceived self-efficacy (α = .67) | |
| I felt that I could handle important changes that were happening in my life. | 0.58 |
| I felt good about my ability to handle my problems. | 0.64 |
| I found that I could handle all the things that I had to do. | 0.56 |
| I handled problems that bothered me. | 0.53 |
| I felt that things were going the way I wanted them to. | 0.35 |
| Fruit & vegetable intake (α = .73) | |
| How often do you drink fruit juice, like orange—fresh, frozen or canned. (Not sodas or other drinks)? | 0.39 |
| How often do you eat any fruit, fresh or canned (not counting juice)? | 0.47 |
| How often do you drink vegetable juice, like tomato juice, V-8, carrot juice? | 0.45 |
| How often do you eat green salad? | 0.58 |
| How often do you eat vegetable soups, or stew with vegetables? | 0.68 |
| How often do you eat any other vegetables, including string beans, peas, corn, broccoli or any other kind? | 0.67 |
| How often do you eat potatoes, NOT counting French fries? | 0.46 |
| HCLN intake (α = .80) | |
| How often do you eat French fries or fried potatoes? | 0.64 |
| How often do you eat corn chips, potato chips, popcorn, crackers? | 0.68 |
| How often do you eat doughnuts, pastries, cake, cookies (not low-fat)? | 0.73 |
| How often do you eat candy (chocolate, hard candy, candy bars)? | 0.68 |
| How often do you drink soda – not diet (or 1 can or glass)? | 0.65 |
| How often do you eat potatoes, NOT counting French fries? | 0.31 |
| Emotion-driven Eating (α = .76) | |
| I eat because it helps me deal with sadness. | 0.70 |
| I eat because I can’t stop eating. | 0.44 |
| I eat because it makes talking to my friends easier. | 0.50 |
| I eat because it helps me feel better when things are not going well. | 0.78 |
| I eat because then my family will leave me alone about my weight. | 0.37 |
| I eat because makes me feel less sad. | 0.76 |
| Covariances | |
| Ability to handle my problems WITH felt nervous | 0.13 |
| Ability to handle my problems WITH handled things I had to do | -0.11 |
| Felt things are going the way I want WITH handles things I had to do | 0.17 |
| Drink fruit juice WITH eat fruit | 0.23 |
Note: HCLN = High-calorie, low-nutrient; Modifications added to the original model are in bold
A two-step modeling approach was used. First, a measurement model was fit to confirm the underlying factor structure of the stress, eating, and dietary intake factors, using exploratory factor analysis. Stress was examined as both a one- and two-factor construct. Second, a structural model was fit based on the hypothesized relationships among these factors, including any modifications to the measurement model. Analysis was conducted using MPlus Version 6 (Muthén & Muthén). Absolute and relative goodness of fit statistics were used to assess model fit. Modification Indices suggested by MPlus and residual correlations >.10 were used to guide modification decisions, as described below. Intra-class correlations were calculated within classroom. None was > 0.05 for any variable, so the nested structure of the data was not modeled. Covariates included in the final structural model were child gender, ethnicity, BMI z-score, and program group (i.e., intervention or control).
Results
Table 1 shows demographic characteristics by gender. Boys and girls were similar in age, ethnicity, free/reduced lunch status and intervention group. However, more boys (31%) than girls (18%) were obese (p < 0.001). A higher percentage of Hispanic students was obese (35%) compared to non-Hispanic students (20%), χ2 = 24.85, p <.001. Table 2 shows correlations, means, and standard deviations for observed study variables. Variables for hypothesized factors tended to have significant intercorrelations (Stress – perceived helplessness [stress-PH], range = 0.27 - 0.36; Stress self-efficacy [stress-SE], range = 0.18 - 0.33; fruit & vegetable intake, range = 0.18 – 0.48; HCLN intake, range = 0.12 – 0.47; emotion-driven eating, range = 0.70 - 0.55). Internal reliability for each construct was acceptable but low for stress-SE, likely due to the small number of items (range α = .60 -.80) (see Table 3). Conceptually, these factors map onto the two factor structure found by researchers using more items in the Perceived Stress Scales (10 item; 14 item), increasing confidence in the reliability of these constructs (Andreou et al., 2011; Lee, 2012).
Table 1.
Demographic characteristics of the sample by gender
| Variable | N (%) or M (SD) | |||
|---|---|---|---|---|
|
| ||||
| Combined (n = 998) | Male (n = 480) | Female (n = 518) | χ2 or t-test | |
| Age in years | 9.26 (0.48) | 9.29 (0.49) | 9.25 (0.47) | 1.42 |
| Hispanic ethnicity | 280 (28%) | 141 (29%) | 139 (27%) | 0.80 |
| Free/reduced lunch | 251 (25%) | 117 (24%) | 134 (26%) | 0.28 |
| Obese | 238 (24%) | 143 (31%) | 95 (18%) | 19.71* |
| Intervention group | 542 (54%) | 258 (54%) | 284 (54%) | 0.06 |
p < 0.001
Table 2.
Correlation Matrix with Observed Variables, Means, and Standard Deviations
| Variable | 1 | 2 | 3 | 4 | 5 | 6 | 7 | 8 | 9 | 10 | 11 | 12 | 13 | 14 | 15 | 16 | 17 | 18 | 19 | 20 | 21 | 22 | 23 | 24 | 25 | 26 |
|---|---|---|---|---|---|---|---|---|---|---|---|---|---|---|---|---|---|---|---|---|---|---|---|---|---|---|
| Stress – Perceived Helplessness | ||||||||||||||||||||||||||
| 1 Got upset | -- | |||||||||||||||||||||||||
| 2 Felt nervous | .364** | -- | ||||||||||||||||||||||||
| 3 Out of my control | .341** | .271** | -- | |||||||||||||||||||||||
| Stress – Self-efficacy | ||||||||||||||||||||||||||
| 4 Handle probs. | -.012 | .093** | .016 | -- | ||||||||||||||||||||||
| 5 Handle difficulty | -.060 | -.018 | -.055 | .331** | -- | |||||||||||||||||||||
| 6 Felt good | .008 | .024 | .015 | .319** | .367** | -- | ||||||||||||||||||||
| 7 Things go | -.087** | .002 | -.069* | .176** | .208** | .238** | -- | |||||||||||||||||||
| 8 Handled to do | -.105** | -.059 | -.044 | .212** | .303** | .371** | .327** | -- | ||||||||||||||||||
| Fruit & Vegetable Intake | ||||||||||||||||||||||||||
| 9 Fruit juice | -.016 | -.049 | -.024 | .089** | .072* | .118** | .064* | .151** | -- | |||||||||||||||||
| 10 Fruit frequency | -.023 | -.001 | -.018 | .150** | .063* | .134** | .023 | .141** | .372** | -- | ||||||||||||||||
| 11 Vegetable juice | -.046 | -.029 | -.011 | .125** | .061 | .063 | .044 | .095** | .191** | .202** | -- | |||||||||||||||
| 12 Green salad | -.019 | -.032 | -.030 | .122** | .088** | .132** | .055 | .131** | .220** | .309** | .292** | -- | ||||||||||||||
| 13 Vegetable soup | -.057 | -.059 | -.055 | .142** | .121** | .169** | .077* | .126** | .244** | .247** | .315** | .373** | -- | |||||||||||||
| 14 Other vegetables | -.001 | -.011 | -.018 | .115** | .127** | .146** | .075* | .087** | .287** | .353** | .253** | .372** | .475** | -- | ||||||||||||
| 15 Potatoes | -.016 | -.044 | -.035 | .105** | .030 | .118** | .030 | .051 | .175** | .182** | .222** | .252** | .327** | .250** | -- | |||||||||||
| HCLN intake | ||||||||||||||||||||||||||
| 16 Fries | .063* | .027 | .098** | -.055 | -.074* | -.049 | .027 | -.034 | .061 | -.071* | -.013 | -.029 | .023 | -.044 | .236** | -- | ||||||||||
| 17 Corn chips | .039 | .065* | .102** | .031 | .028 | -.025 | .043 | -.004 | .088** | -.023 | -.057 | -.055 | -.002 | -.003 | .203** | .461** | -- | |||||||||
| 18 Doughnuts | .023 | .059 | .098** | .016 | -.060 | -.067* | .070* | -.026 | .087** | -.052 | .019 | -.051 | .006 | -.052 | .170** | .447** | .478** | -- | ||||||||
| 19 Candy | .013 | .065* | .095** | .007 | -.095** | -.052 | .064* | -.070* | .033 | -.050 | -.044 | -.054 | -.036 | -.045 | .116** | .390** | .454** | .520** | -- | |||||||
| 20 Soda | .009 | .016 | .072* | -.040 | -.079* | -.123** | .058 | -.041 | .041 | -.068* | -.046 | -.022 | -.024 | -.062 | .206** | .414** | .422** | .451** | .468** | -- | ||||||
| Emotion-driven Eating | ||||||||||||||||||||||||||
| 21 Sadness | .114** | .091** | .171** | -.043 | -.061 | .016 | .003 | -.021 | -.008 | -.074* | .066* | -.049 | -.003 | -.081* | -.009 | .101** | .129** | .111** | .121** | .073* | -- | |||||
| 22 Can’t stop | .121** | .062 | .203** | -.076* | -.093** | -.081* | -.001 | -.078* | -.056 | -.134** | -.076* | -.116** | -.127** | -.076* | -.031 | .200** | .238** | .199** | .201** | .151** | .277** | -- | ||||
| 23 Talking easier | .109** | .087** | .110** | -.001 | -.047 | .010 | .038 | -.068* | -.027 | -.105** | .014 | -.012 | -.054 | -.096** | .024 | .204** | .132** | .202** | .158** | .125** | .345** | .270** | -- | |||
| 24 Feel better | .147** | .109** | .136** | -.008 | -.058 | .030 | -.006 | -.045 | .011 | -.046 | -.001 | .016 | -.008 | -.051 | .030 | .108** | .157** | .148** | .108** | .095** | .546** | .320** | .360** | -- | ||
| 25 Family | .095** | .107** | .083** | -.038 | -.024 | -.047 | -.022 | -.016 | .022 | -.057 | -.002 | -.025 | -.044 | -.036 | .018 | .111** | .086** | .190** | .133** | .144** | .260** | .227** | .272** | .263** | -- | |
| 26 Less sad | .138** | .107** | .161** | -.013 | -.045 | .011 | .026 | -.030 | -.018 | -.036 | -.002 | -.035 | .012 | -.031 | -.016 | .084** | .166** | .166** | .110** | .068* | .546** | .318** | .360** | .609** | .233** | -- |
| N | 1000 | 1002 | 998 | 993 | 995 | 996 | 999 | 998 | 996 | 993 | 923 | 975 | 984 | 994 | 967 | 993 | 986 | 978 | 981 | 963 | 1003 | 998 | 1001 | 998 | 1001 | 1000 |
| Mean | 1.69 | 1.86 | 1.74 | 2.24 | 2.13 | 2.26 | 2.05 | 2.14 | 3.71 | 3.62 | 1.95 | 2.70 | 2.68 | 3.23 | 2.23 | 2.37 | 2.71 | 2.22 | 2.45 | 2.22 | 1.34 | 1.45 | 1.18 | 1.42 | 1.20 | 1.29 |
| Std Dev | 0.63 | 0.62 | 0.69 | 0.67 | 0.65 | 0.68 | 0.63 | 0.62 | 1.65 | 1.57 | 1.46 | 1.52 | 1.43 | 1.51 | 1.28 | 1.33 | 1.44 | 1.34 | 1.49 | 1.37 | 0.56 | 0.63 | 0.43 | 0.60 | 0.48 | 0.54 |
| Range | 1-3 | 1-3 | 1-3 | 1-3 | 1-3 | 1-3 | 1-3 | 1-3 | 1-6 | 1-6 | 1-6 | 1-6 | 1-6 | 1-6 | 1-6 | 1-6 | 1-6 | 1-6 | 1-6 | 1-6 | 1-3 | 1-3 | 1-3 | 1-3 | 1-3 | 1-3 |
Correlation is significant at the 0.01 level (2-tailed).
Correlation is significant at the 0.05 level (2-tailed).
Measurement Model
The fit statistics for the measurement model, including all constructs, had acceptable fit; n = 1004, χ2(284) = 551.83, p < 0.001, CFI = .95, RMSEA = 0.04, p = 1.00. Based on the Lagrange Multiplier Test and residual correlations, “eating potatoes” was allowed to load on both the HCLN and fruit/vegetable factors; and residuals were allowed to correlate between fruit and fruit juice, and among perceived helplessness items. With these modifications, the measurement model had a good fit except for the chi-square test, which was significant due to the large sample size, n = 1004, χ2(284) = 551.830, p < 0.001, CFI = .95, TLI = .94, RMSEA = .03, p = 1.00. Factor loadings for the final measurement model are displayed in Table 3.
Structural model
To create the structural model, hypothesized effects between latent variables were added to the modified measurement model as shown in Figure 1. Direct effects were hypothesized from both facets of stress to fruit/vegetable and HCLN intake. Indirect effects were hypothesized from each facet of stress through emotion-driven eating to dietary intake. Model fit statistics indicated good fit, n = 978, χ2(347) = 659.930, p < 0.001, CFI = 0.940, TLI = 0.930, RMSEA = 0.030, p = 1.00. In line with hypotheses, there was a significant direct effect of stress-SE on FV intake, β = .354, p < 0.001, and a specific indirect effect of stress-PH on HCLN intake through emotion-driven eating, indirect effect = .094, p < 0.001. Contrary to hypotheses, the direct effect of stress-PH on HCLN intake was not significant, nor was the indirect effect of stress-SE on FV intake through emotion-driven eating. Hispanic ethnicity was associated with higher self-reported consumption of both fruits/vegetables (β = .102, p = .008) and HCLN foods (β = .123, p = .001) but not emotion-driven eating (β = -.017, p = .625). BMI z-score and program group were not significantly associated with these latent variables.
Figure 1. Standardized Estimates for Direct and Indirect Effects of Stress Self-efficacy and Stress Perceived Helplessness on HCLN and Fruit/Vegetable intake through Emotion-driven Eating in Adolescents.
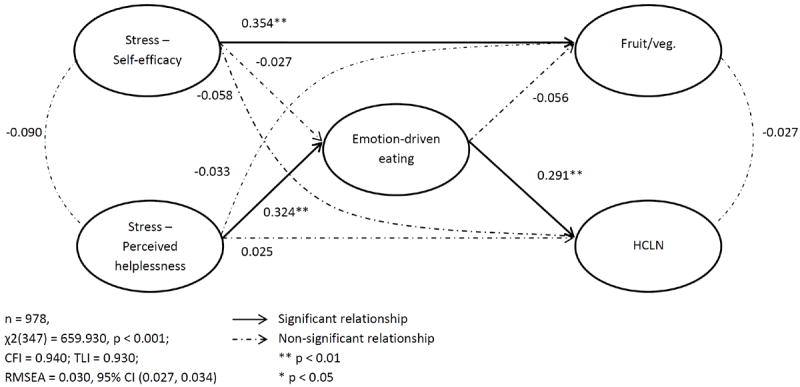
Note: HCLN = High calorie/low nutrient food intake; Model adjusts for child gender, Hispanic ethnicity, BMI z-score, and group
Discussion
These results suggest that adolescents who feel confident about their ability to handle stress eat more fruits and vegetables, yet those who feel helpless to manage stressors engage in more emotion-driven eating and report more frequent consumption of high-calorie/low-nutrient foods. Although many researchers use a summary score from the Perceived Stress Scale to examine effects on eating behavior, (e.x., Austin et al., 2009; Barrington, Ceballos, Bishop, McGregor, & Beresford, 2012; Chen et al., 2012) combining the two facets of stress may mask important relationships. This study extends prior knowledge in at least three ways. First, separating stress into two factors (i.e., perceived self-efficacy and helplessness for handling stress) revealed distinct direct effects on self-reported dietary intake. Specifically, self-efficacy had a positive effect on higher fruit and vegetable intake, whereas—contrary to hypotheses— perceived helplessness was not directly related to self-reported consumption of either food type. Conflicting results have emerged from prior research, with some studies finding stress associated with lower fruit/vegetable intake (Michels et al., 2012) and others finding no association with healthy food intake (Austin et al., 2009; Markus et al., 2012; Michels et al., 2012). Previous studies have used a variety of stress measures, from salivary cortisol to stressful life events. The one study using the Perceived Stress Scale to investigate healthy food intake found no significant relationship, but stress was considered a uni-dimensional measure (Austin et al., 2009). Thus, our findings suggest that researchers investigating perceived stress consider separating the scale into two facets. The surprising lack of association between HCLN foods and higher stress may have been due to using subjective measures (i.e., Perceived Stress Scale) versus objective (ex., cortisol, trier stress test, life events). One possibility is that stress biomarker reactivity or acute stress reactions shares a biochemical pathway that also affects appetite, but past week’s perceived stress does not work via this mechanism. Indeed, one review found insufficient evidence that subjective and objective measures of stress are associated (Hjortskov, Garde, Orbaek, & Hansen, 2004). Another possibility is that learned helplessness prevents adolescents from acting on knowledge of healthy foods to make corresponding consumption choices (Hansen & Thomsen, 2013), and potentially such dissonance prompts eating as a coping strategy. However, future research would need to be conducted to test these possibilities.
Second, this study begins to clarify previous discrepancies in emotion-driven eating research – namely, whether or not emotion-driven eating mediates between stress and healthy dietary components. Michels et al., (2012) tested three types of stressors and found that emotional eating did not mediate effects on sweet or fatty foods, or fruit/vegetable intake, though stress was associated with both emotional eating and dietary intake separately. In contrast, the current results show that one facet of stress (perceived helplessness) was associated with increased unhealthy food intake via emotion-driven eating but had no direct effect; and another (self-efficacy) was directly associated with fruit/vegetable intake but had no indirect effect. Separating the two facets of stress may provide greater specificity and allow detection of mediating effects.
Third, this study is among the first to examine these questions outside of a laboratory setting in a sample of youth (i.e., fourth-grade) with a high proportion of Hispanic children. Until now, little investigation has been conducted in Hispanic youth on the effects of stress on diet, yet obesity risk is higher for this group (Lutfiyya et al., 2008). In this sample, Hispanic adolescents reported more frequent consumption of both fruits/vegetables and HCLN foods, but not higher emotion-driven eating. This finding could reflect higher cultural value placed on food, or a higher rate of obesity affecting underreporting of food intake (Bothwell et al., 2009; Lissner, 2002). However, BMI z-score was unrelated to food outcomes the current study. While self-reported food frequency questionnaires similar to the one in this study have been validated for preschool and adolescent populations, (Parrish, Marshall, Krebs, Rewers, & Norris, 2003; Stein, Shea, Basch, Contento, & Zyberf, 1992) not all studies find that they are significantly related to measures such as 3-day dietary recall (Larson, Harnack, & Neumark-Sztainer, 2012; Wilson & Lewis, 2004). Also, the current analysis did not control for total caloric intake and could indicate that the specific foods included on the questionnaire were more frequently eaten in Hispanic families. Thus, this finding should be interpreted with caution.
Study results should be considered in light of limitations. First, due to survey length limitations, only eight items from the Perceived Stress Scale were used, in contrast to the typical ten item scale (Cohen et al., 1983; Lee, 2012). While a shorter, four-item scale has been validated for use as a measure of stress, (Cohen et al., 1983) internal consistency reliability of the four item index tends to be low (Lee, 2012). Whether the ten item scale would have had different associations remains unknown. Second, the study only investigated perceived stress, rather than biological markers of stress reactivity, such as cortisol. Both behavioral and biological mechanisms may underlie the stress/obesity link; thus, their interaction should be investigated in future research (Pervanidou & Chrousos, 2011). Third, while the food intake measures included have been successfully used in previous research, (Riggs, Mesirov, Shin, & Pentz, 2009) they only assess a limited range of foods and in-depth surveys such as 3-day 24- hour multiple pass recall could allow greater precision in determining how specific dietary nutrient profiles relate to stress (Burrows, Martin, & Collins, 2010). Fourth, while the proposed model fit the data well, these cross-sectional associations do not justify a causal interpretation. However, evidence from rat models suggests that experimental induction of stress decreases consumption of regular food (i.e., chow) (Martí, Martí, & Armario, 1994; Vallès, Martí, García, & Armario, 2000) and can increase consumption of highly palatable food (ex., sweetened condensed milk) (Hagan, Chandler, Wauford, Rybak, & Oswald, 2003; Hagan et al., 2002). Thus, there is experimental support for a causal role of stress, but longitudinal work in human populations is needed to help clarify causal pathways.
Implications for Research and Practice
Obesity prevention programs may consider including stress management training as an approach for improving child diet. Boosting children’s self-efficacy to cope with stressors may have more beneficial effects on dietary profiles than dampening helplessness stress responses. Also, teaching awareness of emotional arousal and alternative coping strategies may be effective for breaking harmful links between stressful experiences and dietary intake. Thus, future research could examine potential dietary changes in children who receive such training. Health practitioners who work with children experiencing stress may consider inquiring about food intake, helping to ensure that healthy foods are not crowded out of the diet by high-calorie/lownutrient snacks.
Highlights.
Two facets of perceived stress should be considered when studying diet in youth.
Self-efficacy for stress management predicted higher fruit and vegetable intake.
Perceived helplessness indirectly affected unhealthy snack food intake.
Acknowledgments
National Institutes of Health Cancer Control and Epidemiology Research Training Grant 5 T32 CA 009492; National Cancer Institute #R01-CA-123243 (Pentz, PI)
Role of Funding Sources
Funding for this study was provided by National Institutes of Health Cancer Control and Epidemiology Research Training Grant 5 T32 CA 009492; National Cancer Institute #R01-CA-123243 (Pentz, PI). NIH had no role in the study design, collection, analysis or interpretation of the data, writing the manuscript, or the decision to submit the paper for publication.
Footnotes
Contributors
Eleanor B. Tate, Donna Spruijt-Metz, and Mary Ann Pentz designed the study. Eleanor B. Tate wrote the first draft. Trevor A. Pickering completed the statistical analysis. All authors contributed to and have approved the final manuscript.
Conflict of Interest
The authors declare no conflicts of interest.
Publisher's Disclaimer: This is a PDF file of an unedited manuscript that has been accepted for publication. As a service to our customers we are providing this early version of the manuscript. The manuscript will undergo copyediting, typesetting, and review of the resulting proof before it is published in its final citable form. Please note that during the production process errors may be discovered which could affect the content, and all legal disclaimers that apply to the journal pertain.
References
- Andreou E, Alexopoulos EC, Lionis C, Varvogli L, Gnardellis C, Chrousos GP, Darviri C. Perceived stress scale: reliability and validity study in Greece. International journal of environmental research and public health. 2011;8(8):3287–3298. doi: 10.3390/ijerph8083287. [DOI] [PMC free article] [PubMed] [Google Scholar]
- Austin AW, Smith AE, Patterson SM. Stress and dietary quality in black adolescents in a metropolitan area. Stress and Health. 2009;25(2):171–178. doi: 10.1002/smi.1234. [DOI] [Google Scholar]
- Barlow SE, Dietz WH. Obesity evaluation and treatment: Expert committee recommendations. Pediatrics. 1998;102(3) doi: 10.1542/peds.102.3.e29. [DOI] [PubMed] [Google Scholar]
- Barrington WE, Ceballos RM, Bishop SK, McGregor BA, Beresford SAA. Perceived Stress, Behavior, and Body Mass Index Among Adults Participating in a Worksite Obesity Prevention Program, Seattle, 2005-2007. Preventing Chronic Disease. 2012;9 doi: 10.5888/pcd9.120001. [DOI] [PMC free article] [PubMed] [Google Scholar]
- Biro FM, Wien M. Childhood obesity and adult morbidities. American Journal of Clinical Nutrition. 2010;91(5):1499S–1505S. doi: 10.3945/ajcn.2010.28701B. [DOI] [PMC free article] [PubMed] [Google Scholar]
- Bothwell EKG, Ayala GX, Conway TL, Rock CL, Gallo LC, Elder JP. Underreporting of Food Intake among Mexican/Mexican-American Women: Rates and Correlates. Journal of the American Dietetic Association. 2009;109(4):624–632. doi: 10.1016/j.jada.2008.12.013. [DOI] [PMC free article] [PubMed] [Google Scholar]
- Burrows TL, Martin RJ, Collins CE. A systematic review of the validity of dietary assessment methods in children when compared with the method of doubly labeled water. Journal of the American Dietetic Association. 2010;110(10):1501–1510. doi: 10.1016/j.jada.2010.07.008. [DOI] [PubMed] [Google Scholar]
- CDC. 2000 CDC Growth Charts for the United States: Methods and Development Vital and Health Statistics, Number 11. Vol. 246. Department of Health and Human Services; 2002. [PubMed] [Google Scholar]
- Chen J, Wang Z, Guo BL, Arcelus J, Zhang HY, Jia XZ, Yang M, et al. Negative affect mediates effects of psychological stress on disordered eating in young Chinese women. Plos One. 2012;7(10) doi: 10.1371/journal.pone.0046878. [DOI] [PMC free article] [PubMed] [Google Scholar]
- Cohen S, Kamarck T, Mermelstein R. A GLOBAL MEASURE OF PERCEIVED STRESS. Journal of Health and Social Behavior. 1983;24(4):385–396. doi: 10.2307/2136404. [DOI] [PubMed] [Google Scholar]
- Ebbeling CB, Pawlak DB, Ludwig DS. Childhood obesity: public-health crisis, common sense cure. Lancet. 2002;360(9331):473–482. doi: 10.1016/s0140-6736(02)09678-2. [DOI] [PubMed] [Google Scholar]
- Gortmaker SL, Peterson K, Wiecha J, Sobol AM, Dixit S, Fox MK, Laird N. Reducing obesity via a school-based interdisciplinary intervention among youth: Planet Health. Archives of pediatrics & adolescent medicine. 1999;153(4):409–418. doi: 10.1001/archpedi.153.4.409. [DOI] [PubMed] [Google Scholar]
- Hagan MM, Chandler PC, Wauford PK, Rybak RJ, Oswald KD. The role of palatable food and hunger as trigger factors in an animal model of stress induced binge eating. International Journal of Eating Disorders. 2003;34(2):183–197. doi: 10.1002/eat.10168. [DOI] [PubMed] [Google Scholar]
- Hagan MM, Wauford PK, Chandler PC, Jarrett LA, Rybak RJ, Blackburn K. A new animal model of binge eating: Key synergistic role of past caloric restriction and stress. Physiology & Behavior. 2002;77(1):45–54. doi: 10.1016/s0031-9384(02)00809-0. [DOI] [PubMed] [Google Scholar]
- Hansen T, Thomsen TU. I Know What I Know, but I will Probably Fail Anyway: How Learned Helplessness Moderates the Knowledge Calibration-Dietary Choice Quality Relationship. Psychology & Marketing. 2013;30(11):1008–1028. doi: 10.1002/mar.20663. [DOI] [Google Scholar]
- Hemmingsson E. A new model of the role of psychological and emotional distress in promoting obesity: conceptual review with implications for treatment and prevention. Obesity Reviews. 2014;15(9):769–779. doi: 10.1111/obr.12197. [DOI] [PubMed] [Google Scholar]
- Hjortskov N, Garde AH, Orbaek P, Hansen AM. Evaluation of salivary cortisol as a biomarker of self-reported mental stress in field studies. Stress and Health. 2004;20(2):91–98. doi: 10.1002/smi.1000. [DOI] [Google Scholar]
- Hou FL, Xu SJ, Zhao YQ, Lu QY, Zhang SC, Zu P, Tao FB, et al. Effects of emotional symptoms and life stress on eating behaviors among adolescents. Appetite. 2013;68:63–68. doi: 10.1016/j.appet.2013.04.010. [DOI] [PubMed] [Google Scholar]
- Kubiak T, Vogele C, Siering M, Schiel R, Weber H. Daily hassles and emotional eating in obese adolescents under restricted dietary conditions - The role of ruminative thinking. Appetite. 2008;51(1):206–209. doi: 10.1016/j.appet.2008.01.008. [DOI] [PubMed] [Google Scholar]
- Larson N, Harnack L, Neumark-Sztainer D. Assessing dietary intake during the transition to adulthood: a comparison of age-appropriate FFQ for youth/adolescents and adults. Public Health Nutrition. 2012;15(4):627–634. doi: 10.1017/s136898001100228x. [DOI] [PMC free article] [PubMed] [Google Scholar]
- Lee E-H. Review of the Psychometric Evidence of the Perceived Stress Scale. Asian Nursing Research. 2012;6(4):121–127. doi: 10.1016/j.anr.2012.08.004. [DOI] [PubMed] [Google Scholar]
- Lissner L. Measuring food intake in studies of obesity. Public Health Nutrition. 2002;5(6A):889–892. doi: 10.1079/phn2002388. [DOI] [PubMed] [Google Scholar]
- Lutfiyya MN, Garcia R, Dankwa CM, Young T, Lipsky MS. Overweight and obese prevalence rates in African American and Hispanic children: An analysis of data from the 2003-2004 National Survey of Children’s Health. Journal of the American Board of Family Medicine. 2008;21(3):191–199. doi: 10.3122/jabfm.2008.03.070207. [DOI] [PubMed] [Google Scholar]
- Markus CR, Verschoor E, Smeets T. Differential effect of the 5-HTT gene-linked polymorphic region on emotional eating during stress exposure following tryptophan challenge. Journal of Nutritional Biochemistry. 2012;23(4):410–416. doi: 10.1016/j.jnutbio.2011.01.005. [DOI] [PubMed] [Google Scholar]
- Martí O, Martí J, Armario A. Effects of chronic stress on food intake in rats: influence of stressor intensity and duration of daily exposure. Physiology & behavior. 1994;55(4):747–753. doi: 10.1016/0031-9384(94)90055-8. [DOI] [PubMed] [Google Scholar]
- Michels N, Sioen I, Braet C, Eiben G, Hebestreit A, Huybrechts I, De Henauw S, et al. Stress, emotional eating behaviour and dietary patterns in children. Appetite. 2012;59(3):762–769. doi: 10.1016/j.appet.2012.08.010. [DOI] [PubMed] [Google Scholar]
- Michels N, Sioen I, Braet C, Huybrechts I, Vanaelst B, Wolters M, De Henauw S. Relation between salivary cortisol as stress biomarker and dietary pattern in children. Psychoneuroendocrinology. 2013;38(9):1512–1520. doi: 10.1016/j.psyneuen.2012.12.020. [DOI] [PubMed] [Google Scholar]
- Nguyen-Michel ST, Unger JB, Spruijt-Metz D. Dietary correlates of emotional eating in adolescence. Appetite. 2007;49(2):494–499. doi: 10.1016/j.appet.2007.03.005. [DOI] [PMC free article] [PubMed] [Google Scholar]
- Nguyen-Rodriguez ST, Chou C-P, Unger JB, Spruijt-Metz D. BMI as a moderator of perceived stress and emotional eating in adolescents. Eating behaviors. 2008;9(2):238–246. doi: 10.1016/j.eatbeh.2007.09.001. [DOI] [PMC free article] [PubMed] [Google Scholar]
- Parrish LA, Marshall JA, Krebs NF, Rewers M, Norris JM. Validation of a food frequency questionnaire in preschool children. Epidemiology. 2003;14(2):213–217. doi: 10.1097/01.EDE.0000041256.12192.23. [DOI] [PubMed] [Google Scholar]
- Pentz MA, Riggs NR. Longitudinal Relationships of Executive Cognitive Function and Parent Influence to Child Substance Use and Physical Activity. Prevention Science. 2012;14(3):229–237. doi: 10.1007/s11121-012-0312-3. [DOI] [PubMed] [Google Scholar]
- Pentz MA, Spruijt-Metz D, Chou CP, Riggs NR. High Calorie, Low Nutrient Food/Beverage Intake and Video Gaming in Children as Potential Signals for Addictive Behavior. International Journal of Environmental Research and Public Health. 2011;8(12):4406–4424. doi: 10.3390/ijerph8124406. [DOI] [PMC free article] [PubMed] [Google Scholar]
- Pervanidou P, Chrousos GP. Stress and obesity/metabolic syndrome in childhood and adolescence. International Journal of Pediatric Obesity. 2011;6:21–28. doi: 10.3109/17477166.2011.615996. [DOI] [PubMed] [Google Scholar]
- Riggs N, Sakuma K, Pentz M. Preventing risk for obesity by promoting self-regulation and decision-making skills: Pilot results from the PATHWAYS to health program (PATHWAYS) Evaluation Review. 2007;31(3):287–310. doi: 10.1177/0193841x06297243. [DOI] [PubMed] [Google Scholar]
- Riggs NR, Mesirov C, Shin HS, Pentz MA. The Relationship Between Executive Cognitive Function and Food Intake and Physical Activity in Children. Obesity. 2009;17:S212–S212. [Google Scholar]
- Riggs NR, Sakuma K-LK, Pentz MA. Preventing risk for obesity by promoting self-regulation and decision-making skills: Pilot results from the PATHWAYS to health program (PATHWAYS) Evaluation Review. 2007;31(3):287–310. doi: 10.1177/0193841x06297243. [DOI] [PubMed] [Google Scholar]
- Rollins BY, Riggs NR, Spruijt-Metz D, McClain AD, Chou CP, Pentz MA. Psychometrics of the Eating in Emotional Situations Questionnaire (EESQ) among low-income Latino elementary-school children. Eating Behaviors. 2011;12(2):156–159. doi: 10.1016/j.eatbeh.2011.01.004. [DOI] [PMC free article] [PubMed] [Google Scholar]
- Snoek HM, van Strien T, Janssens J, Engels R. The effect of television viewing on adolescents’ snacking: Individual differences explained by external, restrained and emotional eating. Journal of Adolescent Health. 2006;39(3):448–451. doi: 10.1016/j.jadohealth.2005.12.020. [DOI] [PubMed] [Google Scholar]
- Spruijt-Metz D. Adolescence, affect and health. Psychology Press; 1999. [Google Scholar]
- Stein AD, Shea S, Basch CE, Contento IR, Zyberf P. Consistency of the Willett semiquantitative food frequency questionnaire and 24-hour dietary recalls in estimating nutrient intakes of preschool children. American journal of epidemiology. 1992;135(6):667–677. doi: 10.1093/oxfordjournals.aje.a116346. [DOI] [PubMed] [Google Scholar]
- Story M, Nanney MS, Schwartz MB. Schools and obesity prevention: creating school environments and policies to promote healthy eating and physical activity. Milbank Quarterly. 2009;87(1):71–100. doi: 10.1111/j.1468-0009.2009.00548.x. [DOI] [PMC free article] [PubMed] [Google Scholar]
- Tryon MS, Carter CS, DeCant R, Laugero KD. Chronic stress exposure may affect the brain’s response to high calorie food cues and predispose to obesogenic eating habits. Physiology & Behavior. 2013;120:233–242. doi: 10.1016/j.physbeh.2013.08.010. [DOI] [PubMed] [Google Scholar]
- Tryon MS, DeCant R, Laugero KD. Having your cake and eating it too: a habit of comfort food may link chronic social stress exposure and acute stress-induced cortisol hyporesponsiveness. Physiology & behavior. 2013;114:32–37. doi: 10.1016/j.physbeh.2013.02.018. [DOI] [PubMed] [Google Scholar]
- Vallès A, Martí O, García A, Armario A. Single exposure to stressors causes long-lasting, stress-dependent reduction of food intake in rats. American Journal of Physiology-Regulatory, Integrative and Comparative Physiology. 2000;279(3):R1138–R1144. doi: 10.1152/ajpregu.2000.279.3.R1138. [DOI] [PubMed] [Google Scholar]
- Wagner DD, Boswell RG, Kelley WM, Heatherton TF. Inducing Negative Affect Increases the Reward Value of Appetizing Foods in Dieters. Journal of Cognitive Neuroscience. 2012;24(7):1625–1633. doi: 10.1162/jocn_a_00238. [DOI] [PMC free article] [PubMed] [Google Scholar]
- Willett WC, Sampson L, Stampfer MJ, Rosner B, Bain C, Witschi J, Speizer FE, et al. Reproducibility and validity of a semiquantitative food frequency questionnaire. American Journal of Epidemiology. 1985;122(1):51–65. doi: 10.1093/oxfordjournals.aje.a114086. [DOI] [PubMed] [Google Scholar]
- Wilson AMR, Lewis RD. Current research: Disagreement of energy and macronutrient intakes estimated from a food frequency questionnaire and a 3-day diet record in girls 4 to 9 years of age. Journal of the American Dietetic Association. 2004;104(3):373–378. doi: 10.1016/j.jada.2003.12.021. [DOI] [PubMed] [Google Scholar]