

Abstract
Objective
Spinal Cord Stimulation (SCS) has become a widely used treatment option for a variety of pain conditions. Substantial variability exists in the degree of benefit obtained from SCS and patient selection is a topic of expanding interest and importance. However, few studies have examined the potential benefits of dynamic Quantitative Sensory Testing (QST) to develop objective measures of SCS outcomes or as a predictive tool to help patient selection. Psychological characteristics have been shown to play an important role in shaping individual differences in the pain experience and may aid in predicting responses to SCS. Static laboratory pain-induction measures have also been examined in their capacity for predicting SCS outcomes.
Methods
The current study evaluated clinical, psychological and laboratory pain measures at baseline, during trial SCS lead placement, as well as one month and three months following permanent SCS implantation in chronic pain patients who received SCS treatment. Several QST measures were conducted, with specific focus on examination of dynamic models (central sensitization and conditioned pain modulation [CPM]) and their association with pain outcomes three months post SCS implantation.
Results
Results suggest few changes in QST over time. However, central sensitization and CPM at baseline were significantly associated with clinical pain at three months following SCS implantation, controlling for psycho/behavioral factors and pain at baseline. Specifically, enhanced central sensitization and reduced CPM were associated with less self-reported pain three months following SCS implantation.
Conclusions
These findings suggest a potentially important role for dynamic pain assessment in individuals undergoing SCS, and hint at potential mechanisms through which SCS may impart its benefit.
Keywords: Spinal Cord Stimulation, Clinical Pain, Laboratory Pain, Quantitative Sensory Testing, Central Sensitization, Conditioned Pain Modulation, Psychosocial Factors
Introduction
Spinal Cord Stimulation (SCS) is becoming a widely used treatment for a number of pain conditions including complex regional pain syndrome (CRPS), failed back surgery syndrome, postherpetic neuralgia, traumatic nerve injury, refractory angina pectoris, peripheral vascular disease, neuropathic pain and visceral pain (1). The mechanisms of action underlying SCS effects remain poorly understood (2;3). A few hypothesized mechanisms include a potential gating effect of incoming nociceptive stimuli in the dorsal horn of the spinal cord, and activation of descending pain inhibitory pathways via supraspinal mechanisms (4;5). Our recent neurophysiological studies indicate that a conditioning stimulus mimicking SCS to the dorsal column or dorsal roots results in attenuation of the windup response of lumbar dorsal horn neurons to repeated electrical stimulation in rats with a spinal nerve ligation-induced neuropathic pain (6).
Many non-human animal studies have examined potential mechanisms for the success of SCS, though few have been translated to humans. One such study found preliminary evidence for using Quantitative Sensory Testing (QST), psychophysical testing by administration of controlled stimuli to examine sensory perception, procedures to assist clinicians in selecting patients for permanent stimulation (7). Another study assessed QST responses, both during active SCS and with the device turned off (8). Their results suggest that some physiological parameters may return to normal processing during stimulation. Few human studies to date have assessed CNS plasticity or dynamic quantitative sensory testing measures, which are thought to assess the integrity of central pain processing mechanisms and the efficiency of descending systems that may work on the same systems/influence the effects of SCS.
Temporal summation (TS) of pain, an index of central pain processing and a human-based analogue of “wind-up”, is thought to be mediated by NMDA receptor activity at dorsal horn sensory neurons (9). TS along with after-sensations of pain rated following such testing are thought to reflect central sensitization. Central sensitization (CS), a hyper-excitability in nociceptive pathways, has been theorized as a culprit in many pain conditions. Conditioned pain modulation (CPM), or the phenomenon of pain inhibiting pain, exerts both inhibitory and facilitatory modulation on incoming nociception and is thought to capture the strength or “tone” of the descending pain system. Recent evidence suggests that these dynamic measures may be more useful than static measures in predicting outcomes of relevant interventions (10). The goals of the current open label, observational pilot study were to assess how SCS affects sensory processing in patients with chronic pain, and examine whether dynamic QST models are altered over time with SCS and/or are associated with pain three months following SCS placement.
Methods
Participants
All study-related procedures were approved by the Johns Hopkins Hospital Institutional Review Board. SCS patients were recruited for participation from the Blaustein Pain Treatment Center at Johns Hopkins Hospital through posted advertisements and physician referral. Verbal and written informed consent was obtained upon arrival for visit 1, after which participants underwent the assessment procedures described below. Only patients that would be receiving a Medtronic device were included in this study. The total study sample included 24 patients. Participants had varying pain conditions, all suitable for treatment using SCS (see Table 1). Participants were asked to avoid altering their medication regimens while enrolled in the study. Major inclusion criteria included age ≥18 years and suspected neuropathic pain in the distal lower extremities. Exclusion criteria included current alcohol or substance abuse/dependence; delirium, dementia, or cognitive impairment; and psychological/psychiatric conditions contraindicated to SCS implantation (as assessed and recommended by the SCS team psychologist). Participants provided verbal pain ratings [0–10 scale] to their physician at each clinic visit and were split into “Trial Responders” and “Trial Non-Responders” (based on > or <50% pain relief attributed to SCS trial). Six participants experienced an unsuccessful trial period (“Trial Non-Responders”) and were not included beyond the initial two visits. The model, electrode type and SCS parameter settings were recorded for each participant (11). Thirteen participants received a Rechargeable RestoreUltra IPG (37712), five received a Rechargeable RestoreSensor IPG (37714) [one participant received one of each], and one received a Non-Rechargeable RestorePrime Advanced IPG (37702). Twelve participants received one (two in four participants) Octad Lead, 60cm length (3778–60 1×8) and seven received a Surgical Paddle, 65cm length (39565–65 565) [the participant with two systems received two leads and one paddle]. One person was followed outside of our system and we were not able to capture this information on them.
Table 1.
Demographics characteristics by group
| Demographic Variable | Trial Non-Responder | Trial Responder | p-value |
|---|---|---|---|
|
| |||
| N | 6 | 18 | |
|
| |||
| Sex (% women) | 3 (50%) | 11 (61.1%) | 0.67 |
|
| |||
| Race (% Caucasian) | 3 (50%) | 13 (72.2%) | 0.36 |
|
| |||
| Age Mean (SD) | 63.3 (14.1) | 51.56 (13.3) | 0.08† |
| Range | 39–81 | 21–74 | |
|
| |||
| BMI Mean (SD) | 26.46 (3.70) | 29.27 (6.87) | 0.35 |
|
| |||
| Education, n (%) | |||
| High School/GED | 1 (16.7%) | 3 (16.7%) | 0.94 |
| Some College/Tech School | 2 (33.3%) | 9 (50%) | |
| College/Post College Education | 3 (50%) | 6 (33.3%) | |
|
| |||
| Employment Status, n (%) | |||
| Working Full or Part Time | 2 (33.3%) | 6 (33.3%) | 0.02€* |
| Homemaker | 0 | 3 (16.7%) | |
| Retired | 4 (66.7%) | 1 (5.6%) | |
| Unemployed | 0 | 8 (44.4%) | |
|
| |||
| Marital Status, n (%) | |||
| Married | 5 (83.3%) | 12 (66.7%) | 0.76 |
| Single | 1 (16.7%) | 3 (16.7%) | |
| Separated/Divorced | 0 | 3 (16.7%) | |
|
| |||
| Pain Duration (years) | 12.5 (14.59) | 5.53 (4.00) | 0.07† |
|
| |||
| Verbal Pain Rating (provided to physician by participant) | |||
| Visit 1 | 7.33 (2.42)¥* | 7.83 (.86)€† | 0.45 |
| Visit 2 | 5.33 (1.37) | 2.67 (1.19)₰* | <0.001€* |
| Visit 3 | 3.45 (1.97) ₰* | ||
| Visit 4 | 4.89 (2.52) ₰* | ||
|
| |||
| Diagnosis, n (%) | |||
| Failed Back Surgery Syndrome | 2 (33.3%) | 12 (66.7%) | 0.41 |
| Low Back Pain | 2 (33.3%) | 2 (11.1%) | |
| Lower Extremity Pain | 1 (16.7%) | 1 (5.6%) | |
| Complex Regional Pain Syndrome | 1 (16.7%) | 3 (16.7%) | |
p < 0.05;
p < 0.10.
for Group by Time Interaction;
for Group effect;
indicates different from baseline
Study procedures
Patients identified and approved to undergo trial SCS participated in two or four experimental sessions, based on their success of the trial (defined as ≥ 50% reduction in pain from the trial stimulator). In each session, participants completed brief self-report psychological questionnaires and the sensory testing procedures described below. Participants were instructed to keep their devices turned off for the duration of each visit. The visits included a baseline session (prior to SCS trial), a session during the SCS trial (prior to removal of the trial leads), and for patients undergoing permanent SCS placement, additional visits occurred at one month and three months post implantation.
Questionnaires
The Brief Pain Inventory includes two primary dimensions: pain severity and pain interference (12). The Beck Depression Inventory (BDI) assesses the frequency and severity of a variety of cognitive, affective, physiological, and motivational symptoms of depression (13). The standard Pain Catastrophizing Scale (PCS (14)) assesses cognitive-emotional dimensions on three subscales including helplessness, rumination, and magnification. Patient-Reported-Outcomes Measurement Information System (PROMIS) short form questionnaires were used to briefly assess sleep disturbance.
Psychophysical Pain Testing
Participants were administered a multimodal assessment of sensory tests to characterize static and dynamic pain responses. The testing battery included assessment of allodynia, pain thresholds, temporal summation, cold pressor and conditioned pain modulation. Several of these tests were conducted both at “affected” (the foot) and “unaffected” (the forearm) anatomic sites.
Area of allodynia/hyperalgesia
The area of dynamic mechanical allodynia was stimulated at and surrounding the area described by the participant using a 0.5 inch medium stroke paint brush. The area was marked and paint brush was used at a 45° angle in the center and at 4 radial arms surrounding the area. Pain from the brush strokes were rated on a 0–100 scale (0=No pain and 100=Most Intense Pain Imaginable).
Pain Threshold Testing
Pressure Pain
An electronic algometer (Somedic) with a 1cm2 hard rubber probe was used to assess responses to noxious mechanical pressure (15). Pressure was increased steadily at a constant rate (30kPA/S), until the subject indicated that the stimulus “first feels painful”. Pressure pain thresholds (PPThs) were assessed two times each at the thumb and toe (in randomized order). Thermal Pain. The MEDOC PATHWAY system (Israel) was used to conduct two trials each of heat pain threshold and tolerance administered to the arm and foot using an ascending method of limits paradigm. On each trial, the thermode gradually increases in temperature (.5°C/sec) from a pre-set baseline (31°C), until the subject indicated when the stimulus “first feels painful” (threshold) or when the stimulus “becomes intolerable” (tolerance) by pressing a button.
Temporal Summation (TS)
Temporal summation of pain was assessed using repetitive thermal and mechanical stimuli. For thermal TS, two sequences of 10 heat pulses (0.5 sec each, with a 2.5-sec inter-pulse interval, 70°C / S rate of rise/fall) were applied to the unaffected and affected extremity (16). The stimulus temperatures of the sequences were tailored to each participant based on the temperature of their heat pain threshold (+2 or +4°C) at baseline. Participants verbally rated the perceived intensity of each thermal pulse on the 0–100 rating scale. Temporal summation of thermal pain was calculated as the percent ratio of the highest-rated thermal stimuli and the first thermal stimulus in a sequence * 100. One additional pain rating was obtained 15 seconds following the final pulse in each temperature train in order to characterize after sensations. For mechanical TS, a weighted pinprick stimulator with a flat contact area (that does not break the skin) of 0.2 mm diameter and a force of 64 and 128 mN were used to deliver, either a single pinprick stimulus or a train of 10 pinprick stimuli repeated at a 1/s rate (within a small area of 1 cm2) to the affected and unaffected sites. Participants provided a 0–100 pain rating following the single pinprick and were instructed to rate the “peak pain” experienced during the train of stimuli. A MTS index score was calculated ((rating following the train of 10 stimuli / rating of the initial stimulus)) * 100) for each probe weight (17) and averaged together for each site. Similar procedures assessing responses to repetitive suprathreshold noxious stimuli as an index of central sensitization have been previously employed in a variety of subjects (18;19). Temporal summation and after sensation z-scores were z-scored separately as previously described (20), where higher values represent greater sensitivity to create one measure of central sensitization (21).
Cold Pressor
Pain ratings were additionally assessed using cold pressor testing (CPT). Participants immersed the non-dominant hand in a circulating water bath (to prevent local warming around the submerged hand; Neslab, Portsmouth, NH) maintained at 4°C. A total of 4 immersions lasting a maximum of 45 seconds were conducted. Participants were permitted to remove their hand prior to the completion of the trial if the pain became intolerable. Pain ratings on a 0–100 scale were obtained at 20 seconds, and participants removed their hand from the water bath, and (in order to characterize after sensations) additionally at 30 seconds, 1 minute and 2 minutes post hand removal. Pain ratings were averaged across the four trials.
Conditioned Pain Modulation (CPM)
CPM refers to the phenomenon of one noxious stimulus inhibiting the perception of a second noxious stimulus to a distal body sight (22;23). This terminology is used, instead of the more familiar ‘Diffuse Noxious Inhibitory Controls’ (DNIC), used in non-human animal-based research to describe specific and measurable inhibitory mechanisms, due to recent recommendations (24). Following the determination of baseline pressure pain threshold (×2) on both the affected and unaffected extremity, participants underwent a series of cold pressor tasks, described above, similar to previous CPM studies (25). Twenty seconds after commencing hand immersion, pressure pain thresholds were re-assessed on either the affected or unaffected site (i.e., site order was randomized). Each immersion lasted for a maximum of 45 s, enough time to complete the concurrent pain threshold assessment procedure on the affected or unaffected extremity. Participants underwent a total of 4 CPM trials, two pressure pain thresholds at each site. A CPM index was created by calculating the percent ratio of PPThs during CPTs to PPThs prior to CPTs (i.e., mean PPThs during CPTs / mean PPThs prior to CPTs) × 100)(26;27).
Data Analysis
All analyses were conducted using SPSS 20. Chi-Square tests were used to compare categorical demographic variables between the two participant groups (responders vs. non-responders). A series of Analyses of Variance (ANOVAs) was conducted in order to examine group differences in questionnaires over the visits. Due to our small sample size, we have not conducted statistical analyses between groups or over time on most of our QST measures, we present them descriptively only. However, thermal temporal summation was analyzed via use of the ratio score and using RM-ANOVAs to fully capture alterations over time and by group in this measure. No imputation method was used for missing data, thus, only individuals that had complete data were included in this analysis. The sample size included for each variable is noted within each table.
Pain testing measures thought to reflect central sensitization (CSS were z-scored and combined to create an index. The CS measure included thermal and mechanical temporal summation, and after sensations to thermal temporal summation and cold water hand immersion. This was conducted in order to create one measure of central sensitization and avoid multiple comparisons (using each QST measure reflective of CS in the model). A hierarchical linear regression was performed to examine the association of CPM and CS at baseline with three month clinical pain ratings. To examine the relationship between these variables of interest, Pearson bivariate correlations were conducted to examine the associations between variables in our regression model. Baseline pain and several questionnaire measures representing constructs important to pain-related outcomes (depression, catastrophizing and sleep disturbance) were statistically controlled by regressing them on pain at three months, calculating a standardized residual (28). The residual characterizes pain at three months controlling for these variables, and was used as the dependent variable in the regression. Demographic variables were not associated with clinical pain at follow-up and thus not included in the regression model. A hierarchical linear regression model was used to examine the relative contribution of CPM and the Z-scored CS measure in the prediction of the standardized residual pain report at three month follow-up.
Results
Successful vs. Unsuccessful Groups
Fifty-four individuals were approached regarding participation, 47 of which displayed interest and were screened for eligibility. Thirty-three participants met eligibility criteria; seven declined to participate and two were un-reachable to schedule. The total study sample included 24 participants. Patient demographics, clinical characteristics at baseline, summary questionnaire data and other variables of interest are presented in Tables 1 and 2. Participants in the unsuccessful trial group were not significantly different from the larger group in any demographic categories with the exception of employment status, those in the Trial Responder group were more likely to endorse being unemployed. Pain duration was over twice as long in the unsuccessful group, although this was nonsignificant. While not significant, patients were over ten years younger in the Trial Responder group. Verbal pain ratings provided by the patient to their physician significantly reduced (overall) from baseline to visit two (p < 0.001) and, as expected, an interaction between Trial Non-Responders and Trial Responders was observed (p < 0.001), with Trial Non-Responders experiencing reduced efficacy of trial stimulation when compared to Trial Responders. No significant differences between stimulator model or lead type was observed. Overall, the pulse width ranged from 270–510, the rate ranged from 40–110 and the amplitude ranged from 0–10.5.
Table 2.
Means and standard deviations for questionnaires by group.
| Questionnaire (Trial Non-Responder n, Trial Responder n) | Trial Non-Responder | Trial Responder |
|---|---|---|
|
| ||
| BPI Severity | ||
| Visit 1 (6,18) | 7.37 (1.4) | 7.31 (1.4) |
| Visit 2 (5,15) | 6 (2.6) | 4.86 (2.2)* |
| Visit 3 (0,13) | 5.36 (2.2)* | |
| Visit 4 (0,13) | 5.24 (1.6)* | |
|
| ||
| BPI Interference | ||
| Visit 1 (6,18) | 6.14 (3.0)¥* | 7.31 (1.4)* |
| Visit 2 (5,15) | 6.22 (3.0) | 4.64 (3.4) |
| Visit 3 (0,13) | 4.9 (2.8) | |
| Visit 4 (0,13) | 6.18 (2.1) | |
|
| ||
| PROMIS Sleep Disturbance | ||
| Visit 1 (6,18) | 27.58 (11.7) | 32.05 (6.1)† |
| Visit 2 (5,15) | 29.2 (11.5) | 26.26 (9.7) |
| Visit 3 (0,13) | 30.46 (8.6) | |
| Visit 4 (0,13) | 32.42 (5.3) | |
|
| ||
| BDI | ||
| Visit 1 (6,18) | 12.16 (6.3) | 15.27 (8.1) |
| Visit 2 (5,15) | 8.11 (3.1) | 12.62 (9.6) |
| Visit 3 (0,13) | 13.26 (10.0) | |
| Visit 4 (0,13) | 15.6 (9.1) | |
|
| ||
| PCS | ||
| Visit 1 (6,18) | 23.0 (18.8) | 24.5 (12.4) |
| Visit 2 (5,15) | 17.4 (17.7) | 20.06 (13.8) |
| Visit 3 (0,13) | 19.23 (12.9) | |
| Visit 4 (0,13) | 19.53 (15.9) | |
p < 0.05;
p < 0.10.
for Group by Time Interaction;
BPI: Brief Pain Inventory; Patient-Reported-Outcomes Measurement Information System; BDI: Beck Depression Inventory; PCS: Pain Catastrophizing Scale
Questionnaire Data
The Brief Pain Inventory severity subscale significantly reduced from visit one to visit two over the entire sample (p = 0.003). A group by time interaction emerged for the BPI interference subscale (p = 0.026), with the successful group reporting reduced interference, while the unsuccessful group remained constant. Sleep disturbance (PROMIS: Sleep scale) did not significantly (p = 0.06) improve over time, a trend was noted, though only in the successful group. No group differences emerged for BDI or PCS.
Laboratory pain measures
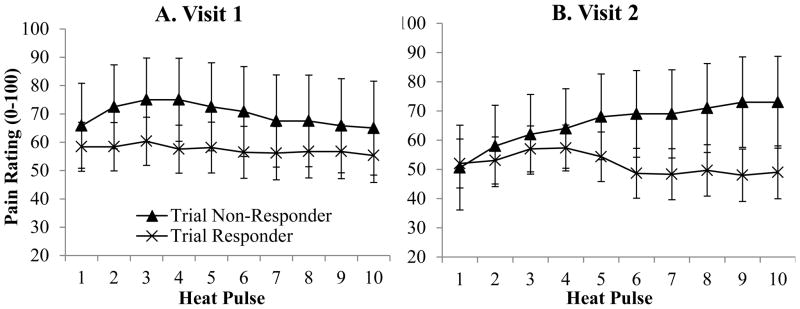
QST measures are presented in Table 3. A location effect was observed for the thermal temporal summation index (p = 0.04) with a higher score reported at the foot. A significant session by slope by group interaction emerged (p = 0.007) with those in the unsuccessful group reporting increased temporal summation at visit two, while those in the successful group reported a slight decrease in pain over the ten pulses at session two. A significant slope was evident (p = 0.03), with an overall increase in slope through the fifth pulse. A non-significant slope by group interaction was noted in thermal temporal summation (p = 0.058), with the unsuccessful group reporting slightly greater temporal summation in general when compared to the successful group. A non-significant visit by location interaction was noted (p = 0.054), with overall pain ratings higher on the arm at session one (Mean = 68.02, SD = 8.1) when compared to session two (Mean = 47.81, SD = 7.7). A graphical presentation of ratings at each pulse on the foot (at Heat Pain Threshold +4 degrees), by group in visits 1 and 2 are presented in Figure 1. No other significant differences were observed between groups for other CS measures or for CPM.
Table 3.
Quantitative Sensory Testing (QST) Measure Means and Standard Deviations by Group
| QST Measures (Measurement Unit) Visit (n) |
Affected Site Mean (SD) | Unaffected Site Mean (SD) | ||
|---|---|---|---|---|
|
| ||||
| Trial Non-Responder | Trial Responder | Trial Non-Responder | Trial Responder | |
| Allodynia (pain rating) | ||||
| Visit 1 (2,10) | 30.83 (43.6) | 39.45 (30.75) | ||
| Visit 2 (2,6) | 26.66 (37.71) | 20.75 (15.87) | ||
| Visit 3 (0,5) | - | 10.5 (16.15) | ||
| Visit 4 (0,5) | - | 5.33 (8.38) | ||
|
| ||||
| Heat Pain Threshold (HPTH) | Foot (Temp) | Arm (Temp) | ||
|
| ||||
| Visit 1 (6,18) | 38.88 (6.18) | 41.94 (3.93) | 38 (4.08) | 41.58 (3.71) |
| Visit 2 (6,15) | 40.96 (3.47) | 40.79 (3.57) | 36.83 (2.68) | 39.06 (3.92) |
| Visit 3 (0,14) | - | 40.52 (4.55) | - | 38.76 (4.08) |
| Visit 4 (0,14) | - | 41.52 (3.99) | - | 39.19 (3.75) |
|
| ||||
| Pressure Threshold | Toe (kPa) | Thumb (kPa) | ||
|
| ||||
| Visit 1 (6,18) | 266.58 (105.37) | 362.38 (165.35) | 201.04 (79.27) | 349.77 (141.63) |
| Visit 2 (6,15) | 301.58 (127.53) | 343.21 (109.95) | 216.75 (67.96) | 325.6 (131.48) |
| Visit 3 (0,14) | - | 344.75 (113.25) | - | 340.55 (131.13) |
| Visit 4 (0,14) | - | 376.28 (188.83) | - | 349.01 (155.56) |
|
| ||||
| MTS (Ave of 64&128mN) | Toe (Ratio) | Finger (Ratio) | ||
|
| ||||
| Visit 1 (5,12) | 370.83 (141.0) | 288.58 (154.2) | 274.75 (265.6) | 229.41 (206.6) |
| Visit 2 (5,12) | 208.33 (190.9) | 376.79 (273.3) | 201.35 (86.0) | 299.93 (264.3) |
| Visit 3 (0,12) | - | 816.92 (1507.3) | - | 267.36 (133.7) |
| Visit 4 (0,7) | - | 369.05 (186.6) | - | 313.21 (131.2) |
|
| ||||
| TTS (Ave HPTH +2 & +4)* | Foot (Ratio) | Arm (Ratio) | ||
|
| ||||
| Visit 1 (6,18) | 168.75 (84.4) | 120.25 (33.1) | 130.35 (38.4) | 121.67 (43.4) |
| Visit 2 (6,13) | 252.80 (248.0) | 136.43 (79.0) | 163.6 (102.8) | 115.47 (18.7) |
| Visit 3 (0,14) | - | 143.05 (47.0) | - | 137.52 (50.3) |
| Visit 4 (0,13) | - | 108.26 (15.4) | - | 131.11 (42.0) |
|
| ||||
| After Sensations, TTS (pain rating. Ave of each temperature) | ||||
| Visit 1 (6,18) | 12.08 (23.67) | 24.47 (26.37) | ||
| Visit 2 (6,13) | 4.79 (10.55) | 12.94 (16.88) | ||
| Visit 3 (0,14) | - | 18.99 (20.3) | ||
| Visit 4 (0,13) | - | 10.67 (16.86) | ||
|
| ||||
| Cold Pressor Pain (CP; pain rating) | ||||
| Visit 1 (6,18) | 82.08 (17.7) | 74.10 (26.4) | ||
| Visit 2 (6,14) | 82.92 (16.7) | 79.59 (18.4) | ||
| Visit 3 (0,13) | - | 80.29 (17.1) | ||
| Visit 4 (0,13) | - | 78.85 (15.0) | ||
|
| ||||
| After Sensations, CP (pain rating) | ||||
| Visit 1 (6,18) | 26.01 (33.75) | 21.59 (19.27) | ||
| Visit 2 (6,14) | 28.47 (28.5) | 18.71 (13.3) | ||
| Visit 3 (0,13) | - | 19.82 (17.6) | ||
| Visit 4 (0,13) | - | 19.48 (18.9) | ||
|
| ||||
| Conditioned Pain Modulation | Toe (Ratio) | Trapezius (Ratio) | ||
|
| ||||
| Visit 1 (6,18) | 107.35 (19.3) | 117.61 (27.3) | 117.6 (15.9) | 117.68 (24.3) |
| Visit 2 (6,14) | 94.35 (25.2) | 128.51 (36.4) | 135.88 (36.3) | 129.68 (32.5) |
| Visit 3 (0,13) | - | 110.99 (20.5) | - | 103.94 (24.5) |
| Visit 4 (0,12) | - | 101.0 (26.9) | - | 121.59 (26.0) |
p < 0.05.
MTS: Mechanical Temporal Summation; TTS: Thermal Temporal Summation; CP: Cold Pressor
Figure 1.

CONSORT, Stimulator and lead type for each patient.
Changes over time in the Successful Group
Questionnaire Data
BPI severity reduced significantly over time (p = 0.007). Specifically, visit 1 was different from all other visits and 2 and 4 were significantly different from each other as well. No differences emerged over time for BPI interference, PROMIS: Sleep disturbance, BDI or PCS.
Laboratory pain measures
A significant effect of visit was observed for TTS (p = 0.049), with a reduction in overall pain ratings over time observed for testing conducted on the arm. Specifically, overall ratings at visit one were significantly higher than for the other three visits. No other significant differences emerged over time; however missing data at visits 3 and 4 severely limited our ability to detect potential differences. A graphical presentation of ratings at each pulse on the foot for each visit (at Heat Pain Threshold +2 degrees) is presented in Figure 2. No other significant differences were observed over time for other CS measures or for CPM.
Figure 2.
Thermal (heat) temporal summation on the foot by visit and group. Panel a shows visit 1; Panel b shows visit 2
Hierarchical linear regression
No demographic variables were associated with the three month follow-up pain standardized residual score and were thus not included in the regression. Correlations between the variables of interest are presented in Table 4. Of note, the correlation coefficients (r) represent moderate to large effect sizes for the association between CPM and CS (independently) with 3 month post SCS clinical pain rating. Hierarchical linear regressions revealed significant associations between CPM and CS with three month clinical pain. Having lower CPM, but greater CS, at baseline was associated with reduced pain ratings at 3 months post SCS implantation (p’s < 0.05; Table 5).
Table 4.
Pearson bivariate correlation matrix for relevant regression variables
| 1. | 2. | |
|---|---|---|
| 1. 3mo Pain Std. Res. | ||
| 2. CPM | .66* | |
| 3. CS Z | −.42 | .12 |
p < 0.05;
CPM: Conditioned Pain Modulation, CS: Central Sensitization Z Score
Table 5.
Regression model of Pain at 3 months
| Step Variables | β | SE | Beta | T | R | R2 | P value |
|---|---|---|---|---|---|---|---|
| CPM | 6.27 | 1.89 | .72 | 3.32* | |||
| CS | −1.80 | .77 | −.50 | −2.34* | .82 | .68 | 0.02* |
|
| |||||||
| F(8,2) = 7.42, p = 0.02 | |||||||
p < .05
Post hoc analyses
In order to examine the association between central sensitization/conditioned pain modulation and clinical pain, groups were created using a mid-line split of CS and CPM. ANOVAs were conducted to evaluate differences between groups in the percentage of pain reduction from baseline to three month follow-up. Pain at baseline for those with lower and higher CS were equivalent (mean = 7.4, SD = 1.4; mean = 8.0, SD = 1.3; respectively; however pain had reduced to a greater degree in the enhanced facilitation (higher CS) group (mean = 2.3, SD = 2.2) when compared with the lower CS group (mean = 6.0, SD = 1.8; p = .018). This represents a 70% drop in pain ratings over the course of three months in the higher CS group and a reduction of 23% in the lower CS group (p = .02). When split based on CPM, pain at baseline for those with greater CPM (more efficient pain modulation) was equivalent to those with a less efficient modulatory system (mean = 7.4, SD = .7; mean = 8.2,SD = .8; respectively). Pain reduced to a greater degree in the less efficient CPM group (mean = 4.2, SD = 2.8; mean = 5.8, SD = 2.2; respectively); representing a reduction in pain of 45.7% and 26.9%; respectively, however this did not reach statistical significance (p’s > 0.05).
Discussion and Conclusions
The current small pilot study found a reduction in pain ratings from baseline to subsequent sessions, both in verbal pain reports provided to physicians as well on the BPI questionnaire. In Trial Responders, a slow but steady increase is observed from visit 2 (trial visit) to visit 4 (3 months post permanent SCS placement). This trend may suggest the need for stimulator reprogramming or adjusting SCS parameters. Pain interference was only reduced at the second visit in the Trial Responder group. Psychological factors have a strong association with treatment outcome in SCS (29). A systematic review found that pre-surgical psychological factors including somatization, depression, anxiety, and poor coping were most predictive of poor response to both lumbar surgery and spinal cord stimulation (29). In the current sample, depression and sleep disturbance were significantly correlated with pain at three month follow-up, with greater depression and more sleep disturbance associated with experiencing greater pain at 3 months post SCS. Depression is frequently reported as an important factor (29); however, sleep disturbance is an area of expanding interest and study. For example, a recent systematic review (30) found consistent evidence that sleep quality improves following SCS. Demographic variables were not associated with pain at three months in our sample, though other reports have found that age and pain duration are important predictive factors (29). In the current analyses, few alterations over time in QST were apparent.
Quantitative sensory testing (QST) has been increasingly utilized to measure individual patient characteristics that might be associated with long-term pain outcomes (10). Reviews (31;32) have highlighted the value of QST, and many studies have demonstrated its clinical relevance. In general, increased sensitivity to painful stimuli (e.g., low pain threshold and tolerance, high ratings of pain intensity in response to application of a standardized stimulus) may be a risk factor for poor outcomes. Several studies have examined detection threshold (first noticeable sensation), pain threshold (first experience the sensation as painful) and/or tolerance (when no longer able to withstand the sensation) to heat, cold, vibratory or pressure stimuli. Generally, these studies have found alterations in vibratory and tactile thresholds (7;33), as well as heat discrimination and pain threshold changes (34) with stimulation. However, others have noted no changes (7;35), or return to baseline (35). Inconsistent findings have been reported in SCS patients experiencing allodynia, painful sensations to a normally non-painful stimulus. In a long-term SCS study, brush evoked (dynamic) and static mechanical (gentle force, gradual pressure) hyperalgesia were reduced with SCS and sustained over 12 months in CRPS patients (35). Others examining CRPS patients found brush evoked allodynia to be a significant negative prognostic factor of SCS treatment outcomes (36). However, another study conducted in patients with neuropathic pain found that the presence of allodynia and/or hyperalgesia was associated with a positive SCS trial and improved long-term outcomes (37). In our current analyses, allodynia appeared to reduce moderately over time and a substantial reduction was noted in participants reporting the phenomenon.
Traditional ‘static’ QST methods, including pain thresholds, tolerance and supra-threshold stimuli depict a single point on the pain experience continuum. Though important, recent evidence suggests they may be less likely to characterize pain modulatory processes (10). ‘Dynamic’ QST, which measures multiple or repetitive stimuli, may have stronger clinical relevance and/or predictive ability (38), though little work has been conducted in SCS using dynamic measures (39). To our knowledge, this is the first analysis of ‘dynamic’ models of laboratory pain methods with the intention of understanding their association with SCS pain outcomes. Dynamic measures include tests of central sensitization, such as temporal summation, and assessment of conditioned pain modulation. Temporal summation of pain assesses the facilitation of pain produced by repeated noxious stimulation; studies have shown that it involves sensitization of 2nd-order dorsal horn neurons in the spinal cord and NMDA (9;40;41). In humans, temporal summation is thought to reflect facilitation of endogenous pain-modulatory processes arising from supraspinal structures (41;42) and has been implicated in pathophysiologic models of chronic pain (43). Several conditions, including fibromyalgia (44;45) and temporomandibular disorders (TMD) (46;47) are characterized by pathologically enhanced temporal summation. Enhanced presurgical temporal summation was also found to predict pain in the acute postoperative period (48). Our current analyses suggest the potential for group differences in temporal summation as well as reductions in temporal summation over time. These findings hint at the possibility that SCS may alter central pain processing mechanisms in general, and NMDA circuitry in particular (9). Reduced conditioned pain modulation (CPM), which purports to measure pain inhibition, has also been reported in a number of pain conditions, including fibromyalgia and osteoarthritis (49). Importantly, enhanced CPM efficiency predicts chronic post-operative pain in several conditions (those with greater CPM are less likely to develop chronic pain) and has been shown to predict analgesic efficacy (49).
CS and CPM were associated with three month follow-up pain in the current analyses. Lower central sensitization was associated with increased pain at three months post implantation, suggesting that those with greater sensitivity may be able to obtain the greatest value from SCS. Additionally, CPM was significantly associated, suggesting that those with reduced pain inhibition at baseline may have the most to gain and experience the largest benefit from SCS. These results suggest a potential mechanism whereby SCS influences pain regulatory systems. It has recently been suggested that targeting individuals with dysfunctional CS/CPM pain modulatory mechanisms with specific drugs [and potentially, procedures] may be beneficial because these individuals may have the greatest capacity for change, and therefore the drug/procedure may be capable of rectifying the modulatory problem and provide enhanced improvements in pain (49). Although somewhat counterintuitive, given that reduced pain modulation capacity has been associated with greater risk of pain acquisition, similar findings have been observed in drug studies. For example, painful diabetic neuropathy patients with reduced CPM experienced enhanced pain reduction from duloxetine, while the drug was less efficacious in those with more efficient CPM (50). In another study, post-cesarean pain patients with enhanced temporal summation experienced the greatest analgesic effect from ketamine (49). Thus, SCS may work best for patients with the greatest degree of sensitization and the least functional opioid-mediated endogenous inhibitory mechanisms, presumably by activating those systems. This also suggests that people in whom these systems are functioning efficiently cannot derive as much benefit from SCS treatment. Relatedly, few differences emerged between affected and unaffected sites, potentially suggesting generalized sensitivity; however, no healthy control group was examined so these comparisons are speculative.
A number of limitations should be considered when interpreting the current findings. Most problematic is our small sample size and the frequency of missing data. Unfortunately, we were unable to recruit and retain the number of participants that would have provided adequate power to fully explore group and time effects with more sophisticated statistical models. Relatedly, some participants did not wish to complete all tests, thus producing somewhat differing sample sizes by test. Future appropriately powered and designed trials should confirm the effects observed here and explore potential group and time effects as well as group by time interactions. Another limitation is that this was a completely observational study and no experimental manipulation, randomization to specific groups or non-stimulation comparison group was/could be assigned. We also lacked a power analysis, which limits the interpretation of positive and negative findings from this small, pilot study. Due to our small sample size, we were also unable to examine sex effects on pain outcomes, including QST, questionnaire data and clinical pain report. Our study sample also consisted of heterogeneous pain diagnoses, which may have obscured our ability to observe effects. An additional limitation is our lack of extended long-term follow-up. Our original plan for analyses included full year follow-up data and use of RM-ANOVAs; however, this method excludes individuals who do not have full data; thus our results are limited by the variability in response patterns and completion of questionnaires and laboratory pain measures. Another limitation includes the clinical applicability of QST and the ability to conduct such testing in the clinic. Several groups have attempted to create standardized bedside sensory testing kits for implementation in clinical settings. A recent study sought to develop a bedside pain assessment kit and then classify osteoarthritis patients based on sensory profiles identified by this testing (51). The clinical relevance and ease of using such a kit in a typical office setting have yet to be assessed; however, such study is promising and future studies should assess categorization of candidates for SCS based on the sensory profiles identified here and whether that may be a useful method for patient selection. Despite these limitations, our findings hint at the importance of pain regulatory mechanisms, specifically central sensitization/pain facilitation and pain inhibition in the efficacy of SCS treatment. Future studies may wish to include evaluation of dynamic pain modulatory testing models when examining SCS efficacy.
Figure 3.

Thermal (heat) temporal summation on the foot for each visit in responders
Acknowledgments
This study was supported by research grants to SNR from Medtronic Inc. (Minneapolis, Minnesota, USA) and a grant to CMC from the National Institutes of Health (K23 NS070933, Bethesda, Maryland, USA). We would like to thank Vincent Moskunas, our Medtronic representative, and the patients that participated in this study.
Footnotes
Disclosure Information: Medtronic provided 4% salary support for CMC from 2011-2014. SNR received research grant support from Medtronic, Inc. PWW was employed by Medtronic, Inc during the course of the study. SPC is a consultant for Semnur Pharmaceuticals, and Regenesis and attended an Advisory Board Meeting for Kimberly Clark last year. PJC’s radio program, Aches and Gains is supported in part by Medtronic. None of the authors has a commercial interest in the material presented in this paper. No other relationships might lead to a conflict of interest in the current study.
Reference List
- 1.Song JJ, Popescu A, Bell RL. Present and potential use of spinal cord stimulation to control chronic pain. Pain Physician. 2014 May;17(3):235–46. [PubMed] [Google Scholar]
- 2.Smits H, van KM, Holsheimer J, Joosten EA. Experimental spinal cord stimulation and neuropathic pain: mechanism of action, technical aspects, and effectiveness. Pain Pract. 2013 Feb;13(2):154–68. doi: 10.1111/j.1533-2500.2012.00579.x. [DOI] [PubMed] [Google Scholar]
- 3.Falowski S, Celii A, Sharan A. Spinal cord stimulation: an update. Neurotherapeutics. 2008 Jan;5(1):86–99. doi: 10.1016/j.nurt.2007.10.066. [DOI] [PMC free article] [PubMed] [Google Scholar]
- 4.Oakley JC, Prager JP. Spinal cord stimulation: mechanisms of action. Spine (Phila Pa 1976 ) 2002 Nov 15;27(22):2574–83. doi: 10.1097/00007632-200211150-00034. [DOI] [PubMed] [Google Scholar]
- 5.Guan Y. Spinal cord stimulation: neurophysiological and neurochemical mechanisms of action. Curr Pain Headache Rep. 2012 Jun;16(3):217–25. doi: 10.1007/s11916-012-0260-4. [DOI] [PubMed] [Google Scholar]
- 6.Guan Y, Wacnik PW, Yang F, Carteret AF, Chung CY, Meyer RA, et al. Spinal cord stimulation-induced analgesia: electrical stimulation of dorsal column and dorsal roots attenuates dorsal horn neuronal excitability in neuropathic rats. Anesthesiology. 2010 Dec;113(6):1392–405. doi: 10.1097/ALN.0b013e3181fcd95c. [DOI] [PubMed] [Google Scholar]
- 7.Eisenberg E, Backonja MM, Fillingim RB, Pud D, Hord DE, King GW, et al. Quantitative sensory testing for spinal cord stimulation in patients with chronic neuropathic pain. Pain Pract. 2006 Sep;6(3):161–5. doi: 10.1111/j.1533-2500.2006.00080.x. [DOI] [PubMed] [Google Scholar]
- 8.Rasche D, Ruppolt MA, Kress B, Unterbert A, Tronnier VM. Quantitative Sensory Testing in Patients With Chronic Unilateral Radicular Neuropathic Pain and Active Spinal Cord Stimulation. Neuromodulation. 2006;9(3):239–247. doi: 10.1111/j.1525-1403.2006.00066.x. [DOI] [PubMed] [Google Scholar]
- 9.Eide PK. Wind-up and the NMDA receptor complex from a clinical perspective. Eur J Pain. 2000;4(1):5–15. doi: 10.1053/eujp.1999.0154. [DOI] [PubMed] [Google Scholar]
- 10.Granot M. Can we predict persistent postoperative pain by testing preoperative experimental pain? Curr Opin Anaesthesiol. 2009 Jun;22(3):425–30. doi: 10.1097/ACO.0b013e32832a40e1. [DOI] [PubMed] [Google Scholar]
- 11.Son BC, Kim DR, Lee SW, Chough CK. Factors associated with the success of trial spinal cord stimulation in patients with chronic pain from failed back surgery syndrome. J Korean Neurosurg Soc. 2013 Dec;54(6):501–6. doi: 10.3340/jkns.2013.54.6.501. [DOI] [PMC free article] [PubMed] [Google Scholar]
- 12.Cleeland CS, Ryan KM. Pain assessment: global use of the Brief Pain Inventory. Ann Acad Med Singapore. 1994 Mar;23(2):129–38. [PubMed] [Google Scholar]
- 13.Beck AT, Steer RA, Carbin MG. Psychometric properties of the Beck Depression Inventory: Twenty-five years of evaluation. Clinical Psychology Review. 1988;8(1):77–100. [Google Scholar]
- 14.Sullivan MJ, Bishop S, Pivik J. The Pain Catastrophizing Scale: development and validation. Psychological Assessment. 1995;7:524–32. [Google Scholar]
- 15.Jensen R, Rasmussen BK, Pedersen B, Lous I, Olesen J. Cephalic muscle tenderness and pressure pain threshold in a general population. Pain. 1992 Feb;48(2):197–203. doi: 10.1016/0304-3959(92)90059-K. [DOI] [PubMed] [Google Scholar]
- 16.Vierck CJJ, Cannon RL, Fry G, Maixner W, Whitsel BL. Characteristics of temporal summation of second pain sensations elicited by brief contact of glabrous skin by a preheated thermode. J Neurophysiol. 1997 Aug;78(2):992–1002. doi: 10.1152/jn.1997.78.2.992. [DOI] [PubMed] [Google Scholar]
- 17.Rolke R, Baron R, Maier C, Tolle TR, Treede RD, Beyer A, et al. Quantitative sensory testing in the German Research Network on Neuropathic Pain (DFNS): standardized protocol and reference values. Pain. 2006 Aug;123(3):231–43. doi: 10.1016/j.pain.2006.01.041. [DOI] [PubMed] [Google Scholar]
- 18.Magerl W, Wilk SH, Treede RD. Secondary hyperalgesia and perceptual wind-up following intradermal injection of capsaicin in humans. Pain. 1998 Feb;74(2–3):257–68. doi: 10.1016/s0304-3959(97)00177-2. [DOI] [PubMed] [Google Scholar]
- 19.Rolke R, Magerl W, Campbell KA, Schalber C, Caspari S, Birklein F, et al. Quantitative sensory testing: a comprehensive protocol for clinical trials. Eur J Pain. 2006 Jan;10(1):77–88. doi: 10.1016/j.ejpain.2005.02.003. [DOI] [PubMed] [Google Scholar]
- 20.Diatchenko L, Nackley AG, Slade GD, Fillingim RB, Maixner W. Idiopathic pain disorders--pathways of vulnerability. Pain. 2006 Aug;123(3):226–30. doi: 10.1016/j.pain.2006.04.015. [DOI] [PubMed] [Google Scholar]
- 21.Meeus M, Nijs J. Central sensitization: a biopsychosocial explanation for chronic widespread pain in patients with fibromyalgia and chronic fatigue syndrome. Clin Rheumatol. 2007 Apr;26(4):465–73. doi: 10.1007/s10067-006-0433-9. [DOI] [PMC free article] [PubMed] [Google Scholar]
- 22.Le Bars D, Dickenson AH, Besson JM. Diffuse noxious inhibitory controls (DNIC). II. Lack of effect on non-convergent neurones, supraspinal involvement and theoretical implications. Pain. 1979 Jun;6(3):305–27. doi: 10.1016/0304-3959(79)90050-2. [DOI] [PubMed] [Google Scholar]
- 23.Le Bars D, Dickenson AH, Besson JM. Diffuse noxious inhibitory controls (DNIC). I. Effects on dorsal horn convergent neurones in the rat. Pain. 1979 Jun;6(3):283–304. doi: 10.1016/0304-3959(79)90049-6. [DOI] [PubMed] [Google Scholar]
- 24.Yarnitsky D, Arendt-Nielsen L, Bouhassira D, Edwards RR, Fillingim RB, Granot M, et al. Recommendations on terminology and practice of psychophysical DNIC testing. Eur J Pain. 2010 Apr;14(4):339. doi: 10.1016/j.ejpain.2010.02.004. [DOI] [PubMed] [Google Scholar]
- 25.Talbot JD, Duncan GH, Bushnell MC. Effects of diffuse noxious inhibitory controls (DNICs) on the sensory-discriminative dimension of pain perception. Pain. 1989 Feb;36(2):231–8. doi: 10.1016/0304-3959(89)90028-6. [DOI] [PubMed] [Google Scholar]
- 26.Edwards RR, Mensing G, Cahalan C, Greenbaum S, Narang S, Belfer I, et al. Alteration in pain modulation in women with persistent pain after lumpectomy: influence of catastrophizing. J Pain Symptom Manage. 2013 Jul;46(1):30–42. doi: 10.1016/j.jpainsymman.2012.06.016. [DOI] [PMC free article] [PubMed] [Google Scholar]
- 27.Martel MO, Wasan AD, Edwards RR. Sex differences in the stability of conditioned pain modulation (CPM) among patients with chronic pain. Pain Med. 2013 Nov;14(11):1757–68. doi: 10.1111/pme.12220. [DOI] [PMC free article] [PubMed] [Google Scholar]
- 28.Gracely RH, Geisser ME, Giesecke T, Grant MA, Petzke F, Williams DA, et al. Pain catastrophizing and neural responses to pain among persons with fibromyalgia. Brain. 2004 Apr;127(Pt 4):835–43. doi: 10.1093/brain/awh098. [DOI] [PubMed] [Google Scholar]
- 29.Celestin J, Edwards RR, Jamison RN. Pretreatment psychosocial variables as predictors of outcomes following lumbar surgery and spinal cord stimulation: a systematic review and literature synthesis. Pain Med. 2009 May;10(4):639–53. doi: 10.1111/j.1526-4637.2009.00632.x. [DOI] [PubMed] [Google Scholar]
- 30.Kelly GA, Blake C, Power CK, O’keeffe D, Fullen BM. The impact of spinal cord stimulation on physical function and sleep quality in individuals with failed back surgery syndrome: a systematic review. Eur J Pain. 2012 Jul;16(6):793–802. doi: 10.1002/j.1532-2149.2011.00092.x. [DOI] [PubMed] [Google Scholar]
- 31.Staahl C, Olesen AE, Andresen T, Arendt-Nielsen L, Drewes AM. Assessing efficacy of non-opioid analgesics in experimental pain models in healthy volunteers: an updated review. Br J Clin Pharmacol. 2009 Sep;68(3):322–41. doi: 10.1111/j.1365-2125.2009.03433.x. [DOI] [PMC free article] [PubMed] [Google Scholar]
- 32.Arendt-Nielsen L, Yarnitsky D. Experimental and clinical applications of quantitative sensory testing applied to skin, muscles and viscera. J Pain. 2009 Jun;10(6):556–72. doi: 10.1016/j.jpain.2009.02.002. [DOI] [PubMed] [Google Scholar]
- 33.Lindblom U, Meyerson BA. Influence on touch, vibration and cutaneous pain of dorsal column stimulation in man. Pain. 1975;1:257–70. doi: 10.1016/0304-3959(75)90042-1. [DOI] [PubMed] [Google Scholar]
- 34.Marchand S, Bushnell MC, Molina-Negro P, Martinez SN, Duncan GH. The effects of dorsal column stimulation on measures of clinical and experimental pain in man. Pain. 1991 Jun;45(3):249–57. doi: 10.1016/0304-3959(91)90049-4. [DOI] [PubMed] [Google Scholar]
- 35.Kemler MA, Reulen JP, Barendse GA, van Kleef M, de Vet HC, van den Wildenberg FA. Impact of spinal cord stimulation on sensory characteristics in complex regional pain syndrome type I: a randomized trial. Anesthesiology. 2001 Jul;95(1):72–80. doi: 10.1097/00000542-200107000-00016. [DOI] [PubMed] [Google Scholar]
- 36.van EF, Smits H, Geurts JW, Kessels AG, Kemler MA, van KM, et al. Brush-evoked allodynia predicts outcome of spinal cord stimulation in complex regional pain syndrome type 1. Eur J Pain. 2010 Feb;14(2):164–9. doi: 10.1016/j.ejpain.2009.10.009. [DOI] [PubMed] [Google Scholar]
- 37.Williams KA, Gonzalez-Fernandez M, Hamzehzadeh S, Wilkinson I, Erdek MA, Plunkett A, et al. A multi-center analysis evaluating factors associated with spinal cord stimulation outcome in chronic pain patients. Pain Med. 2011 Aug;12(8):1142–53. doi: 10.1111/j.1526-4637.2011.01184.x. [DOI] [PubMed] [Google Scholar]
- 38.Yarnitsky D, Crispel Y, Eisenberg E, Granovsky Y, Ben-Nun A, Sprecher E, et al. Prediction of chronic post-operative pain: Pre-operative DNIC testing identifies patients at risk. Pain. 2008;138:22–8. doi: 10.1016/j.pain.2007.10.033. [DOI] [PubMed] [Google Scholar]
- 39.Campbell CM, Jamison RN, Edwards RR. Psychological screening/phenotyping as predictors for spinal cord stimulation. Curr Pain Headache Rep. 2013 Jan;17(1):307. doi: 10.1007/s11916-012-0307-6. [DOI] [PMC free article] [PubMed] [Google Scholar]
- 40.Lautenbacher S, Roscher S, Strian F. Tonic evoked pain by pulsating heat: temporal summation mechanisms and perceptual qualities. Somatosens Mot Res. 1995;12(1):59–70. doi: 10.3109/08990229509063142. [DOI] [PubMed] [Google Scholar]
- 41.Arendt-Nielsen L, Petersen-Felix S. Wind-up and neuroplasticity: is there a correlation to clinical pain? Eur J Anaesthesiol Suppl. 1995 May;10:1–7. [PubMed] [Google Scholar]
- 42.Arendt-Nielsen L, Petersen-Felix S, Fischer M, Bak P, Bjerring P, Zbinden AM. The effect of N-methyl-D-aspartate antagonist (ketamine) on single and repeated nociceptive stimuli: a placebo-controlled experimental human study. Anesth Analg. 1995 Jul;81(1):63–8. doi: 10.1097/00000539-199507000-00013. [DOI] [PubMed] [Google Scholar]
- 43.Staud R. Evidence of involvement of central neural mechanisms in generating fibromyalgia pain. Curr Rheumatol Rep. 2002 Aug;4(4):299–305. doi: 10.1007/s11926-002-0038-5. [DOI] [PubMed] [Google Scholar]
- 44.Price DD, Staud R, Robinson ME, Mauderli AP, Cannon R, Vierck CJ. Enhanced temporal summation of second pain and its central modulation in fibromyalgia patients. Pain. 2002 Sep;99(1–2):49–59. doi: 10.1016/s0304-3959(02)00053-2. [DOI] [PubMed] [Google Scholar]
- 45.Staud R, Vierck CJ, Cannon RL, Mauderli AP, Price DD. Abnormal sensitization and temporal summation of second pain (wind-up) in patients with fibromyalgia syndrome. Pain. 2001 Mar;91(1–2):165–75. doi: 10.1016/s0304-3959(00)00432-2. [DOI] [PubMed] [Google Scholar]
- 46.Maixner W, Fillingim R, Sigurdsson A, Kincaid S, Silva S. Sensitivity of patients with temporomandibular disorders to experimentally evoked pain: evidence for altered temporal summation of pain. Pain. 1998;76:71–81. doi: 10.1016/s0304-3959(98)00028-1. [DOI] [PubMed] [Google Scholar]
- 47.Bragdon EE, Light KC, Costello NL, Sigurdsson A, Bunting S, Bhalang K, et al. Group differences in pain modulation: pain-free women compared to pain-free men and to women with TMD. Pain. 2002 Apr;96(3):227–37. doi: 10.1016/S0304-3959(01)00451-1. [DOI] [PubMed] [Google Scholar]
- 48.Weissman-Fogel I, Granovsky Y, Crispel Y, Ben-Nun A, Best LA, Yarnitsky D, et al. Enhanced presurgical pain temporal summation response predicts post-thoracotomy pain intensity during the acute postoperative phase. J Pain. 2009 Jun;10(6):628–36. doi: 10.1016/j.jpain.2008.12.009. [DOI] [PubMed] [Google Scholar]
- 49.Yarnitsky D, Granot M, Granovsky Y. Pain modulation profile and pain therapy: between pro- and antinociception. Pain. 2014 Apr;155(4):663–5. doi: 10.1016/j.pain.2013.11.005. [DOI] [PubMed] [Google Scholar]
- 50.Yarnitsky D, Granot M, Nahman-Averbuch H, Khamaisi M, Granovsky Y. Conditioned pain modulation predicts duloxetine efficacy in painful diabetic neuropathy. Pain. 2012 Jun;153(6):1193–8. doi: 10.1016/j.pain.2012.02.021. [DOI] [PubMed] [Google Scholar]
- 51.Osgood E, Trudeau JJ, Eaton TA, Jensen MP, Gammaitoni A, Simon LS, et al. Development of a bedside pain assessment kit for the classification of patients with osteoarthritis. Rheumatol Int. 2014 Dec 16; doi: 10.1007/s00296-014-3191-z. [DOI] [PubMed] [Google Scholar]