Abstract
In this study we report the synthesis of a novel class of near-infrared fluorescent contrast agents that possess high-specificity targeting to cartilage inherent to the chemical structure of the fluorophore. After a single, low-dose intravenous injection and a clearance time of ≤ 4 h, these agents bind to all three major types of cartilage (hyaline, elastic, and fibrocartilage) and perform equally well across species. Analysis of chemical structure similarities reveals a potential pharmacophore for cartilage targeting. Our results lay the foundation for future improvements in tissue engineering, joint surgery, and cartilage-specific drug development.
Keywords: fluorophores, near-infrared fluorescence, optical imaging, image-guided surgery, structure-inherent targeting
Graphical abstract

Near-infrared fluorophores specific for cartilage were synthesized and their performance tested in small and large animal model systems. Not only do these agents bind all types of cartilage in all species tested, but they can also be combined with other targeted near-infrared fluorophores, such as those specific to bone, to provide unprecedented biomedical optical imaging.
Healthy cartilage is essential for a good quality of life. Cushioning joints and intervertebral spaces, giving form to the ears and nose, and protecting the trachea are just a few of its essential functions. All three histological types of cartilage, hyaline (a.k.a. articular when on a joint surface), elastic, and fibrocartilage are produced by chondrocytes, or more precisely chondroblasts until entrapment within their own extracellular matrix.[1–3] The three types differ mainly in the relative amounts of collagen, proteoglycans, and elastin present.
Dysfunction of cartilage leads to several acute and chronic morbidities. In degenerative joint disease (DJD), i.e., osteoarthritis, destruction of cartilage on the articular surfaces of joints leads to pain and debilitation. DJD affects over 27 million patients in the US alone and results in huge economic losses.[4] Because cartilage cannot currently regenerate like bone, replacement therapy using tissue engineering, and pharmacologic treatment using drugs that prevent destruction, are being explored intensely. However, even if these therapies existed tomorrow, there would be no way to assess pharmacologic treatment non-invasively or to guide surgery with respect to neo-cartilage transplantation.
Despite its extreme importance, cartilage is difficult to image. So far, most efforts to image and quantify cartilage have focused on magnetic resonance imaging (MRI),[1,5] however, the water-deficient composition of cartilage makes it a poor target for MRI.[6] Low x-ray absorption also makes cartilage a relatively poor target for clinical computed tomography (CT), and when using conventional microCT it is essentially invisible.[7] There is one single-photon emission computed tomography (SPECT) radiotracer for cartilage described in the literature in 2001,[8] 99mTc-labeled N-(triethylammonium)-3-propyl-[15]ane-N5, but no clinical studies have followed and recently published preclinical studies show poor image quality.[9]
To date, there isn’t a single optical contrast agent for cartilage, and certainly not one in the near-infrared (NIR) wavelength range of 700 nm to 900 nm. NIR light has certain key advantages for biomedical imaging including relatively low tissue absorption, reduced scatter, and minimal autofluorescence.[10–12] Thus, unlike visible light, which only penetrates a few hundred microns below a tissue surface, NIR light can penetrate millimeters to centimeters into living tissue. Therefore, the use of NIR fluorophores, i.e., molecules that convert one NIR wavelength into another, permits a high signal-to-background ratio (SBR) to be produced.[12]
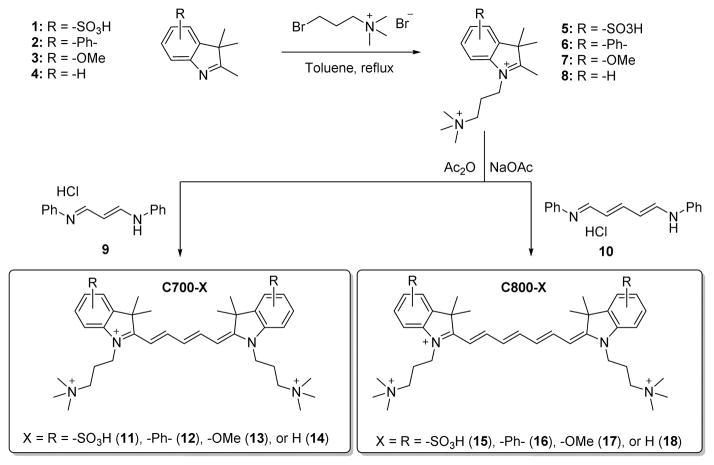
Initial in vivo screening of a large (> 300 unique chemical entities) NIR fluorophore library revealed a class of compounds with apparent specificity for cartilage. As shown in Scheme 1, a series of these molecules was re-synthesized, along with several derivatives, from a pentamethine core for 700 nm fluorescence and a heptamethine core for 800 nm fluorescence. The synthetic pathways for C700 and C800 are detailed in Supplementary Methods. The physicochemical and optical properties of all NIR fluorophores are summarized in Table 1. By modulating the non-resonant side chains of the polymethine core, final NIR fluorophores could be systematically altered in terms of hydrophobicity, polarity, and electron-resonance properties without affecting the emission wavelength in the range of 650 to 800 nm. These wavelengths minimize tissue autofluorescence and maximize fluorescence signal.[13]
Scheme 1.
Synthetic scheme of C700 and C800 NIR fluorophores.
Table 1.
Physicochemical and optical properties of C700 and C800 NIR fluorophores. In silico calculations of molecular properties were calculated using Marvin and JChem calculator plugins. All optical measurements were performed at 37°C in 100% FBS buffered with 50 mM HEPES, pH 7.4.
| 700 nm Fluorophores | C700-SO3− (11) | C700-Ph (12) | C700-OMe (13) | C700-H (14) |
|---|---|---|---|---|
| Molecular Weight (Da) | 713.97 | 655.98 | 615.91 | 555.86 |
| LogD at pH 7.4 | −2.20 | −2.63 | −4.93 | −4.61 |
| Total Polar Surface Area (Å2) | 120.65 | 6.25 | 24.71 | 6.25 |
| Extinction Coefficient (M−1cm−1) | 85,000 | 131,000 | 96,500 | 110,400 |
| Absorbance Maximum (nm) | 650 | 691 | 666 | 646 |
| Emission Maximum (nm) | 668 | 716 | 692 | 665 |
| Stokes Shift (nm) | 18 | 25 | 26 | 19 |
| Quantum Yield (%) | 11.5 | 12.4 | 9.7 | 10.8 |
| 800 nm Fluorophores | C800-SO3− (15) | C800-Ph (16) | C800-OMe (17) | C800-H (18) |
|---|---|---|---|---|
| Molecular Weight (Da) | 740.01 | 682.01 | 641.95 | 740.01 |
| LogD at pH 7.4 | −1.67 | −2.10 | −4.40 | −1.67 |
| Total Polar Surface Area (Å2) | 120.65 | 6.25 | 24.71 | 120.65 |
| Extinction Coefficient (M−1cm−1) | 128,000 | 179,000 | 121,000 | 128,000 |
| Absorbance Maximum (nm) | 765 | 800 | 770 | 765 |
| Emission Maximum (nm) | 788 | 818 | 804 | 788 |
| Stokes Shift (nm) | 23 | 18 | 34 | 23 |
| Quantum Yield (%) | 10.4 | 10.8 | 11.5 | 10.4 |
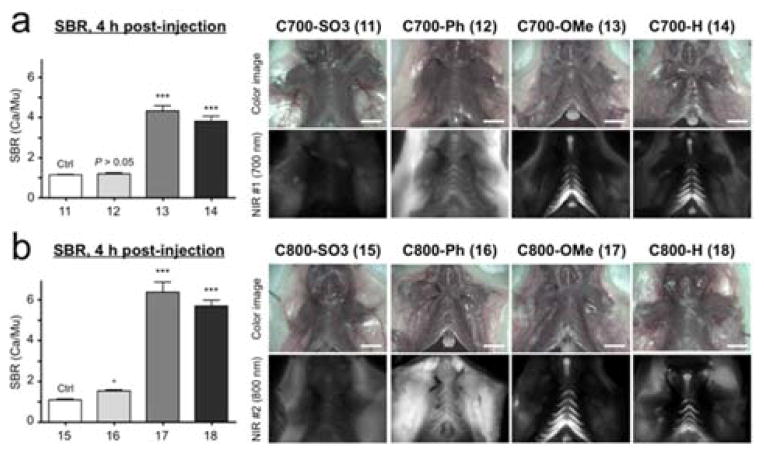
As a preliminary in vivo test for cartilage targeting, C700 and C800 NIR fluorophores were intravenously injected into CD-1 mice (10 nmol; 0.3 mg kg−1), imaged after 4 h, and the fluorescent signals in costal cartilage tissues were respectively quantified (Figure 1).
Figure 1.
In vivo cartilage targeting using C700 (a) and C800 (b) NIR fluorophores in mice. Each fluorophore was injected intravenously into 25 g CD-1 mice (10 nmol; 0.3 mg kg−1) 4 h prior to imaging. SBR (Ca/Mu) was calculated by the fluorescence intensity of costal cartilage tissues versus the signal intensity of neighboring muscle obtained over the imaging period (n = 3, mean ± s.d.). *P < 0.05, ***P < 0.001. All NIR fluorescence images have identical exposure and normalizations. Ca, cartilage; Mu, muscle. Scale bars = 1 cm.
Interestingly, C700-OMe and C800-OMe showed the highest SBR (calculated by fluorescence intensities between costal cartilage and neighboring muscle) values compared to the other molecules, and both C700-H and C800-H also showed high cartilage uptake. Although the synergy of methoxy groups on the cationic polymethine structure for efficient cartilage binding is not well understood, methoxy groups improve hydrophilicity (LogD at pH 7.4 < −4.0) and increase polar surface area (24.71 Å). In contrast, the addition of sulfonates and phenyl groups on the polymethine backbone diminished the cartilage-specific targeting of the final fluorophores. C700-Ph and C800-Ph showed high nonspecific background signals due to the increased hydrophobicity and unbalanced 3D conformation (data not shown), whereas the net surface charges of C700-SO3− and C800-SO3− were geometrically balanced between sulfonates and quaternary ammonium groups resulting in no cartilage uptake. In addition, the polarity values of sulfonated fluorophores are close to 120 Å2, which tend to be poor at permeating cell membranes.[14] Based on these results, we propose the pharmacophore for cartilage binding as shown in Scheme 2. Unfortunately, we do not, as yet, know the molecular target for binding. Once in hand, it should be possible to further refine the pharmacophore.
Scheme 2.
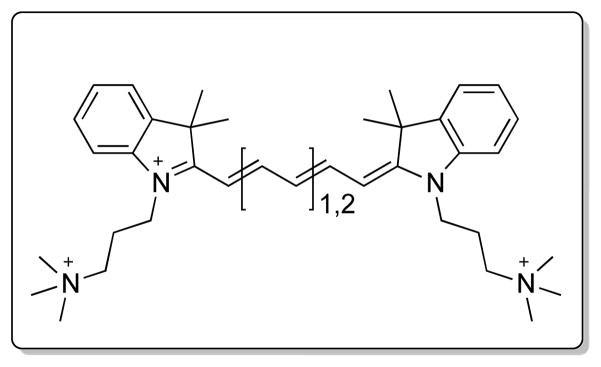
Proposed pharmacophore for high-specificity cartilage binding in vivo.
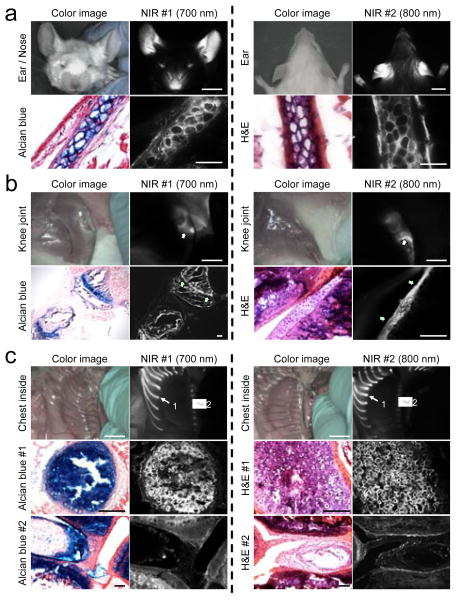
Because C700-OMe and C800-OMe showed the highest SBR for cartilage tissues among the different side chains, we selected these methoxy-substituted NIR fluorophores for further in vivo study. To determine if cartilage type (hyaline, elastic, or fibrocartilage) affected uptake we imaged all the major cartilage tissues at 4 h post-injection of C700-OMe and C800-OMe in CD-1 mice (Figure 2). After a single intravenous injection of each agent, all cartilage tissues were visualized clearly including ears/nose, knee joints, sternum, and intervertebral discs. Since the compositions of each cartilage tissue are different, we further performed histological evaluations using Alcian Blue and hematoxylin and eosin (H&E) staining. As shown in Figure 2, Alcian Blue mainly stained acidic glycosaminoglycans (GAGs) in cartilages as a dark blue color, where strong NIR fluorescence was observed. The histology data also confirm binding of our NIR fluorophores to all three types of cartilage. Since cartilage tissues are all produced by chondrocytes (or more precisely chondroblasts until entrapment within their own extracellular matrix) and differ mainly in the relative amounts of collagen, proteoglycans, and elastin present, we believe that the molecules we describe are binding either to the surface of chondrocytes, or more likely, to a secreted molecule with a high local concentration. Interestingly, the growth (epiphyseal) plate (Figure 2B, arrows) was targeted along with fibrocartilage of the knee joint in the young mice (8 wk) used for the study. A major component of the growth plate is hyaline cartilage located in the metaphysis at each end of long bones. Because the plate is typically found in children and adolescents, the results suggest that our NIR fluorophores can even bind to cartilage in early developmental stages.
Figure 2.
In vivo NIR imaging and histological analysis of cartilage tissues from ear (a), knee joint (b), and inside chest (c) in mice. C700-OMe and C800-OMe were intravenously injected into 25 g CD-1 mice (10 nmol; 0.4 mg/kg) 4 h prior to imaging. #1 (arrows) and #2 (arrowheads) in (c) indicate hyaline and fibrocartilage, respectively. Alcian Blue, H&E, and NIR images of resected cartilage tissues were obtained from the same animal. All NIR fluorescence images for each condition have identical exposure times and normalizations. Scale bars = 1 cm (for in vivo image) and 100 μm (for histology image). Images are representative of n = 3 independent experiments.
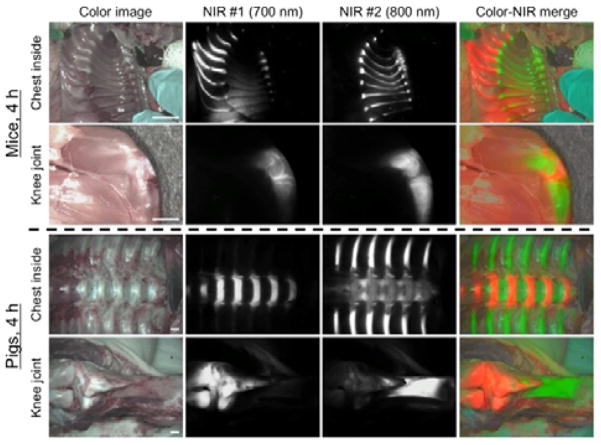
Finally, we exploited the dual-NIR channel capability of the FLARE imaging system to highlight cartilage and bone tissues simultaneously in real time. Since the bone-targeting NIR fluorophores (e.g., P800SO3−) have been previously developed by our group,[15] the combination of C700-OMe (emitting at 700 nm) and P800SO3−[15] (emitting at 800 nm) were used by injecting both agents together into mice and pigs, respectively. As shown in Figure 3, cartilage tissues were identified by C700-OMe in the 700 nm channel, whereas bone tissues were visualized by P800SO3− in 800 nm channel. This approach might prove useful in future tissue engineering studies where transplanted neocartilage can be visualized using one NIR channel and either bone or blood vessels can be visualized with the other. During human surgery, the new agents we describe might prove useful for estimating cartilage thickness during arthroscopy, or for finding inconspicuous damage to joints.
Figure 3.
Dual-channel in vivo fluorescence imaging of cartilage and bone tissues by using C700-OMe and P800SO3− [15] in the same animals. 10 nmol and 1 μmol of C700-OMe and P800SO3− were intravenously injected into 25 g CD-1 mice (top; 0.4 mg kg−1) and 35 kg Yorkshire pigs (bottom; 0.02 mg kg−1), simultaneously, 4 h prior to imaging. All NIR fluorescence images for each condition have identical exposure times and normalizations. Scale bars = 1 cm. Images are representative of n = 3 independent experiments. Pseudo-colored red and green colors were used for 700 nm and 800 nm channel images, respectively, in the color-NIR merged image.
Along with endocrine gland-specific[16] and bone-specific NIR fluorophores,[15] the novel cartilage-specific NIR fluorophores we describe are a third example of “structure-inherent targeting” where tissue-/organ-specific targeting is engineered directly into the non-resonant structure of a NIR fluorophore, thus creating the most compact possible optical contrast agent for biomedical imaging. We hope that our present findings will lay the foundation for the improved diagnosis and treatment of cartilage diseases.
Experimental Section
Synthesis of C700 and C800 NIR fluorophores
All chemicals and solvents were of American Chemical Society grade or HPLC purity. Starting materials were purchased from Sigma-Aldrich (Saint Louis, MO) and Fisher Scientific Inc. (Pittsburgh, PA) and used without purification. The reactions were followed using reversed phase silica gel thin layer chromatography plates (Merck EMD Millipore, Darmstadt, Germany) with 5% methanol in water as the mobile phase. Open column chromatography was utilized for the purification of all final compounds using reversed phase silica gel (Dynamic Adsorbents, Norcross, GA). See the Supporting Information for detailed chemical syntheses and analyses.
Optical and physicochemical property analyses
All optical measurements were performed at 37°C in 100% fetal bovine serum (FBS) buffered with 50 mM HEPES, pH 7.4. Absorbance and fluorescence emission spectra NIR fluorophores were measured using fiber optic HR2000 absorbance (200–1100 nm) and USB2000FL fluorescence (350–1000 nm) spectrometers (Ocean Optics, Dunedin, FL). NIR excitations were provided by 5 mW of a 655 nm red laser pointer (Opcom Inc., Xiamen, China) and 8 mW of a 765 nm NIR laser diode light source (Electro Optical Components, Santa Rosa, CA) coupled through a 300 μm core diameter, NA 0.22 fiber (Fiberguide Industries, Stirling, NJ). For fluorescence quantum yield (QY) measurements, oxazine 725 in ethylene glycol (QY = 19%)[17] and ICG in DMSO (QY = 13%)[18] were used as calibration standards, under conditions of matched absorbance at 655 and 765 nm, respectively. In silico calculations for surface molecular charge, the partition coefficient (LogD at pH 7.4) and total polar surface area (TPSA) were calculated using Marvin and JChem calculator plugins (ChemAxon, Budapest, Hungary).
NIR fluorescence imaging system
The dual-NIR channel FLARE imaging system has been described in detail previously.[19,20] In this study, 4 mW/cm2 of 670 nm excitation light and 11 mW/cm2 of 760 nm excitation light were used with white light (400–650 nm) at 40,000 lx. Color and NIR fluorescence images were acquired simultaneously with custom software at rates up to 15 Hz over a 15 cm diameter field of view. The imaging system was positioned at a distance of 18 inches from the surgical field. For each experiment, camera exposure time and image normalization was held constant.
Animal models
Animals were housed in an AAALAC-certified facility and were studied under the supervision of the BIDMC IACUC in accordance with approved institutional protocols (#101-2011 for rodents and #034-2013 for pigs). Male CD-1 mice (25–30 g, 8 weeks, Charles River Laboratories, Wilmington, MA) were anesthetized with 100 mg/kg ketamine and 10 mg/kg xylazine intraperitoneally (Webster Veterinary, Fort Devens, MA). Female Yorkshire pigs (E.M. Parsons and Sons, Hadley, MA) averaging 35 kg were induced with 4.4 mg/kg intramuscular Telazol (Fort Dodge Labs, Fort Dodge, IA), intubated, and maintained with 2% isoflurane (Baxter Healthcare Corp., Deerfield, IL). Following anesthesia, electrocardiogram, heart rate, pulse oximetry, and body temperature were monitored throughout surgery.
Quantitative analysis
At each time point, the fluorescence and background intensity of a region of interest (ROI) over each tissue was quantified using custom FLARE software. The signal-to-background ratio (SBR) was calculated as SBR = fluorescence/background, where background is the signal intensity of neighboring tissues, such as muscle or skin, obtained over the imaging period. All NIR fluorescence images for a particular fluorophore were normalized identically for all conditions of an experiment. At least 3 animals were analyzed at each time point. Statistical analysis was carried out using the unpaired Student’s t-test or one-way analysis of variance (ANOVA). Results were presented as mean ± s.d. and curve fitting was performed using Prism version 4.0a software (GraphPad, San Diego, CA).
Histology and NIR fluorescence microscopy
Cartilage tissues were placed in 2% paraformaldehyde in PBS for 30 min before mounting in Tissue-Tek OCT compound (Fisher Scientific, Pittsburgh, PA) and flash-freezing in liquid nitrogen. Frozen samples were cryosectioned (10 μm per slice), observed by NIR fluorescence microscopy, and also stained with Alcian Blue or hematoxylin and eosin (H&E), respectively. NIR fluorescence microscopy was performed on a 4-filter Nikon Eclipse TE300 microscope system as previously described.[21,22] The microscope was equipped with a 100 W mercury light source (Chiu Technical Corporation, Kings Park, NY), NIR-compatible optics, and a NIR-compatible 10X Plan Fluor objective lens and a 100X Plan Apo oil immersion objective lens (Nikon, Melville, NY). Images were acquired on an Orca-AG (Hamamatsu, Bridgewater, NJ). Image acquisition and analysis was performed using iVision software (BioVision Technologies, Exton, PA). Two custom filter sets (Chroma Technology Corporation, Brattleboro, VT) composed of 650 ± 22 nm and 750 ± 25 nm excitation filters, 675 nm and 785 nm dichroic mirrors, and 710 ± 25 nm and 810 ± 20 nm emission filters were respectively used to detect C700-OMe and C800-OMe signals in the frozen tissue samples.
Supplementary Material
Acknowledgments
We thank David Burrington, Jr. for editing, and Eugenia Trabucchi for administrative assistance.
Footnotes
This study was supported by the following grants from the National Institutes of Health: NIBIB grants #R01-EB-010022 and #R01-EB-011523. Dr. Frangioni is currently CEO of Curadel, LLC, which has licensed FLARE technology from the BIDMC.
Supporting information for this article is given via a link at the end of the document.
Contributor Information
Prof. Hoon Hyun, Email: hchoi@bidmc.harvard.edu.
Prof. Maged Henary, Email: mhenary1@gsu.edu.
References
- 1.Irie T, Oda K, Shiino A, Kubo M, Morikawa S, Urushiyama N, Aonuma S, Kimura T, Inubushi T, Oohashi T, Komatsu N. Med Chem Commun. 2013;4:1508–1512. [Google Scholar]
- 2.Stewart RC, Bansal PN, Entezari V, Lusic H, Nazarian RM, Snyder BD, Grinstaff MW. Radiology. 2013;266:141–150. doi: 10.1148/radiol.12112246. [DOI] [PMC free article] [PubMed] [Google Scholar]
- 3.Freedman JD, Lusic H, Snyder BD, Grinstaff MW. Angew Chem Int Ed. 2014;53:8406–8410. doi: 10.1002/anie.201404519. [DOI] [PMC free article] [PubMed] [Google Scholar]
- 4.Murphy L, Helmick CG. Orthop Nurs. 2012;31:85–91. doi: 10.1097/NOR.0b013e31824fcd42. [DOI] [PubMed] [Google Scholar]
- 5.Ding C, Zhang Y, Hunter D. Curr Opin Rheumatol. 2013;25:127–135. doi: 10.1097/BOR.0b013e32835a0fe1. [DOI] [PubMed] [Google Scholar]
- 6.Crema MD, Roemer FW, Marra MD, Burstein D, Gold GE, Eckstein F, Baum T, Mosher TJ, Carrino JA, Guermazi A. Radiographics. 2011;31:37–61. doi: 10.1148/rg.311105084. [DOI] [PMC free article] [PubMed] [Google Scholar]
- 7.Ruan MZ, Dawson B, Jiang MM, Gannon F, Heggeness M, Lee BH. Arthritis Rheum. 2013;65:388–396. doi: 10.1002/art.37766. [DOI] [PMC free article] [PubMed] [Google Scholar]
- 8.Ollier M, Maurizis JC, Nicolas C, Bonafous J, de Latour M, Veyre A, Madelmont JC. J Nucl Med. 2001;42:141–145. [PubMed] [Google Scholar]
- 9.Miot-Noirault EG, Vidal JA, Gauthier O, Auzeloux P, Lesoeur J, Cachin F, Askienazy S, Chezal JM, Vinatier C. Eur J Nucl Med Mol Imaging. 2012;39:1169–1172. doi: 10.1007/s00259-012-2081-4. [DOI] [PubMed] [Google Scholar]
- 10.Achilefu S. Angew Chem Int Ed. 2010;49:9816–9818. doi: 10.1002/anie.201005684. [DOI] [PMC free article] [PubMed] [Google Scholar]
- 11.Kobayashi H, Ogawa M, Alford R, Choyke PL, Urano Y. Chem Rev. 2010;110:2620–2640. doi: 10.1021/cr900263j. [DOI] [PMC free article] [PubMed] [Google Scholar]
- 12.Vahrmeijer AL, Hutteman M, van der Vorst JR, van de Velde CJ, Frangioni JV. Nat Rev Clin Oncol. 2013;10:507–518. doi: 10.1038/nrclinonc.2013.123. [DOI] [PMC free article] [PubMed] [Google Scholar]
- 13.Lee JH, Park G, Hong GH, Choi J, Choi HS. Quant Imaging Med Surg. 2012;2:266–273. doi: 10.3978/j.issn.2223-4292.2012.12.04. [DOI] [PMC free article] [PubMed] [Google Scholar]
- 14.Kim SH, Park G, Hyun H, Lee JH, Ashitate Y, Choi J, Hong GH, Owens EA, Henary M, Choi HS. Biomed Mater. 2013;8:014110. doi: 10.1088/1748-6041/8/1/014110. [DOI] [PMC free article] [PubMed] [Google Scholar]
- 15.Hyun H, Wada H, BK, Gravier J, Yadav Y, Laramie M, Henary M, Frangioni JV, Choi HS. Angew Chem Int Ed. 2014;53:10668–10672. doi: 10.1002/anie.201404930. [DOI] [PMC free article] [PubMed] [Google Scholar]
- 16.Hyun H, Park MH, Owens EA, Wada H, Henary M, Handgraaf HJ, Vahrmeijer AL, Frangioni JV, Choi HS. Nat Med. 2015 doi: 10.1038/nm.3728. [DOI] [PMC free article] [PubMed] [Google Scholar]
- 17.Sens R, Drexhage KH. J Luminesc. 1981;24:709–712. [Google Scholar]
- 18.Benson C, Kues HA. J Chem Eng Data. 1977;22:379–383. [Google Scholar]
- 19.Ashitate Y, Kim SH, Tanaka E, Henary M, Choi HS, Frangioni JV, Flaumenhaft R. J Vasc Surg. 2012;56:171–180. doi: 10.1016/j.jvs.2011.11.058. [DOI] [PMC free article] [PubMed] [Google Scholar]
- 20.Gioux S, Choi HS, Frangioni JV. Mol Imaging. 2010;9:237–255. [PMC free article] [PubMed] [Google Scholar]
- 21.Choi HS, Ashitate Y, Lee JH, Kim SH, Matsui A, Insin N, Bawendi MG, Semmler-Behnke M, Frangioni JV, Tsuda A. Nat Biotechnol. 2010;28:1300–1303. doi: 10.1038/nbt.1696. [DOI] [PMC free article] [PubMed] [Google Scholar]
- 22.Choi HS, Ipe BI, Misra P, Lee JH, Bawendi MG, Frangioni JV. Nano Lett. 2009;9:2354–2359. doi: 10.1021/nl900872r. [DOI] [PMC free article] [PubMed] [Google Scholar]
Associated Data
This section collects any data citations, data availability statements, or supplementary materials included in this article.


