
Figure 2. Individual sample plot.
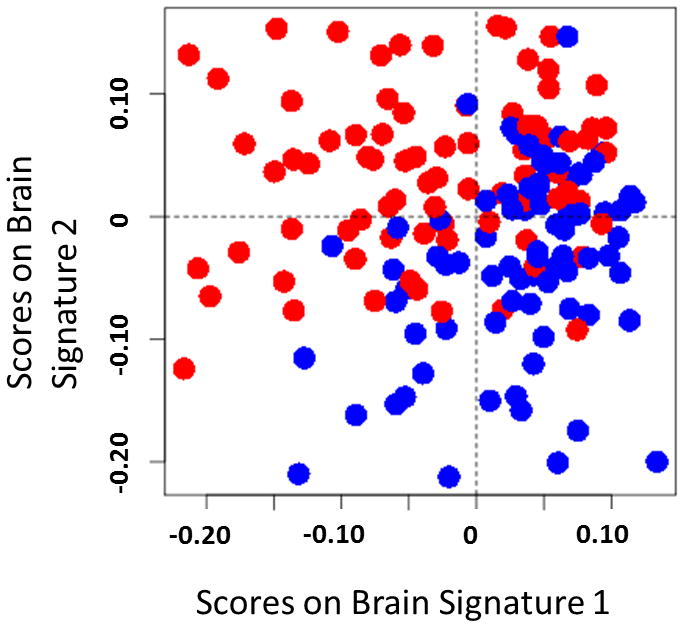
Irritable bowel syndrome (red) and healthy control (blue) are represented as point placed according to their scores on the two brain signatures derived from a sparse partial least squares-discriminative analysis. This plot suggests group discrimination can be obtained with the morphological classifier.