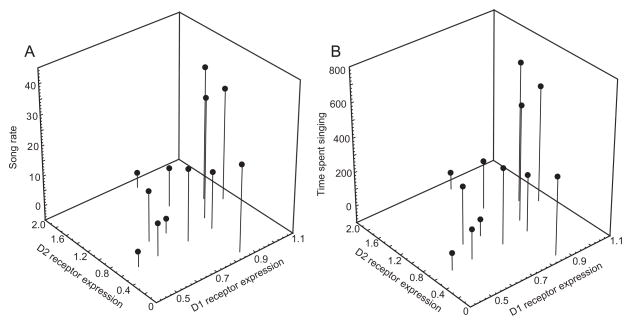
Figure 4.
Singing behavior relates positively to D1 expression and negatively to D2 expression in POM. 3-D Scatterplots illustrating relationships between song rate (A) and time spent singing (B) and D1 and D2 dopamine receptor expression in POM. Each point represents data from a single individual (the same individuals highlighted by filled points in Figure 3). Analyses were run on square root transformed singing data, but raw data are shown here.

