

Abstract
Diffusion imaging can assess the white matter connections within the brain, revealing how neural pathways break down in Alzheimer's disease (AD). We analyzed 3‐Tesla whole‐brain diffusion‐weighted images from 202 participants scanned by the Alzheimer's Disease Neuroimaging Initiative–50 healthy controls, 110 with mild cognitive impairment (MCI) and 42 AD patients. From whole‐brain tractography, we reconstructed structural brain connectivity networks to map connections between cortical regions. We tested whether AD disrupts the “rich club” – a network property where high‐degree network nodes are more interconnected than expected by chance. We calculated the rich club properties at a range of degree thresholds, as well as other network topology measures including global degree, clustering coefficient, path length, and efficiency. Network disruptions predominated in the low‐degree regions of the connectome in patients, relative to controls. The other metrics also showed alterations, suggesting a distinctive pattern of disruption in AD, less pronounced in MCI, targeting global brain connectivity, and focusing on more remotely connected nodes rather than the central core of the network. AD involves severely reduced structural connectivity; our step‐wise rich club coefficients analyze points to disruptions predominantly in the peripheral network components; other modalities of data are needed to know if this indicates impaired communication among non rich club regions. The highly connected core was relatively preserved, offering new evidence on the neural basis of progressive risk for cognitive decline. Hum Brain Mapp 36:3087–3103, 2015. © 2015 Wiley Periodicals, Inc.
Keywords: Alzheimer's disease, mild cognitive impairment, MRI, DWI, rich club, graph theory
Abbreviations
- AD
Alzheimer's disease
- ADNI
Alzheimer's Disease Neuroimaging Initiative
- Cg
Global clustering coefficient
- DTI
Diffusion tensor imaging
- DWI
Diffusion weighted image
- E
Number of edges in network
- eMCI
Early mild cognitive impairment
- EEG
Electroencephalography
- F
Efficiency
- FDR
False discovery rate
- fMRI
Functional MRI
- IR‐FSPGR
Inverse recovery fast spoiled gradient recalled echo
- k
Nodal degree
- kg
Global degree
- L
Characteristic path length
- LH
Left hemisphere
- lMCI
Late mild cognitive impairment
- MEG
Magnetoencephalography
- MMSE
Mini Mental State Examination
- MRI
Magnetic resonance imaging
- NS
Not significant
- N
Number of nodes in network
- PET
Positron emission tomography
- R
Rich club coefficient
- Rn
Normalized rich club
- Rr
Randomized rich club
- RH
Right hemisphere
- ROI
Regions of interest
- rs‐fMRI
Resting state functional magnetic resonance imaging
- SNR
Signal‐to‐noise ratio
- SPGR
Spoiled gradient echo
- WB
Whole brain
INTRODUCTION
Studies of the human connectome are increasingly popular for investigating the patterns of disruption in the structure and function of the diseased brain. At macroscopic level, the field of “connectomics” [Toga et al., 2013; Engel et al., 2013] employs data from structural imaging, such as diffusion weighted imaging (DWI), or functional imaging, including resting state functional MRI (rs‐fMRI), and analysis methods from graph theory – a branch of mathematics that models the topological organization of the brain's networks [Rubinov and Sporns, 2010]. These forms of analysis are beginning to be applied to neurological diseases [Daianu et al., 2012; van den Heuvel et al., 2013; Daianu et al., 2013, 2014a, 2014b, 2014c] based on the notion that brain dysfunction may originate from abnormal overall organization of the brain network [van den Heuvel et al., 2013].
Alzheimer's Disease (AD) is a progressive, degenerative neurological disease and is the 6th leading cause of death in the US [Alzheimer's Association, 2014]. In the U.S. alone, over 5 million people live with the disease and this number is expected to triple by 2050 [Alzheimer's Association, 2014] increasing health care costs by as much as 85% [Bruner and Jacobs, 2013]. Worldwide, 44 million people have the disease [Alzheimer's Association, 2014]. As the elderly population increases, over 115 million people may have AD by 2050 [Alzheimer's Association, 2014]. AD leads to a severe decline in multiple cognitive domains, particularly memory [Filippi et al., 2012]. This may occur due to progressive deposition of beta‐amyloid and tau proteins in the brain that lead to inflammation, neural atrophy and cell death [Wang et al., 2012]. These processes affect the brain's gray matter, leading to extensive cortical and subcortical gray matter atrophy.
Recent studies with DWI reveal widespread disease effects on the brain's white matter [Clerx et al., 2012; Nir et al., 2013; Jahanshad et al., 2012]. The spread of white matter degeneration may be due in part to Wallerian or “backward”neurodegeneration, in which gray matter atrophy leads to axonal degeneration [Coleman, 2005; Ewers et al., 2012]. White matter changes such as myelin degeneration [Braak and Braak, 1996], neuroinflammation and abnormal axonal transport are found in AD patients [Rowley et al., 2013]. As white matter fiber tracts lose axons and myelin degenerates, T2‐weighted MRI scans are often used to evaluate white matter hyperintensities – a sign of cerebrovascular disease. The breakdown of the brain's fiber networks in AD has been demonstrated in brain connectivity studies [Stam et al., 2007; Buckner et al., 2009; Brown et al, 2011; Daianu et al., 2012; Nir et al., 2012a, 2012b; Daianu et al., 2013; Li et al., 2013; Prasad et al., 2013a; Daianu et al., 2014a, 2014b, 2014c, 2015a, 2015b], and can help understand how AD progresses.
DWI is increasingly used [Mori and van Zijl, 2002; Basser and Jones, 2002] to study fiber integrity and microstructure, based on indices such as the mean diffusivity and fractional anisotropy of local water diffusion [Clerx et al., 2012]. Furthermore, diffusion‐based tractography can infer patterns of structural connectivity and is one of the primary quantitative methods to study the 3D course of long fibers (i.e., neural pathways) in the human brain [Axer et al., 2010; Jin et al., 2013, 2014, 2015]. Cortical connectivity networks, reflecting the extent and degree to which various cortical regions are connected to each other, may be represented as a graph of nodes describing cortical regions and the neural pathways (or “edges”) that connect them [Sporns, 2011; van den Heuvel et al., 2013]; the same data may be stored in a 2D matrix. This allows mathematical metrics to be used to describe the topology of the brain's networks, and the connectedness of key nodes.
DWI has been added to several large‐scale neuroimaging studies, including the Alzheimer's Disease Neuroimaging Initiative (ADNI) [Jack et al., 2010], to monitor white matter deterioration using metrics not obtainable from standard anatomical MRI. Here, we analyzed brain networks in 50 healthy controls, 110 people with mild cognitive impairment (early MCI, or eMCI, and late MCI, or lMCI), and 42 AD participants using recently proposed mathematical metrics, such as the rich club coefficient; the rich club is a phenomenon that is present when highly connected nodes (also called hubs) in the brain are more connected among themselves than predicted by chance [van den Heuvel and Sporns, 2011; van den Heuvel et al., 2013]. To the best of our knowledge, this is the first study to assess the structural rich club effect in MCI and AD as compared to healthy elderly. To complement our analysis, we evaluated additional metrics: nodal degree, clustering coefficient, characteristic path length, and efficiency. The motivation for the study was to detect unique connectome changes that distinguish AD brains from cognitively healthy brains by examining the wiring of the white matter bundles using network measures. The rich club coefficient, among other connectivity metrics, may become potential biomarkers of AD, complementing standard, more widely accepted measures.
Here, we showed that using brain connectivity tools, we could describe specific connectome changes in AD as indicated by the disrupted rich club coefficient and abnormal network effects (assessed with measures nodal degree, clustering coefficient, characteristic path length, and efficiency) suggesting an overall, or global, reduced brain network connectivity. These findings distinguish AD from other disorders reporting on connectome disruptions. As described by van den Heuvel and colleagues in a rich club analysis on schizophrenia, the severe psychiatric disorder was associated with characteristic hub (or nodal) changes in connectivity [van den Heuvel et al., 2013], as opposed to global changes as seen here in AD. We ranked the rich club coefficients and its directly related terms, to see which measures had the largest effect size in distinguishing disease vs. healthy elderly white matter differences. These measures, computed at a wide range of nodal degree thresholds, reveal the altered brain dynamics and potentially disrupted communication among non rich club (low‐degree) cortical regions of the brain, as well as a relatively preserved densely interconnected rich club core in patients with MCI and AD.
METHODS
Participants and Diffusion‐Weighted Imaging of the Brain
We analyzed DWIs from 202 participants scanned as part of the ADNI. ADNI is a large multisite longitudinal study to evaluate biomarkers of AD. Table 1 shows the demographics of the participants we studied including age, sex, and the Mini Mental State Exam (MMSE) scores, broken down by diagnosis. All 202 participants underwent whole‐brain MRI on 3‐Tesla GE Medical Systems scanners, at 16 sites across North America. Standard anatomical T1‐weighted IR‐FSPGR (inverse recovery fast spoiled gradient recalled echo) sequences were collected (256 x 256 matrix; voxel size = 1.2 x 1.0 x 1.0 mm3; TI = 400 ms, TR = 6.984 ms; TE = 2.848 ms; flip angle = 11°) in the same session as the DWI (128 x 128 matrix; voxel size: 2.7 x 2.7 x 2.7 mm3; scan time = 9 min). 46 separate images were acquired for each scan: 5 T2‐weighted images with no diffusion sensitization (b0 images) and 41 DWIs (b = 1000 s/mm2). This protocol was chosen after comparing several different DWI protocols for ADNI, to optimize the signal‐to‐noise ratio in a fixed scan time [Jahanshad et al., 2010; Zhan et al., 2013; Zhan et al., 2014a, 2014b].
Table 1.
Demographic information about study participants
| Controls | eMCI | lMCI | AD | Total | |
|---|---|---|---|---|---|
| N | 50 | 72 | 38 | 42 | 202 |
| Age | 72.6 ± 6.1 SD | 72.4 ± 7.9 SD | 72.6 ± 5.6 SD | 75.5 ± 8.9 SD | 73.1 ± 7.4 SD |
| MMSE | 28.9 ± 1.4 SD | 28.1 ± 1.5 SD | 26.9 ± 2.1 SD | 23.3 ± 1.9 SD | 27.1 ± 2.7 SD |
| Sex | 22M/28F | 45M/27F | 25M/13F | 28M/14F | 120M/82F |
| N sites | 10 | 16 | 12 | 12 | 16 |
Demographic information from 50 controls, 72 eMCI, 38 lMCI, and 42 AD participants scanned with diffusion MRI as part of the ADNI project. Their ages ranged from 55.2 to 90.4 years. The mean age and Mini Mental State Exam (MMSE) scores are listed for each diagnostic group. Participants were scanned at 16 different sites.
Image Analysis and Structural Connectivity
Tractography based on DWIs may be used in conjunction with an automatically labeled set of cortical or subcortical regions from anatomical MRI to map connectivity and perform network analysis of the brain's fiber connections [Jahanshad et al., 2012; Jahanshad et al., 2011; Ingalhalikar et al., 2013; Zhan et al., 2013]. Connectivity matrices were compiled using a processing pipeline described previously [Jahanshad et al., 2011; Braskie et al., 2012; Jahanshad et al., 2012; Nir et al., 2012a; Nir et al., 2012b]; this is detailed in the Supporting Information section.
Briefly, we calculated orientation distribution functions (ODFs) reconstructed using the constant‐solid angle method [Aganj et al., 2010] and performed tractography as described in [Aganj et al., 2011] on the sets of linearly registered DWI volumes. Each subject's dataset contained ∼10,000 useable curves corresponding to fiber estimates after filtering short fibers < 15 mm which may correspond to noise. In parallel, 34 cortical labels per hemisphere, from the Desikan‐Killiany atlas [Desikan et al., 2006] (Table SI), were automatically extracted from all aligned T1‐weighted structural MRI scans using FreeSurfer version 5.0 (http://surfer.nmr.mgh.harvard.edu/) [Fischl et al., 2004]. The resulting T1‐weighted images and cortical models were linearly aligned to the space of the DWIs and the DWIs (and resulting tracts) were further elastically registered to the T1‐weighted image to account for susceptibility artifacts (we assume that the T1‐weighted scan serves as a relatively undistorted anatomical reference).
Combining the white matter tractography and the cortical parcellations, fiber bundles connecting each pair of regions of interest (ROIs) were detected. From this, a 68×68 connectivity matrix was created, 34 ROIs in each hemisphere (Table SI), for each subject. Each element described the estimated proportion of the overall set of detected fibers in that subject, passing through each pair of ROIs. In this article, we use the word fiber to denote a single curve, or streamline extracted via tractography; as not all cortical regions are connected to each other, if no participants had detected fibers connecting two regions (i.e., all participants had a 0 count at a specific matrix element), then that connection was considered invalid and was not included in the analysis.
Brain Network Measures
Topological changes in the brain networks may be analyzed using graph theory, which represents the brain connections as a set of nodes and edges. The network nodes are typically defined as ROIs, in our case on the cortex, segmented from anatomical MRI. In DWI studies, these network nodes are linked by edges [Sporns, 2011] that can be either binary (1 if connection exists and 0 otherwise) or weighted, with weights denoting some measure of connectivity between the two regions, such as the density or integrity of fiber tracts connecting the regions. Here, we used binary matrices to compute all network measures. In graph theory, an NxN connection matrix can be compiled to describe the network. A square matrix can represent any network of connections, and may also be displayed as a graph, i.e., a discrete set of nodes and edges [Sporns, 2011].
The most basic measure to describe the connectedness of the connectivity matrix is the nodal degree, k – the number of edges that connect to a node. Here, the nodal degree was averaged over all cortical areas to output the global degree. The nodal degree is one factor involved in calculating the k‐core network and rich club coefficient, and is important to consider when interpreting other measures that depend on it [Prasad et al., 2013a, 2013b]. The nodal degree serves as a threshold for defining the largest subgraph with mutually and highly interconnected central structural cores as part of the brain network, using a k‐core decomposition algorithm (for a detailed definition, please see Supporting Information). For example, to compute the “16‐core” (k = 16) of the connectivity matrix, all nodes contained in a subgraph with a degree 16 or higher would be retained while all other connections with degree lower than 16 would be removed (set to zero). To explain further, this indicates that at k = 16, nodes in the subgraph are connected to at least 24% of the other 67 nodes from the original network (16/67 = 24%, while at 100% one node connects to all 67 other nodes in the network). These degree thresholded nodes can be saved under a 68×68 matrix (the same size as the whole brain's connectivity matrix); it is expected that nodes that participate in high‐degree subgraphs in the network are resistant to the erosive k‐core decomposition method [Alvarez‐Hamelin et al., 2006; Hagmann et al., 2008].
Next, we computed the rich club coefficient, R, for each subject's anatomical network at a range of k‐value thresholds (i.e., k = 1–22 or 1–33%); we explain the choice of the cutoff in the next paragraphs. R is the ratio of the number of connections among nodes of degree k or higher versus the total possible number of connections if those nodes were fully connected. This is defined as the fraction of edges, E, that connect nodes, N, of degree k or higher over a range of k‐values:
| (1) |
As higher‐degree nodes are more likely to be interconnected with each other than simply by chance, R is typically normalized. Here, the rich club coefficient, R r, was also calculated in 100 randomized networks of equal size and similar connectivity distribution and was used to normalize our true networks and obtain the normalized rich club coefficient, R n (Fig. 1):
| (2) |
Figure 1.
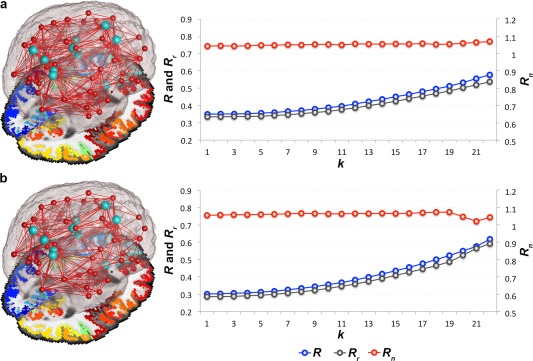
Rich club organization. Average rich club (R), randomized rich club (R r) and normalized rich club (R n) coefficients computed in the brain networks of a. healthy controls and b. AD participants across a wide range of nodal degree k‐value thresholds (k = 1–22). R is assessed on the brain networks of all participants at each k, and normalized (to obtain R n) using R r computed from random networks of the same size and similar degree distribution as the original brain networks. Light blue nodes in the 3D networks represent the rich club hubs discussed throughout this study, also included in Figure 2. [Color figure can be viewed in the online issue, which is available at http://wileyonlinelibrary.com.]
Random networks are constructed from a disconnected set of nodes [Sporns, 2011] with the same size and similar nodal degree as the true brain network being randomized. Tests of the rich club effect use randomized networks to create a reference null distribution [van den Heuvel and Sporns, 2011]. It is important to do this as the absolute value of the coefficient varies greatly with the size and density of individual graphs, so it provides only limited information on network integration [Sporns, 2011]. In this dataset, R n must be greater than 1 to indicate the presence of a rich club organization in the brain networks. These networks are known to form small‐world organizations defined by high levels of clustering and low path length [van den Heuvel and Sporns, 2011; Nir et al., 2012a; Daianu et al., 2013]; whereas the random networks, although of the same size and similar nodal distribution, tend to have a low clustering coefficient and short path lengths [Sporns, 2011]. Therefore, these are expected to lead to a lower R than in the brain networks of either healthy or diseased participants – hence the expectation for R n > 1.
Here, we analyzed the whole‐brain networks in all participants. We included similar analyses for the left and right hemispheric networks in Supporting Information. Rich club subnetworks, as described throughout the study, were set at a high‐degree k‐value level (k > 15), as previously reported [van den Heuvel et al., 2013]. In our study, this threshold indicates that each node in the subnetwork must be connected to more than 22% nodes from the whole brain network. We only reported k levels at which the rich club effect was detected in all diagnostic groups across most participants; for <4% of participants, the R n was not detectable at high‐degree k > 22 levels in the whole brain networks, and therefore, was marked as zero, which eventually decreased the average R n below 1, and hence, defined our cutoff of k = 22 for observation. A rich club can be undetectable at high levels of k due to a low number of connections or noisy data, which is a phenomenon observed in diseased participants [Daianu et al., 2013].
First, we tested for diagnostic group differences (AD vs. controls and MCI vs. controls) for R at each nodal degree k‐value in the whole brain networks. The same analyses were performed for R n. The individual components comprising the rich club – N and E, were also evaluated for specificity. To compute the group differences, we used a random effects regression, with controls coded as 0 and the diagnostic groups, each assessed individually (i.e., MCI or AD) coded as 1, controlling for age, sex, and brain volume and used scanning site as the random grouping variable (as was done in previous ADNI‐DTI works to remove biases due to site‐dependent covariance). We used the false discovery rate procedure (FDR) to correct for the multiple tests performed across all k‐levels. We report the critical FDR P‐value, or the highest P‐value that ensures control of the false discoveries at 0.05. The higher the critical P‐value (the closer to 0.05), the greater the effect of the test as a whole, and often the more tests can be reported as significant. The rich club effect detected network differences among healthy and diseased participants, so we also tested if it was sensitive enough to detect network differences between MCI subtypes – 72 eMCI and 38 lMCI compared to healthy elderly. Also, we tested for more subtle differences, between lMCI and eMCI, AD and eMCI and finally, AD and lMCI across the whole brain, left and right hemisphere brain networks. We included these results in the Supporting Information.
Second, we assessed R with relation to the MMSE scores and age to test if we were better powered to predict a more quantitative score in the whole group of 202 participants (rather than just a binary diagnosis), and to test whether the rich club differed with age. For age association tests, we covaried for sex, brain volume, and diagnosis as a fixed effect and used imaging site as a random‐effects variable; Diagnosis (D) was coded using 2 dummy variables: AD were coded as “1” for both Disease (D1) and Dementia (D2); MCI were coded as “1” for D1 and “0” for D2; Controls were coded as “0” for D1 and D2. For the associations with MMSE scores, we also a ran random effects regression and covaried for age, sex, and brain volume. R n was analyzed in similar fashion. Using a similar set up, we tested for any association of age and MMSE scores with the global degree at k‐values k = 1–22 in the whole brain of all participants.
To better understand the alterations in the cognitively impaired individuals as determined by the rich club evaluation, we also computed more standard network measures including global degree, normalized clustering coefficient, characteristic path length, and efficiency. We reported the added measures on the same range of k‐values for which the rich club coefficients were evaluated (k = 1–22) to complement the rich club effect at all cutoffs. By doing so, we could compare and rank the global measures across the entire k‐value range (as described below), and detect if the supporting standard metrics were altered across select k‐levels or the entire regime. At a particular k‐level, the global degree, , averaged across all n (68) nodes is computed as:
| (3) |
where is the degree of a node i, and is a connections status between nodes i and j ( if nodes i and j are connected and otherwise) [Sporns, 2011; Daianu et al., 2012]. Here, M is the set of all nodes in the network.
The unnormalized clustering coefficient (C) of a network is a measure of segregation and describes how densely interconnected a node's neighboring nodes are; this is computed as the fraction of a node's nearest neighbors that are neighbors of each other:
| (4) |
where is the clustering coefficient of node i ( , ) [Watts and Strogatz 1998; Sporns, 2011]. C was averaged over all 68 nodes to output a global value (C g).
The characteristic path length (L) is a measure of network integration, computed as the total number of edges that need to be traversed to get from one node to the other:
| (5) |
where is the average distance between node i and all other nodes, is the shortest path length [Watts and Strogatz 1998; Sporns, 2011].
Global efficiency (F) is computed as the inverse of the average of the path length:
| (6) |
To normalize the measures, we compared the observed values to an average calculated from 50 randomized networks of equal size and similar connectivity distribution; we determined that 50 random networks were enough to stabilize the metrics (the outputs had the same distribution to when we used 100 random networks). It can help to normalize these rather unstable graph theory metrics, such as C, L, and R, as their absolute value provides limited information on network integration in the brain [Sporns, 2011]. Statistically, we performed the same analyses as described above for the rich club effect and its factors, N and E. We ran random effects regression to test for differences for each graph theory metric between healthy elderly and the diagnostic groups; analyses between eMCI and healthy elderly, lMCI and healthy elderly, lMCI and eMCI, AD and eMCI and AD and lMCI participants are included in the Supporting Information, as the results from left and right hemispheric networks.
Finally, we ranked all 8 global measures (R n , R, N, E, k g , L, F, Cg) in order of their effect size as a function of the t‐values, as output by the random effects regression run between the diagnostic groups, and the degrees of freedom computed as the total number of participants within each test minus 2:
| (7) |
Here, r is the effect size correlation coefficient computed with the t‐values obtained from a between diagnostic group random effects regression and the degrees of freedom (d.f.).
At each k‐level, we computed the average P‐values and effect sizes for all 8 measures and selected the k with the minimum average P‐value and effect size to further rank all 8 global measures at that particular threshold.
RESULTS
Effect of Normalizing the Rich Club Coefficient, R
The rich club effect was assessed across a wide range of nodal degree thresholds, k, to define the densely interconnected subnetworks of the brain in healthy controls and patients. These subnetworks included both intra‐ and interhemispheric1 connections among which the intrahemispheric connections made up most of the edges analyzed in this study. In Figure 2, we illustrate the average brain networks in each diagnostic group and how the edges interconnecting cortical regions of the brain are peeled off more readily in patients (MCI and AD participants), than in healthy elderly at incremental k‐levels (k = 0, 8, 16, and 20). This phenomenon led to an increase in R over an increasing range of k‐values in the whole brain of all participants (Fig. 3) and this is explained in detail in the Discussion section. Also, R n was increasingly greater than 1 for a stable range of k levels, which indicates that a rich club organization was detectable in most participants. R n is plotted for all values of the nodal degree threshold, k, including at the first k‐value where a rich club effect was no longer detectable (R n < 1). All significant P‐values are listed in Table 2.
Figure 2.
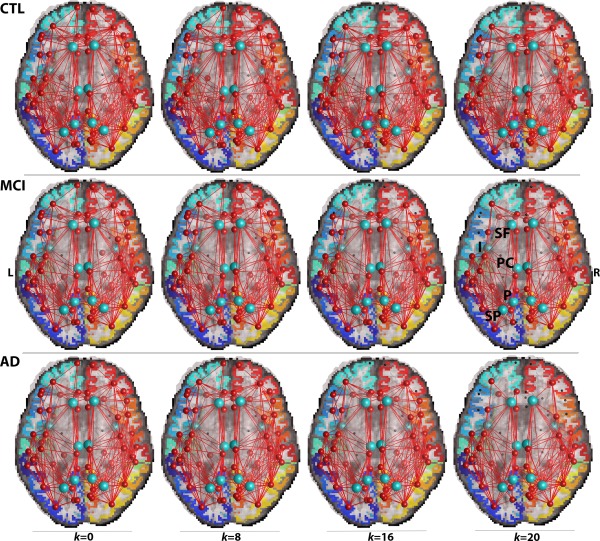
Average brain networks thresholded at nodal degree k = 0, 8, 16, and 20 showing common connections in 90% of healthy controls (CTL) (top row), MCI (middle row), and AD (bottom row) participants. At k = 0, where no nodal degree thresholding is applied, the original brain networks include all non rich club and rich club components of the connectome. As the nodal thresholding levels increase, edges (connections between ROIs), and individual nodes (ROIs) are removed. The diseased networks are less resistant to the erosive thresholding decomposition of the network's components, and the centrally positioned hubs (light blue nodes) are preserved in the diagnostic groups. These hubs are the superior frontal (SF), insula (I), posterior cingulate (PC), precuneus (P), and superior parietal region (SP). [Color figure can be viewed in the online issue, which is available at http://wileyonlinelibrary.com.]
Figure 3.
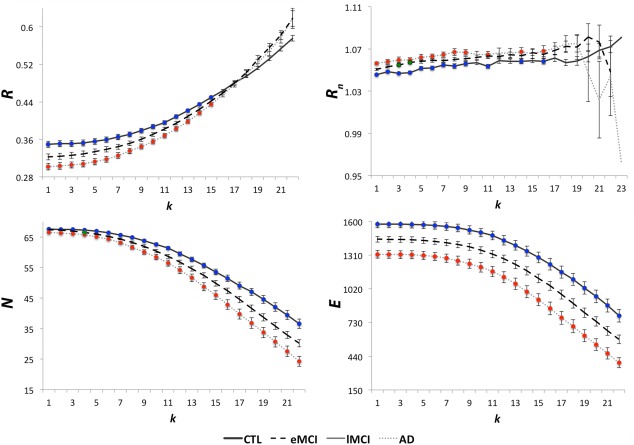
Average unnormalized and normalized rich club coefficients, R and R n, average number of nodes, N, and average number of edges, E, in the whole brain networks of healthy controls (CTL), MCI and AD participants. R is significantly lower in AD participants (red), relative to controls (blue), in the low‐degree k‐value regime (k < 16). R n increased in AD, relative to controls, mostly in the low‐degree regime (red). Similarly, R n was higher in MCI (green), relative to controls. N and E were lower and declining in MCI and AD participants, relative to controls, as plotted. These suggest that the low‐degree k‐value regime is more affected than the high‐degree regime in patients, so overall – the rich club networks may be relatively spared in disease. Colored dots show where significant differences were found. Error bars are the standard error computed at each k level for all participants. FDR corrected P‐values are listed in Table 2. [Color figure can be viewed in the online issue, which is available at http://wileyonlinelibrary.com.]
Table 2.
Diagnostic group differences for global network measures
| Network measures | FDR critical P‐values | |
|---|---|---|
| MCI vs. CTL | AD vs. CTL | |
| R | NS | 0.01 |
| k = 1–15 | ||
| N | 1.8 x 10⁻³ | 1.9 x 10⁻³ |
| k = 4 | k = 1–22 | |
| E | NS | 2.7 x 10⁻³ |
| k = 1–22 | ||
| Rn | 3.8 x 10⁻³ | 0.020 |
| k = 3,4 | k = 1–9, 11, 14, 16 | |
| kg | 0.049 | 6.5 x 10⁻⁶ |
| k = 1–22 | k = 1–22 | |
| Normalized Cg | 0.035 | 1.0 x 10⁻⁵ |
| k = 1–16 | k = 1–20 | |
| Normalized L | 0.039 | 4.7 x 10⁻³ |
| k = 1–20 | k = 1–20 | |
| F | 0.049 | 5.1 x 10⁻⁶ |
| k = 1–22 | k = 1–22 | |
FDR critical P‐values (in bold) are shown after fitting a random effects regression model to these network measures: rich club coefficient (R), normalized rich club coefficient (R n), total number of nodes (N), and edges (E), global degree (k g), global normalized clustering coefficient (Cg), normalized characteristic path length (L) and efficiency (F), computed at nodal degree thresholds, k = 1–22, in the whole brain to test for diagnostic group differences between controls (CTL) and MCI, and separately AD participants (with controls coded at 0 and disease coded at 1). We covaried for sex, age, and brain volume and used site as a random regression variable. k levels where significant differences were found are included or are marked as not significant (NS).
In the whole brain network, R was significantly lower in AD, than in controls, at low‐degree k levels, k = 1–15 (Fig. 3, Table 2), but no significant differences were detected for R between controls and MCI participants at any k‐levels. At high‐degree values of k (k > 15), where a rich club exists, there is a large reduction of nodal connections in the network, so properties can greatly differ from those seen in the lower regime. The main terms involved in the rich club coefficient formula, N and E, also showed group differences. N declined and was lower in AD, than in controls, in the whole brain across the entire k‐value regime, at k = 1–22, and at k = 4 in MCI. E declined and was lower in AD participants, than in controls, in the whole brain networks at k = 1–22. As shown in Figure 3, R n was significantly higher in AD participants, relative to controls, but mostly at low‐degree k‐levels, k = 1–9, 11, 14, and 16 in the whole brain (Table 2). R n was also higher in MCI participants versus controls at k = 3, 4.
Rich Club Changes With Age and Cognitive Decline
Age and MMSE scores were associated with the rich club coefficients, for both R and R n. R decreased with age, while R n increased with age at particular k‐values in the low‐degree regime (k < 16) for the whole brain. FDR critical P‐values are listed in Table 3. Among the high‐degree k‐values that pertain to the rich club network (k > 15), R increased with age but only at select k‐values in the whole brain (Table 3, Fig. 4). As MMSE scores declined, R also declined, but R n increased, again, among the low‐degree nodes in the k‐value range.
Table 3.
FDR critical P‐values (bold) for Age and MMSE score associations with the rich club effect and global degree.
| R | Rn | kg |
|---|---|---|
| Age associations | ||
| 0.032 | 1.8 x 10⁻³ | 7.0 x 10⁻⁸ |
| age⇑, R⇓, for k = 1–11, 13, 14 | age⇑, Rn⇑, for k = 1–7, 9–12 | age⇑, kg⇓, for k = 1–22 |
| age⇑, R⇑, for k = 18–22 | ||
| MMSE Score Associations | ||
| 0.031 | 0.018 | 2.5 x 10⁻⁵ |
| MMSE ⇓, R⇓, for k = 1–13 | MMSE ⇓, Rn⇑, for k = 1–5, 7–9 | MMSE⇓, kg⇓, for k = 1–22 |
Statistically significant associations at select k‐levels for the unnormalized and normalized coefficients, R and R n, and global degree, k g, with age and MMSE scores using a random effects regression in the whole brain in all 202 participants as shown in Figure 4. In the rich club, R increased with age and decreased with declining MMSE scores in the non rich club network; R also increased with age, independent of disease, in the rich club. R n increased with age and declining MMSE scores in the non rich club network; finally, k g decreased with age and with increasing MMSE scores. ⇑ indicates an increase, while ⇓ indicates a decrease.
Figure 4.
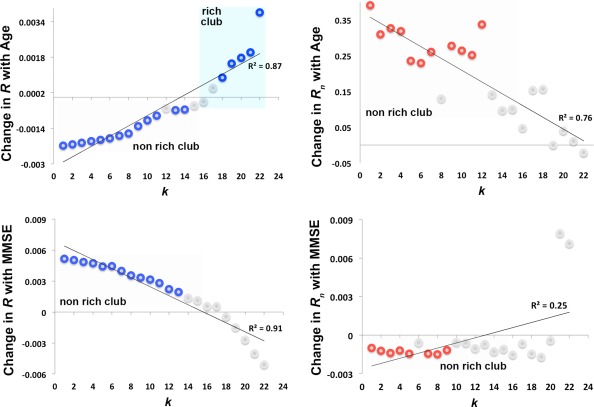
Age and MMSE score associations with the rich club effect. Change in the unnormalized and normalized coefficients, R (blue) and R n (red), with age and MMSE scores using a random effects regression in the whole brain in all 202 participants. We covaried for sex, brain volume and diagnosis as a fixed effect for the age associations; and sex, age, and brain volume for the associations with MMSE scores; we used site as a grouping variable for the random effects regression. Change is defined as the slope of the regression at each k (k < 16 defined the non rich club network and k >15 defined the rich club). Colored circles indicate k‐levels where R and R n significantly decreased (negative slope) and increased (positive slope) with age and MMSE scores. Gray circles indicate k‐values where no significant association was found. FDR critical P‐values are in Table 3. [Color figure can be viewed in the online issue, which is available at http://wileyonlinelibrary.com.]
As the rich club effect depends on the network degree (i.e., number of edges that connect to a node), we also assessed if there was a general trajectory of the association with age and MMSE scores on k g at all corresponding k‐values. We found that k g decreased with age and declining MMSE scores across the entire k‐value regime (Table 3). These findings support the trajectory of association between R and MMSE scores, indicating a lower number of edges in low‐degree nodes in patients, which ultimately affects the rich club coefficient.
Other Global Brain Metrics, k g , Cg, L and F Applied at a Range of Nodal Degree Thresholding Levels, k
To interpret the rich club effects in the diagnostic groups, we computed some of the most commonly used, more basic graph theory metrics across the entire k‐value regime of each subject, in the whole brain networks. In Figure 5, we illustrate the nodes and edges that the supporting metrics were computed on. These were assessed across the entire k‐core regime to observe how they change during the erosive decomposition process. Furthermore, measures computed for each diagnostic group, MCI and AD, were compared to measures in healthy elderly at each k (Fig. 5). Differences in measures not reported below did not significantly differ among diagnostic groups and are marked ‘not significant’ in Tables 2. More results are reported in Supporting Information.
Figure 5.
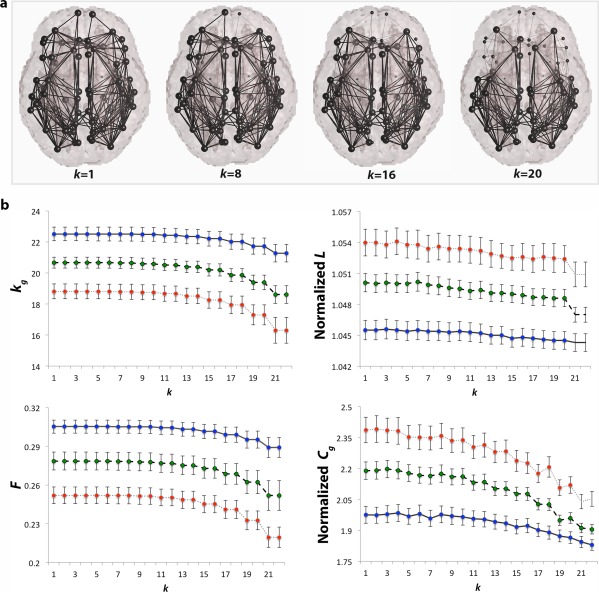
Other network measures. a. Brain networks indicated by thick edges used to compute all supporting graph measures; removed connections (thin edges) are not included in the computation of the network measures as nodal k‐levels increase; b. average global degree (k g), normalized clustering coefficient (Cg), normalized characteristic path length (L), and efficiency (F) computed in controls (CTL, blue), MCI (green), and AD participants (red) over the entire k‐value regime (k = 1–22) in the whole brain networks. As expected, all network measures declined as a function of k in AD and MCI, relative to controls at most k‐levels. Assessed over the entire k‐value regime, these indicate that AD may involve a disruption in the global connectivity of the brain, rather than network topology. Colored dots on the curves indicate that a group difference between CTL and diseased participants was detectable at that value of k. Error bars are the standard error computed at each k level for all group participants. FDR critical P‐values are listed in Table 2. [Color figure can be viewed in the online issue, which is available at http://wileyonlinelibrary.com.]
k g: As the network threshold (k) increased and more low‐degree nodes were removed, k g declined in both AD and MCI across the entire k‐value regime in the whole brain, relative to healthy elderly. This is expected and has been previously shown in a study by Daianu and colleagues [Daianu et al., 2014a].
Normalized Cg: The normalized Cg also showed indications of disease differences in the network architecture of the whole brain. This measure is expected to be lower in disease when unnormalized and greater when normalized (using random networks), relative to healthy participants, as the nodal connections in the network drop drastically. Note that random networks are known to have short path length and lower levels of clustering than observed in human networks (oftentimes C from random networks < 1) [Sporns, 2011]; C from random networks are used to normalized C computed on brain networks, therefore, leading to an increased in the normalized Cg. A recent study supports this hypothesis and showed a decreased C in structural networks of 32 AD participants, relative to 50 healthy elderly [Reijmer et al., 2013]. Normalized Cg was higher in MCI at k = 1–22 and AD participants at k = 1–20 in the whole brain, relative to controls.
Normalized L: Normalized L is expected to be greater in disease, relative to controls, as the diseased networks of the brain lose complexity (i.e., significant drop in the number of edges detected in patients). A higher normalized L means that a greater number of edges must be traversed to get from one node to another. Presumably, shorter paths are advantageous, along with high levels of clustering, to form small‐world networks that characterize the topology of the brain [Sporns, 2011]. Here, the normalized L was significantly higher in MCI and AD participants at k = 1–20, relative to controls.
F: With disease progression, a decline in F is expected, as L increases (efficiency is an approximate inverse of the network path length). This is in line with recent studies that showed decreased local efficiency in structural networks of 32 AD participants, relative to 50 healthy elderly participants, however, no significant patterns were found for global efficiency [Reijmer et al., 2013]. Here, F declined (as the network threshold, k, increased) in all diagnostic groups and was significantly lower in the whole brain at k = 1–22 in MCI and AD, relative to controls.
Ranking the 8 Brain Network Measures
We ranked the 8 brain global network measures in the order of largest effect size at a k‐level, k = 4, to indicate the sensitivity of each measure for detecting brain network alterations between diagnostic groups (Fig. 6). At k = 4, we determined that the average P‐value and r computed across all 8 global measures were the lowest in diagnostic comparisons between AD and controls, as well as MCI and controls. By analyzing the subnetworks of the brain thresholded at degree k = 4, we were able to assess a less sparse network (where nodes must have a nodal degree ≥ 4) that includes both low‐ and high‐degree nodes. The largest effect size for these measures was detected in AD vs. controls comparisons, while for MCI vs. controls comparisons, the effects dropped by more than half. Effect sizes were categorized based on large (r = 0.5), medium (r = 0.3), and small effect size coefficients (r = 0.1). For all other diagnostic group comparisons, including left and right hemisphere analyses, please see Supporting Information.
Figure 6.
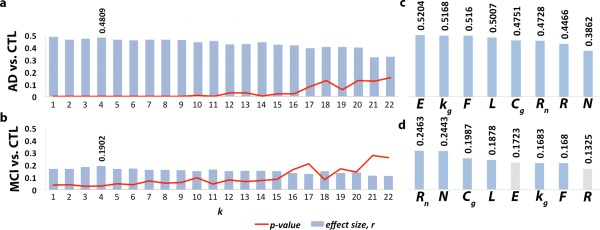
Network measures in order of their effect size for detecting differences in AD vs. controls (CTL), and MCI vs. CTL comparisons. 8 global network measures were ranked: unnormalized and normalized rich club coefficient (R and R n), total number of nodes (N) and edges (E), global degree (k g), normalized clustering coefficient (Cg) and path length (L) and efficiency (F). Effect sizes were assessed using an effect size correlation coefficient, r, at nodal degree level k = 4, where the lowest P‐values and highest r were found for all 8 measures across the entire P‐value regime in a. the AD vs. controls and, b. MCI vs. controls comparisons. c. One of the network components with largest effect size in the AD vs. controls comparisons was E due to the loss in edges in the low‐degree k‐value regime in AD patients; d. in contrast, global measures detected approximately half as large effect sizes in the MCI vs. controls comparisons. Gray bars indicate that measures did not detect significant differences. [Color figure can be viewed in the online issue, which is available at http://wileyonlinelibrary.com.]
E, k g, and F gave the largest effect size in the AD vs. controls comparisons (r = 0.52) followed by L (r = 0.50), Cg, and R n (r = 0.47). Medium to large effect sizes were computed for R (r = 0.45) and N (r = 0.39) (Fig. 6). As illustrated in Figure 2, a significant number of connections are lost in the AD brain networks; hence, measures sensitive to the number of edges (e.g., E) are expected to show greatest effects in detecting disease‐related differences.
For diagnostic group comparisons between all MCI participants and controls, small to medium effects were detected by R n and N (r = 0.25 and 0.24) followed by Cg and L (r = 0.20 and 0.19) and finally k g, and F (r = 0.18) (Fig. 6). No significant differences were detected for R and E between MCI participants and controls. During this stage of the disease, it appears that fewer connections are lost than in AD patients (Fig. 2), as indicated by E – a measure that did not detect differences between the two diagnostic groups, unlike what we observed in the group comparisons between AD and controls.
DISCUSSION
Here, we analyzed structural brain connectivity in cognitively healthy elderly, MCI and AD participants as part of ADNI. We assessed disruptions in the rich club organization in MCI and AD, and to help interpret our results, we analyzed a range of supporting and widely‐used brain connectivity measures: the global degree, global normalized clustering coefficient, normalized characteristic path length and efficiency, in the same diagnostic groups. We ranked the brain network metrics based on their effect sizes for distinguishing structural differences between healthy and diseased participants. Our study had 3 main findings: (1) AD tends to affect the low‐degree brain regions in the network, rather than the high‐degree nodes that form the rich club; (2) supporting measures confirm this phenomenon and show altered binary connectivity across the entire range of network thresholding, k (both low‐ and high‐degree), suggesting that AD is a disease that disrupts the overall (global) connectivity of the brain; (3) the normalized rich club coefficient, R n, was found to have one of the largest effect sizes for detecting MCI vs. controls, as well as AD vs. controls network differences within the low‐degree k‐value regime (non rich club networks); this measure may constitute a potentially powerful metric in studying AD that reveals the mechanisms of altered connectivity in disease and could be used to monitor these newly discovered patterns of disruption specific to AD.
The rich club phenomenon in AD and MCI (Figs. 2, 3) accompanies a global decrease in connectivity and alterations in all supporting metrics (k g, F, L, and Cg) across most of the k‐value regime (Fig. 5). There are decreases in the supporting metrics in AD and MCI, relative to controls, so not all connections contributing to the highly interconnected nodes of the rich club are kept intact during disease. In fact, many low‐degree nodes in AD are more vulnerable to the erosive k‐core decomposition than seen in healthy controls (Fig. 2). Nonetheless, as described by R and R n, the AD network may have a relatively preserved connectivity between edges that link high‐degree nodes to other high‐degree nodes that form the rich club. These findings are described in two key points below.
First, in our diagnostic group comparisons, we found a lower R in the diseased groups (Fig. 3), relative to healthy or less impaired participants, in the lower k‐value regime. The drop in R among impaired participants may be intuitive and is only observed across low‐degree k‐levels where less strongly interconnected brain regions are present to contribute to this effect (i.e., global degree is lower in diseased than healthy elderly). As the k‐levels increase, the low‐degree nodes are peeled off (Fig. 2), and the primary cores of the network are maintained and form a rich club (k > 15). During this process, the rich club effect increases, even in disease (Fig. 3). Defined as the ratio of the total number of edges, E, to the total number of nodes, N(N−1), this property of the rich club effect is explained by its rapidly decreasing denominator, N(N−1). Although the brain networks lose approximately more edges than nodes throughout the thresholding process (Figs. 2 and 3), the denominator, N(N−1), decreased approximately at double the rate relative to the nodal degree, N, leading to a greater loss in the denominator than numerator – hence an increase in R. On the other hand, we observed a higher R n in the impaired groups, relative to the coefficients in healthy or less impaired participants, also in the lower k‐value regime. If in particular the total number of low‐degree node edges is lower in patients, it is expected that from normalization (when the edges are equally distributed over the network), the rich club density as described in Eq. (2) would go up (as observed), rather than down. The higher R n in patients within the low‐degree regime further indicates that the integrity of the rich club networks may be spared in disease.
Second, among the low‐degree k‐value regime (k < 16), R decreased with age and with declining MMSE scores in all participants (Fig. 4 and Table 3), indicating a decrease with age and separately, with disease progression, in the interconnectedness of low‐degree nodes in the subnetworks of the brain. As explained in the first key finding, the rich club curve tends to increase as nodes of the network are peeled off and we also found this to be the case as a function of time – R significantly increased with age (independent of disease) in the rich club networks of all 202 participants (k = 18−22). This does not indicate a more interconnected rich club in aging participants; with age, connections between nodes are more vulnerable to the network decomposition process exposing a rich club network comprised of a reduced E and N. We also found an increase in R n, with increasing age and declining MMSE scores, across the low‐degree k‐value regime. Only proportionally to the rest of the brain did R n increase with age and with declining MMSE scores among non rich club networks. No associations with MMSE scores were detected among the rich club networks (k > 15), so the rich club may be relatively preserved as disease progresses.
These patterns of disruption in the rich club coefficients may be AD specific. To our knowledge, there are no prior studies to have analyzed the rich club effect in AD structural binary brain networks compared to controls, but van den Heuvel and colleagues studied the structural rich club organization in schizophrenic patients and reported a distinctly different rich club effect than healthy controls. They found significant decreases in the diseased rich club networks in 48 patients (rich club range k = 16 to k = 28 across 68 cortical and 14 subcortical regions), relative to 45 healthy controls. This indicates that the disruption of the rich club may depend on disease pathology and may describe a distinct and unique pattern of disruption in the overall organization of the brain's connectome. Prior studies have also shown that the overall structural connectivity of the brain networks in AD is reduced [Daianu et al., 2013], while the left hemisphere in AD may have greater disruptions in connectivity than the right, possibly leading to more left than right hemisphere cortical atrophy [Thompson et al., 2003; Daianu et al., 2013]. In addition, rich club network metrics (R n , E, N) were among the most sensitive (had largest effect sizes) at detecting AD vs. controls and separately, MCI vs. controls differences (Figs. 6 and S5) among low‐degree nodes. Supplementary analyses on left and right hemispheric networks indicate similar patterns of disruption as observed in the whole brain networks and further suggest that the right hemisphere may be less disrupted than the left (Supporting Information).
In prior studies, the brain's rich club includes the most densely interconnected cortical regions, including the precuneus, posterior cingulate, superior parietal, and superior frontal regions, and the insula [Sporns et al., 2007; Zamora‐Lopez et al., 2010; van den Heuvel et al., 2012]. Van den Heuvel and colleagues found these regions to form the central backbone in a rich club analysis using DWI data from 40 healthy participants. Some of these studies used 1,170 cortical parcels [van den Heuvel et al., 2012], and although we used 68 cortical parcels, we also found that the main brain regions to remain relatively unaffected in AD, as part of the rich club, included most of the ones listed above. Supporting this, non human studies of macaque and cat cortex reported the same regions within the top hierarchical module of the densely interconnected brain hub [Sporns et al., 2007; Zamora‐Lopez et al., 2010].
Although we claim that AD shows a global pattern of disruption of the white matter connections with a relatively preserved pattern of connectivity among the most central nodes, this does not mean that some of the hub nodes are not affected at regional level. It has been previously shown, in nodal analyses using weighted measures, that the left hemisphere precuneus, left and right superior parietal, superior frontal, posterior cingulate among other non hub regions had a significantly lower fiber density in AD than controls [Daianu et al. 2013, 2014a, 2014b, 2014c]. Furthermore, a recent study by Crossley and colleagues linked gray matter deficits in MRI data from more than 20,000 subjects and 26 distinct diseases to the topological centrality of the nodes in DWI data from 56 healthy participants. Unlike in our study, they defined their hubs using 401 ROIs delineated on the normal connectome and replicated them using a meta‐analysis of 1,500 task‐related functional studies of healthy participants. They showed that in AD, the hubs of the brain network (e.g., parietal regions) are more likely to be anatomically altered than the non hub regions [Crossley et al., 2014]. Although at local level some of the hubs that constitute the rich club are affected in AD, here, we showed that they are not eliminated from the richly interconnected network as seen, for instance, in frontotemporal dementia (where hub nodes turn into non‐hub nodes due to a very large loss of connections) [Daianu et al., 2014a, 2014b, 2014c].
Structural alterations in the brain network may be more concentrated on hubs due to their higher topological value (larger nodal degree), which is possibly when diseases become symptomatic [Crossley et al., 2014] and more easily detectable with neuroimaging approaches. Hub vulnerability may be caused by a hub‐focused biology of the disease; or some diseases might start in the peripheral nodes and propagate to the central core, causing hubs to become symptomatic [Crossley et al., 2014]. It is not yet clear if hubs are altered due to disease processes that affect the brain globally (i.e., uniformly), or locally – perhaps starting within a hub or in the peripheral nodes (i.e., non rich club nodes) [Crossley et al., 2014]. In AD, there may be a globally propagating white matter disorder that causes structural and functional damage and this may be more readily detectable in studies focused on regional, or nodal interpretations of the connectome [Daianu et al., 2013; Crossley et al., 2014; Daianu et al., 2014a, 2014b, 2014c], especially later in the disease. More central regions of the rich club (Fig. 2), which connect to remote nodes [van den Heuvel et al., 2012], may be relatively resistant to the neurodegenerative process.
Some of the limitations of our study may involve the relatively low number of tractography fibers (∼10,000) detected in each brain; but despite the relatively lower fiber counts, this method of network creation has been proven stable. In addition, it could be that expanding the cortical parcellation paradigm to include more regional components can help better home in on the specific disrupted connections and better differentiate core and peripheral nodes. However, as expected, additional regions would redefine the network organization and the rich club may rewire around the subcortical regions (if most connections go through them) and therefore, we may not be able to distinguish between subcortical vs. cortical (or whole brain) network connectivity.
AD may be a disorder best characterized by an overall, or global, underlying change in connectivity that distinguishes the disease from other disorders reporting on connectome changes [van den Heuvel et al., 2013; Daianu et al., 2014a, 2014b, 2014c]. An overall reduced connectivity is seen in the network effects for k g, F, L, and Cg, that were affected across (in most cases) the entire range of k, not only in the lower or higher regime. Most frequently, these network metrics are computed across the complete network (i.e., k = 0), however, assessing these across the entire range of k enforces the global connectivity disruption phenomenon specific to AD. Reduced connectivity was also detected among the MCI groups, relative to healthy elderly, but predominantly in the whole brain networks that contain a large set of nodes, possibly necessary for detecting subtle changes in white matter alterations. Effect sizes for measures detecting MCI vs. healthy elderly comparisons were relatively small, so detecting structural alterations among MCI participants remains a challenge.
CONCLUSION
The rich club phenomenon takes into account the fiber density for the densely interconnected white matter connections in the brain's network [van den Heuvel and Sporns, 2011] and has not previously been assessed in people with AD and MCI, compared to healthy elderly. Here, we showed that disease effects were prevalent in the low‐degree nodes, and not so much in the high‐degree nodes forming the core of the rich club organization. This indicates that AD may have a strong impact on lower degree brain regions and might spare some of the subnetworks in the rich club. The binary rich club analysis of the AD connectome is a strong indicator of the global network disruption among cortical regions of the brain and has the potential to reveal information that we did not previously know about the AD brain. In particular, we found that the core of the brain network remains relatively undisturbed throughout the disease. These findings may possibly set apart AD from some other disorders associated with connectome changes.
Supporting information
Supporting Information
ACKNOWLEDGMENTS
Private sector contributions are facilitated by the Foundation for the National Institutes of Health. The grantee organization is the Northern California Institute for Research and Education, and the study is coordinated by the Alzheimer's Disease Cooperative Study at the University of California, San Diego. ADNI data are disseminated by the Laboratory for Neuro Imaging at the University of Southern California.
Disclosure statement
ADNI is partially funded by public and private agencies. One of the authors, Michael Weiner, has received private funding unrelated to the content of this paper.
Footnotes
The rich club effect was also computed separately on the inter‐hemispheric connections within each diagnostic group. Due to the low number of detected edges connecting the two hemispheres, the rich club coefficient was only computable in the low‐degree k‐value regime and did not exceed k = 7 in controls and k = 4 in MCI and AD participants. Therefore, we did not detect a rich club effect among the interhemispheric connections of the brain (only detectable at k > 15).
REFERENCES
- Alzheimer's Association Colorado . 2014. Fact Sheet Alzheimer's Disease. Available at: http://www.alz.org/downloads/Facts_Figures_2014.pdf. Accessed on October 15, 2014.
- Aganj I. Lenglet C, Sapiro G, Yacoub E, Ugurbil K, Harel N (2010): Reconstruction of the orientation distribution function in single and multiple shell q‐ball imaging within constant solid angle. Magn Reson Med 64:554−466. [DOI] [PMC free article] [PubMed] [Google Scholar]
- Aganj I. Lenglet C, Jahanshad N, Yacoub E, Harel N, Thompson PM, Sapiro G (2011): A Hough transform global probabilistic approach to multiple‐subject diffusion MRI tractography. Med Image Anal 15:414−425. [DOI] [PMC free article] [PubMed] [Google Scholar]
- Alvarez‐Hamelin JI, Dall'Asta L, Barrat A, Vespignani A (2006): Large scale networks fingerprinting and visualization using k‐core decomposition In: Weiss Y, Scholkopf B, Platt J, editors. Cambridge (Massachusetts): MIT Press; pp 44–55. [Google Scholar]
- Axer M, Amunts K, Grässel D, Palm C, Dammers J, Axer H, Pietrzyk U, Zilles K (2010): A novel approach to the human connectome: Ultra‐high resolution mapping of fiber tracts in the brain. Neuroimage 54:1091–1101. [DOI] [PubMed] [Google Scholar]
- Basser PJ, Jones DK (2002): Diffusion‐tensor MRI: Theory, experimental design and data analysis–a technical review. NMR Biomed 15:456–467. [DOI] [PubMed] [Google Scholar]
- Braak H, Braak E (1996): Development of Alzheimer‐related neurofibrillary changes in the neocortex inversely recapitulates cortical myelogenesis. ActaNeuropathol 67:677–685. [DOI] [PubMed] [Google Scholar]
- Braskie MN, Jahanshad N, Stein JL, Barysheva M, McMahon KL, de Zubicaray GI, Martin NG, Wright KL, Ringman JM, Toga AW, Thompson PM (2012): Common Alzheimer's Disease risk variant within the CLU gene affect white matter microstructure in young adults. J Neurosci 31:6764–6770. [DOI] [PMC free article] [PubMed] [Google Scholar]
- Brown JA, Terashima KH, Burggren AC, Ercoli LM, Miller KJ, Small GW, Bookheimer SY (2011): Brain network local interconnectivity loss in aging APOE‐4 allele carriers. PNAS 108:20760–20765. [DOI] [PMC free article] [PubMed] [Google Scholar]
- Bruner E, Jacobs HI (2013): Alzheimer's disease: The downside of a highly evolved parietal lobe? J Alzheimers Dis 35:227–240. [DOI] [PubMed] [Google Scholar]
- Buckner RL, Sepulcre J, Talukdar T, Krienen FM, Liu H, Hedden T, Andrews‐Hanna JR, Sperling RA, Johnson KA (2009): Cortical hubs revealed by intrinsic functional connectivity: mapping, assessment of stability, and relation to Alzheimer's disease. J Neurosci 29:1860–1873. [DOI] [PMC free article] [PubMed] [Google Scholar]
- Clerx L, Visser PJ, Verhey F, Aalten P (2012): New MRI markers for Alzheimer's disease: A meta‐analysis of diffusion tensor imaging and a comparison with medial temporal lobe measurements. J Alzheimer's Dis 29:405–429. [DOI] [PubMed] [Google Scholar]
- Coleman M (2005): Axon degeneration mechanisms: Commonality amid diversity. Nat Rev Neurosci 6:889–898. [DOI] [PubMed] [Google Scholar]
- Crossley NA, Mechelli A, Scott J, Carletti F, Fox PT, McGuire P, Bullmore ET (2014): The hubs of the human connectome are generally implicated in the anatomy of brain disorders. Brain 37(Pt 8):2382–2395. [DOI] [PMC free article] [PubMed] [Google Scholar]
- Daianu M, Jahanshad N, Nir TM, Dennis E, Toga AW, Jack CR Jr., Weiner MW, Thompson PM, and the Alzheimer's Disease Neuroimaging Initiative (2012): Analyzing the structural k‐core of brain connectivity networks in normal aging and Alzheimer's disease. In NIBAD’12 MICCAI Workshop on Novel Imaging Biomarkers for Alzheimer's Disease and Related Disorders, Nice, France, pp 52–62.
- Daianu M, Jahanshad N, Nir TM, Toga AW, Jack CR Jr., Weiner MW, Thompson PM and the Alzheimer's Disease Neuroimaging Initiative (2013): Breakdown of brain connectivity between normal aging and Alzheimer's disease: A structural k‐core network analysis. Brain Connectivity 3:407–422. [DOI] [PMC free article] [PubMed] [Google Scholar]
- Daianu M, Dennis EL, Jahanshad N, Nir TM, Toga AW, Jack CR Jr., Weiner MW, Thompson PM (2014a. ): Disrupted brain connectivity in Alzheimer's disease: Effects of network thresholding In: Schultz T. et al., editor. Computational Diffusion MRI and Brain Connectivity, Mathematics and Visualization, Springer International Publishing, pp 199–207.
- Daianu M, Jahanshad N, Villalon‐Reina JE, Mendez MF, Bartzokis G, Jimenez EE, Joshi A, Barsuglia J, Thompson PM (2014b): Rich club network analysis shows distinct patterns of disruption in frontotemporal dementia and Alzheimer's disease. MICCAI’14 Computational Diffusion MRI (CDMRI) Workshop, Boston, MA, pp 13–22. [DOI] [PMC free article] [PubMed]
- Daianu M, Jahanshad N, Nir TM, Leonardo CD, Jack CR Jr., Weiner MW, Bernstein M, Thompson PM (2014c): Algebraic connectivity of brain networks shows patterns of segregation leading to reduced network robustness in Alzheimer's disease. MICCAI’14 Computational Diffusion MRI (CDMRI) Workshop, Boston, MA, pp 55–64. [DOI] [PMC free article] [PubMed]
- Daianu M, Jahanshad N, Mendez MF, Bartzokis G, Jimenez EE, Thompson PM (2015a): Communication of brain network core connections altered in behavioral variant frontotemporal dementia but possibly preserved in early‐onset Alzheimer's disease. SPIE Medical Imaging, 9413. pii:941322. [DOI] [PMC free article] [PubMed] [Google Scholar]
- Daianu M, Mezher A, Jahanshad N, Hibar DP, Nir TM, Jack CR, Weiner M, Bernstein M, Thompson PM (2015b): Spectral graph theory and graph energy metrics show evidence for the Alzheimer's disease disconnection syndrome in APOE‐4 risk gene carriers. Proc IEEE Int Symp Biomed Imaging, In Press. [DOI] [PMC free article] [PubMed]
- Desikan RS, Segonne F, Fischl B, Quinn BT, Dickerson BC, Blacker D, Buckner RL, Dale AM, Maguire RP, Hyman BT, Albert MS, Killiany RJ (2006): An automated labeling system for subdividing the human cerebral cortex on MRI scans into gyral based regions of interest. Neuroimage 31:968–980. [DOI] [PubMed] [Google Scholar]
- Engel J Jr., Thompson PM, Stern JM, Staba RJ, Bragin A, Mody I (2013): Connectomics and epilepsy. Curr Opin Neurol 26:186–194. [DOI] [PMC free article] [PubMed] [Google Scholar]
- Ewers M, Insel P, Jagust WJ, Shaw L, Trojanowski JQ, Aisen P, Petersen RC, Schuff N, Weiner MW, Alzheimer's Disease Neuroimaging Initiative (ADNI) (2012): CSF biomarker and PIB‐PET‐derived beta‐amyloid signature predicts metabolic, gray matter, and cognitive changes in nondemented subjects. Cereb Cortex 22:1993–2004. [DOI] [PMC free article] [PubMed] [Google Scholar]
- Filippi M, Agosta F, Barkhof F, Dubois B, Fox NC, Frisoni GB, Jack CR, Johannsen P, Miller BL, Nestor PJ, Scheltens P, Sorbi S, Teipel S, Thompson PM, Wahlund LO (2012): EFNS (European Federation of Neurological Societies) Task Force: The use of neuroimaging in the diagnosis and management of dementia. Eur J Neurol 19:1487–1501. [DOI] [PubMed] [Google Scholar]
- Fischl B, Destrieux C, Halgren E, Segonne F, Salat DH, Busa E, Seidman LJ, Goldstein J, Kennedy D, Caviness V, Makris N, Rosen B (2004): Automatically parcellating the human cerebral cortex. Cerebral Cortex 14:11–22. [DOI] [PubMed] [Google Scholar]
- Hagmann P (2008): Mapping the Structural Core of Human Cerebral Cortex. PLOS Biology 6:1479–1493. [DOI] [PMC free article] [PubMed] [Google Scholar]
- Ingalhalikar M, Smith A, Parker D, Satterthwaite TD, Elliott MA, Ruparel K, Hakonarson H, Gur RE, Gur RC, Verma R (2013): Sex differences in the structural connectome of the human brain. PNAS 111:823–828. [DOI] [PMC free article] [PubMed] [Google Scholar]
- Jack CR, Bernstein MA, Borowski BJ, Gunter JL, Fox NC, Thompson PM, Schuff N, Krueger G, Killiany RJ, DeCarli CS, Dale AM, Carmichael OW, Tosun D, Weiner MW (2010): Update on the magnetic resonance imaging core of the Alzheimer's disease neuroimaging initiative. Alzheimers Dement 6:212–220. [DOI] [PMC free article] [PubMed] [Google Scholar]
- Jahanshad N, Zhan L, Bernstein MA, Borowski B, Jack CR, Toga AW, Thompson PM (2010): Diffusion tensor imaging in seven minutes: Determining trade‐offs between spatial and directional resolution. Proc IEEE Int Symp Biomed Imaging 1161–1164. [Google Scholar]
- Jahanshad N, Aganj I, Lenglet C, Joshi A, Jin Y, Barysheva M, McMahon KL, de Zubicaray GI, Martin NG, Wright MJ, Toga AW, Sapiro G, Thompson PM (2011): Sex differences in the human connectome: 4‐Tesla high angular resolution diffusion imaging (HARDI) tractography in 234 young adult twins. Proc IEEE Int Symp Biomed Imaging 939–943. [Google Scholar]
- Jahanshad N, Valcour VG, Nir TM, Kohannim O, Busovaca E, Nicolas K, Thompson PM (2012): Disrupted brain networks in the aging HIV+ population. Brain Connectivity 2:335–344. [DOI] [PMC free article] [PubMed] [Google Scholar]
- Jin Y, Shi Y, Zhan L, de Zubicaray GI, McMahon KL, Martin NG, Wright MJ, Thompson PM (2013): Labeling white matter tracts in Hardi by fusing multiple tract atlases with applications to genetics. Proc IEEE Int Symp Biomed Imaging 2013:512–515. [DOI] [PMC free article] [PubMed] [Google Scholar]
- Jin Y, Shi Y, Zhan L, Gutman BA, de Zubicaray GI, McMahon KL, Wright MJ, Toga AW, Thompson PM (2014): Automatic clustering of white matter fibers in brain diffusion MRI with an application to genetics. Neuroimage 100:75–90. [DOI] [PMC free article] [PubMed] [Google Scholar]
- Jin Y, Shi Y, Zhan L, Thompson PM (2015): Automated multi‐atlas labeling of the fornix and its integrity in Alzheimer's disease. Proc IEEE Int Symp Biomed Imaging 140–143. [DOI] [PMC free article] [PubMed] [Google Scholar]
- Li J, Jin Y, Shi Y, Dinov ID, Wang DJ, Toga AW, Thompson PM (2013): Voxelwise spectral diffusional connectivity and its applications to Alzheimer's disease and intelligence prediction. Med Image Comput Comput Assist Interv 16:655–662. [DOI] [PMC free article] [PubMed] [Google Scholar]
- Mori S, van Zijl PC (2002): Fiber tracking: Principles and strategies–A technical review. NMR Biomed 15:468–480. [DOI] [PubMed] [Google Scholar]
- Nir TM, Jahanshad N, Jack CR, Weiner MW, Toga AW, Thompson PM, and the Alzheimer's Disease Neuroimaging Initiative (2012a): Small world network measures predict white matter degeneration in patients with early‐stage mild cognitive impairment. In: Proc IEEE Int Symp Biomed Imaging, pp 1405–1408. [DOI] [PMC free article] [PubMed]
- Nir TM, Jahanshad N, Toga AW, Bernstein MA, Jack CR, Weiner MW, Thompson PM (2012b): ADNI connectivity network breakdown predicts imminent volumetric atrophy in early mild cognitive impairment. MBIA Lect Notes Comput Sci 7509:41–50. [Google Scholar]
- Nir TM, Jahanshad N, Villalon‐Reina JE, Toga AW, Jack CR, Weiner MW, Thompson PM (2013): Effectiveness of regional DTI measures in distinguishing Alzheimer's disease, MCI, and normal aging. NeuroImage: Clinical 3:80–195. [DOI] [PMC free article] [PubMed] [Google Scholar]
- Prasad G, Nir TM, Toga AW, Thompson PM (2013a): Tractography density and network measures in Alzheimer's Disease. In: Proc IEEE Int Symp Biomed Imaging (ISBI), pp 692–695. [DOI] [PMC free article] [PubMed]
- Prasad G, Burkart J, Joshi SH, Nir TM, Toga AW, Thompson PM (2013b): A dynamical clustering model of brain connectivity inspired by the N‐body problem. Multimodal Brain Image Analysis, Lecture Notes in Computer Science: Springer, 8159:129–137. [DOI] [PMC free article] [PubMed] [Google Scholar]
- Reijmer YD, Leemans A, Caeyenberghs K, Heringa SM, Koek HL, Biessels GJ (2013): Disruption of cerebral networks and cognitive impairment in Alzheimer disease. Neurology 80:1370–1377. [DOI] [PubMed] [Google Scholar]
- Rowley J, Fonov V, Wu O, Eskildsen SF, Schoemaker D, Wu L, Mohades S, Shin M, Sziklas V, Cheewakriengkrai L, Shmuel A, Dagher A, Gauthier S, Rosa‐Neto P, Alzheimer's Disease Neuroimaging Initiative (2013): White matter abnormalities and structural hippocampal disconnections in amnestic mild cognitive impairment and Alzheimer's disease. PLoS ONE 8:e74776. [DOI] [PMC free article] [PubMed] [Google Scholar]
- Rubinov M, Sporns O (2010): Complex network measures of brain connectivity: Uses and interpretations. Neuroimage 52:1059–1069. [DOI] [PubMed] [Google Scholar]
- Sporns O (2011): Networks of the Brain. Cambridge, MA: pp 5–31. [Google Scholar]
- Sporns O, Honey CJ, Kötter R (2007): Identification and classification of hubs in brain networks. PLoS ONE 2:e1049. [DOI] [PMC free article] [PubMed] [Google Scholar]
- Stam CJ, Jones BF, Nolte G, Breakspear M, Scheltens Ph (2007): Small‐world networks and functional connectivity in Alzheimer's disease. Cereb Cortex 17:92–99. [DOI] [PubMed] [Google Scholar]
- Thompson PM, Hayashi KM, de Zubicaray G, Janke AL, Rose SE, Semple J, Herman D, Hong MS, Dittmer SS, Doddrell DM, Toga AW (2003): Dynamics of gray matter loss in Alzheimer's disease. J Neurosci 23:994–1005. [DOI] [PMC free article] [PubMed] [Google Scholar]
- Toga AW, Thompson PM (2013): Connectomics sheds new light on Alzheimer's disease. Biol Psychiatry 73:390–392. [DOI] [PMC free article] [PubMed] [Google Scholar]
- van den Heuvel MP, Sporns O (2011): Rich‐club organization of the human connectome. J Neurosci 31:15775–15786. [DOI] [PMC free article] [PubMed] [Google Scholar]
- van den Heuvel MP, Kahn RS, Goñi J, Sporns O (2012): High‐cost, high‐capacity backbone for global brain communication. PNAS 109:11372–11377. [DOI] [PMC free article] [PubMed] [Google Scholar]
- van den Heuvel MP, Sporns O, Collin G, Scheewe T, Mandl RC, Cahn W, Goñi J, Hulshoff Pol HE, Kahn RS (2013): Abnormal rich club organization and functional brain dynamics in schizophrenia. JAMA Psychiatry 70:783–792. [DOI] [PubMed] [Google Scholar]
- Wang J, Zuo X, Dai Z, Xia M, Zhao Z, Zhao X, Jia J, Han Y, He Y (2012): Disrupted functional brain connectome in individuals at risk for Alzheimer's disease. Biol Psychiatry 73:472–481. [DOI] [PubMed] [Google Scholar]
- Watts DJ, Strogatz SH (1998): Collective dynamics of “small‐world” networks. Nature 393: 440–442. [DOI] [PubMed] [Google Scholar]
- Zamora‐López G, Zhou C, Kurths J (2010): Cortical hubs form a module for multisensory integration on top of the hierarchy of cortical networks. Front Neuroinform 4:1. [DOI] [PMC free article] [PubMed] [Google Scholar]
- Zhan L, Jahanshad N, Jin Y, Lenglet C, Mueller BA, Sapiro G, Ugurbil K, Harel N, Toga AW, Lim KO, Thompson PM (2013): Magnetic resonance field strength effects on diffusion measures and brain connectivity networks. Brain Connectivity 3:72–86. [DOI] [PMC free article] [PubMed] [Google Scholar]
- Zhan L, Bernstein MA, Borowski B, Jack CR Jr., Thompson PM (2014a): Evaluation of diffusion imaging protocols for the Alzheimer's disease neuroimaging initiative. In: Proc IEEE Int Symp Biomed Imaging, pp 710–713.
- Zhan L, Jahanshad N, Jin Y, Nir TM, Leonardo C, Bernstein M, Borowski B, Jack CR Jr., Thompson PM (2014b): Understanding scanner upgrade effects on brain integrity and connectivity measures. In: Proc IEEE Int Symp Biomed Imaging, pp 234–237.
Associated Data
This section collects any data citations, data availability statements, or supplementary materials included in this article.
Supplementary Materials
Supporting Information