

Abstract
Multicopper Oxidases (MCOs) utilize an electron shuttling Type 1 Cu (T1) site in conjunction with a mononuclear Type 2 (T2) and a binuclear Type 3 (T3) site, arranged in a trinuclear copper cluster (TNC), to reduce O2 to H2O. Reduction of O2 occurs with limited overpotential indicating that all the coppers in the active site can be reduced via high-potential electron donors. Two forms of the resting enzyme have been observed in MCOs: the Alternative Resting form (AR), where only one of the three TNC Cu’s is oxidized, and the Resting Oxidized form (RO), where all three TNC Cu’s are oxidized. In contrast to the AR form, we show that in the RO form of a high-potential MCO, the binuclear T3 Cu(II) site can be reduced via the 700 mV T1 Cu. Systematic spectroscopic evaluation reveals that this proceeds by a two-electron process, where delivery of the first electron, forming a high energy, meta-stable half reduced T3 state, is followed by the rapid delivery of a second energetically favorable electron to fully reduce the T3 site. Alternatively, when this fully reduced binuclear T3 site is oxidized via the T1 Cu, a different thermodynamically favored half oxidized T3 form, i.e. the AR site, is generated. This behavior is evaluated by DFT calculations, which reveal that the protein backbone plays a significant role in controlling the environment of the active site coppers. This allows for the formation of the meta-stable, half reduced state and thus the complete reductive activation of the enzyme for catalysis.
1 Introduction
Four-electron reduction of O2 to water is an important process industrially as well as in Nature. Due to the high redox potential of O2, a significant amount of energy can be harnessed by the efficient oxidation of electron donating substrates.1 Nature has developed the most efficient system with the Multicopper Oxidases (MCOs) showing overpotentials as low as ~100 mV.2,3 MCOs use a total of four Cu ions: one mononuclear Type 1 Cu (T1) and a trinuclear Cu cluster (TNC) comprised of a Type 2 site (T2) and a coupled binuclear Type 3 pair (T3).4
The T1 Cu, characterized by an intense ~600 nm absorption band and a small A|| hyperfine splitting in Electron Paramagnetic Resonance (EPR) spectroscopy, both resulting from a highly covalent S(Cys)-Cu bond, is the site of entry of electrons from various substrates. The T1 electron is transferred over a 13 Å Cys-His pathway to the TNC where O2 is reduced to water.4–7 MCOs can be divided into two subclasses based on substrate selectivity: one group oxidizes organic substrates such as phenols and amines, and the other is selective for oxidation of metal ions including Fe(II), Cu(I), or Mn(II/III). The former includes laccases, bilirubin oxidases (BODs), and ascorbate oxidase, while the latter contains ceruloplasmin, Fet3p, CueO, and MnxG.8,9
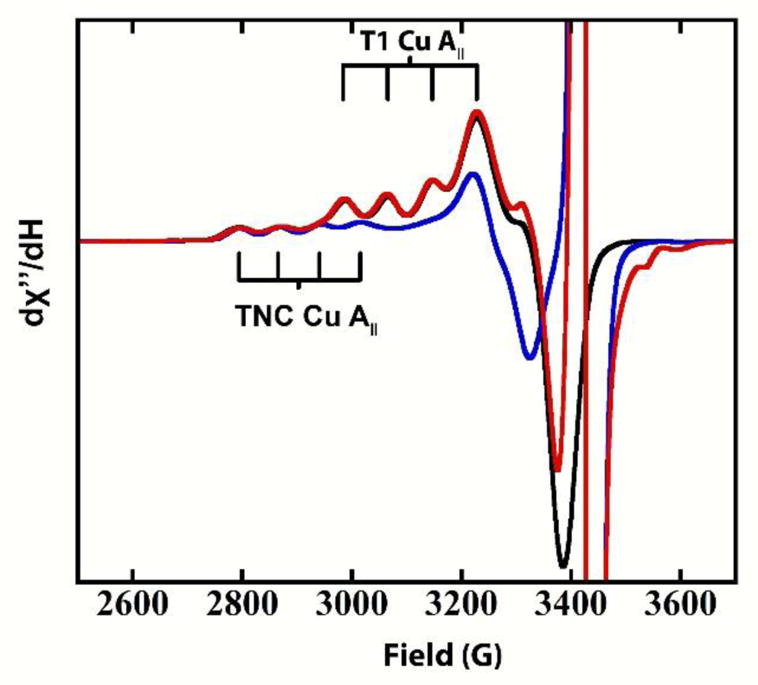
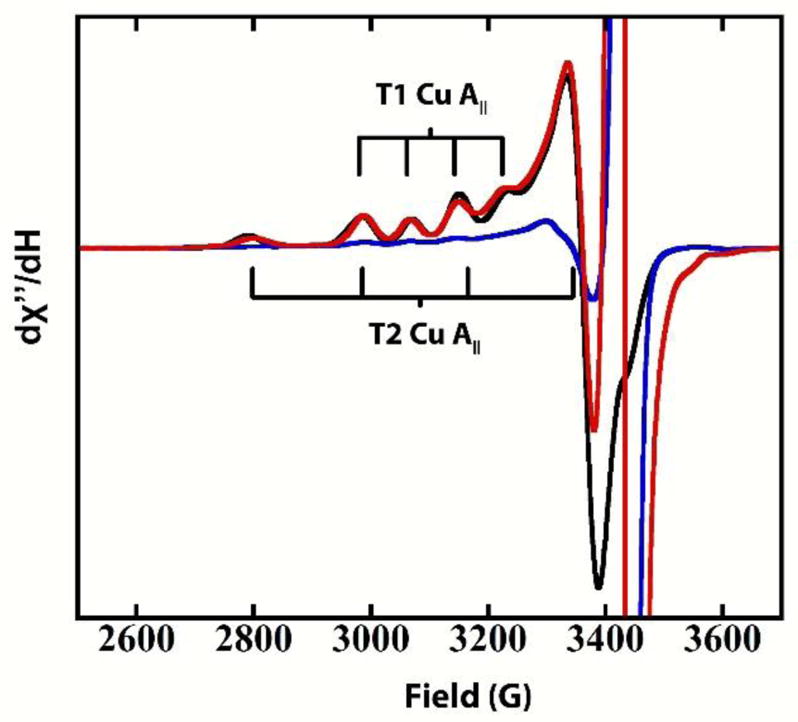
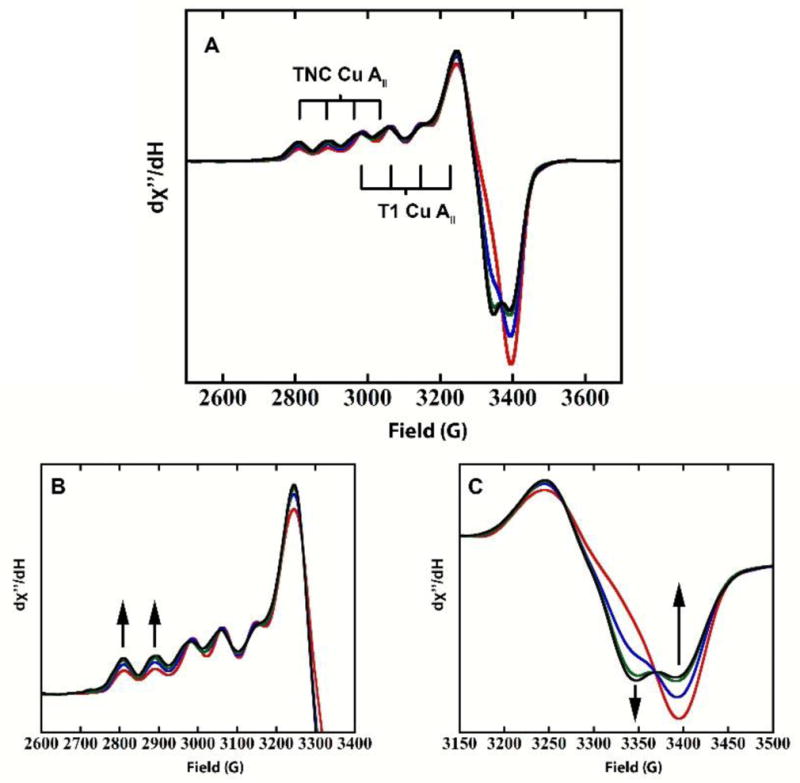
Numerous studies of MCOs have resulted in a consensus mechanism for catalysis that involves the fast four-electron reduction of O2 at the TNC by the fully reduced enzyme.10 This occurs via two, two-electron transfer steps where the first step produces the Peroxide Intermediate (PI)11,12 followed by the formation of the Native Intermediate (NI),13 in which all four Cu’s are oxidized, but the reduced oxygen atoms are still attached as bridging ligands at the TNC.14 Rapid four-electron reduction of the copper centers in NI subsequently leads to the release of two water molecules and regeneration of the reduced enzyme.15,16 In the absence of reducing substrate, NI decays to a resting form, termed Resting Oxidized (RO), where the three TNC Cu’s remain oxidized but one water molecule is released from the interior of the TNC, while the other remains as a hydroxide bridge between the T3 Cu(II) pair.17,18 An additional resting form, however, has been observed in the BODs,19–21 which are MCOs capable of oxidizing bilirubin in addition to traditional organic laccase substrates. 22 We showed recently, that in contrast to the fully oxidized TNC in RO, this Alternative Resting (AR) form has a TNC with one Cu(II) and two Cu(I)’s.21 The TNCs of RO and AR are easily distinguished by their spectroscopic features. In RO, the T2 Cu(II) has a ‘normal’ EPR spectrum with g|| of 2.22–2.27 and A|| of |170–200|×10−4 cm−1 and lacks intense absorption features in the UVvis region. The coupled binuclear T3 site has an intense charge transfer (CT) absorption band at ~330 nm, originating from a bridging hydroxide ligand that also antiferromagnetically couples the two T3 Cu(II)’s, that results in the EPR silence of the oxidized T3 site.4 (see Fig. 1A, C). For AR, the singly oxidized TNC gives rise to a unique EPR feature with a high g|| of 2.32–2.27, and small A|| of |79|×10−4 cm−1, and no 330 nm CT band is present, in contrast to RO (see Figure 1B, D)
Figure 1.

EPR and UVvis absorption spectra of RO (A, C), and AR (B, D) in P. anserina laccase.
The overpotential of O2 reduction, i.e. the energy difference between the thermodynamic limit and the potential at which O2 reduction in the MCOs occurs, is governed by the redox potential of the T1 Cu which varies from ~350 to 800 mV.23,24 With the T1 Cu being the site of electron entry, the potential of the Cu’s in the TNC must enable them to accept electrons from the T1 Cu, which means that all the TNC Cu’s, whether in their catalytic or resting forms, must have a high affinity for electrons. With respect to the catalytic intermediates, we recently showed that NI has a high proton-coupled electron affinity, due to its unique μ3-oxo structural arrangement that makes catalysis possible in low as well as high potential MCOs.15,16 In terms of the resting forms of MCOs, we have shown that in a BOD with a high potential T1 Cu (~750 mV) only the RO form of the TNC will undergo complete anaerobic reduction via the T1, while the oxidized Cu in the TNC in AR BOD cannot be reduced via the T1 Cu. This results in an O2 inactive TNC and therefore the lack of catalysis.21
It is important to understand how the RO form of MCOs is capable of accepting low-energy electrons from the T1 Cu, and why this is not the case in the AR form. Whereas the nature of AR as an additional resting form in high-potential BODs has only recently been determined, several studies have dealt with the reduction of the TNC in RO in both high and low potential MCOs.25–28 These have shown that the T2 Cu reduces in a proton dependent reaction, with higher electron affinity observed at lower pH.29,30 In contrast, the reduction of the binuclear T3 Cu(II) site in RO is more ambiguous. From Nernstian equilibrium experiments Reinhammar and co-workers proposed that the binuclear T3 Cu reduced as an n=2, two-electron acceptor.27 This was later disputed by Farver and co-workers who found n to vary from 1.2 to 2.0 for reduction of the T3 site depending on the reductant.25 It should be noted that the validity of these Nernstian equilibrium experiments require that the electron transfers between reductant and individual Cu sites in the enzyme be reversible. This has not been evaluated for any MCO. Alternatively, simple reduction titrations have been performed, where the decrease in the ~600 and 330nm absorption bands from the T1 and T3 Cu sites, respectively, were monitored, with speciation plots consistent with a two-electron accepting T3 unit. 26,28,31
Herein, we generate AR in a high potential laccase, and present a systematic evaluation of the outersphere reduction behaviors of this AR versus the RO form in the enzyme. The goal of this study is to elucidate the different structural motifs that result in this non-reversible redox behavior of the binuclear T3 center of the TNC. It is observed that the TNC in RO can be reduced to completion via the T1 Cu, while the oxidized Cu of the TNC in AR will not accept electrons from the T1 Cu. It is also shown that outersphere oxidation of a fully reduced TNC via the T1 leads to the formation of AR, which establishes that this form is the thermodynamically preferred one-electron oxidized form in MCOs. It is determined that the fully oxidized T3 pair behaves as a two-electron acceptor, while the oxidation of the reduced T3 pair involves a one-electron process. Finally, we computationally evaluate the reduction and oxidation of the TNC and define the origin of this two-electron reduction vs. one-electron oxidation behavior and why it is only observed in high potential MCOs.
2 Materials and methods
All chemicals were purchased from Sigma and were minimum reagent grade or higher and used without further purification. Water was purified on a Nanopure Diamond purifier from Barnstead to a resistivity of >17 MΩ cm.
Laccase from Podospora anserina was overexpressed in Pichia pastoris and purified in a single step according to a previously published procedure.32 Rhus vernicifera laccase (RvL) was purified from acetone powder according to a previously published procedure.33
UV–visible (UVvis) absorption spectra were acquired on an Agilent 8453 diode array spectrophotometer, in the energy range from 190–1100nm. X-band EPR spectra were obtained with a Bruker EMX spectrometer, an ER 041 XG microwave bridge, and an ER4116DM cavity. A sample temperature of 77 K was maintained using a liquid nitrogen finger dewar. X-band EPR settings were as follows: Freq. ≈9.6 GHz, Power ≈10 mW, Rec. gain = 5.02×10³, Mod. Freq. = 100 kHz, Mod. Amp. = 10.00 G, Time Constant = 327.68 msec, Conversion time = 81.92 msec, Sweep Time = 83.89 sec. Q-band spectra were obtained using an ER 051 QR microwave bridge, an ER 5106QT resonator, and an Oxford Instruments continuous-flow CF935 cryostat that held the sample at 70 K. Q-band EPR settings were: Freq ≈ 34 GHz, Power ≈ 0.37 mW, Mod. Freq. = 100 kHz, Mod Amp. = 10.00 G, Time Constant = 327.68 ms, Conversion Time = 163.83 ms, Sweep Time = 167.63 sec; six scans were averaged. EPR simulations were done using SIMPOW6 software. EPR spin quantitation of the paramagnetic copper content was performed using a 1.0 mM standard solution of CuSO4·5H2O, 2 mM HCl, and 2 M NaClO4. Circular dichroism (CD) spectra and magnetic CD (MCD) spectra were measured on a Jasco J-810–150S spectrapolarimeter with an S-20 photomultiplier tube coupled to an Oxford Instruments SM4000-8T magnet in the UVvis region. In the near-IR region, CD and MCD spectra were measured with a Jasco 730 spectrapolarimeter and a liquid nitrogen cooled InSb detector coupled to an Oxford Instruments SM4000-7T magnet. MCD samples were prepared in deuterated MES buffer, pD 6.0 and mixed with 50% (v/v) glycerol-d3, to obtain high quality glasses. The MCD cells have two quartz disks sealed with a 3-mm rubber spacer. Zero-field baseline effects were eliminated in MCD by taking an average of the +7 T and −7 T scans, [7−(−7)]/2 T. Gaussian fitting of the UVvis, CD, and MCD data was done using PeakFit 4.0 (Jandel).
All anaerobic experiments were performed in a Vacuum Atmosphere glovebox. Reduction of the protein was accomplished by addition of anaerobically prepared dithionite or 2,2′-azino-bis(3-ethylbenzothiazoline-6-sulphonic acid) (ABTS), either sequentially in the redox titration of the RO enzyme, or in excess when reducing the RO or AR forms. Enzyme concentrations were 0.1–0.3 mM. Prior to reoxidation, excess dithionite was removed in the glovebox by buffer exchange into degassed buffer using 10K Amicon Ultra centrifugal filters from Millipore. Reoxidation experiments were performed by mixing fully reduced protein with O2 saturated buffer, or in the case of RvL, with excess ferricyanide. All experiments were performed in 0.1 M sodium phosphate buffer, pH=7, with 0.1 M NaCl added, unless stated otherwise. Due to the extended time of the redox titration of RO, potassium bromide buffer was used, since chloride has been shown previously to convert the RO form to AR.21
Spectrographic graphite electrodes (SPGE) were from RingsdorffWerke GmbH, Bonn, Germany, (type RW001, 3.05 mm diameter and 13% porosity, http://www.sglcarbon.com). SPGE were prepared by wet polishing the end of a rod using water proof emery paper. The electrodes were then rinsed with Milli-Q water and allowed to dry in air. Subsequently 5 μL of enzyme solution (~0.2 mM) was placed on top of the polished rod and adsorption was allowed to occur. After 15 min the electrode was rinsed with Milli-Q water, inserted in a Teflon holder, and used as working electrode. Voltammetric measurements were performed at pH 6.5 with a PINE potentiostat/galvanostat model WaveNow (Pine Research Instrumentation, 2741 Campus Walk Avenue, Durham, NC) using modified electrodes as the working electrode, a Ag|AgCl (3 M NaCl) reference electrode, and a platinum wire counter electrode.
DFT calculations were performed using the Gaussian 09 software package. The starting point of the geometry optimized structures was obtained from the coordinates of bilirubin oxidase from Magnaporthe oryzae expressed in Pichia pastoris (1.8Å resolution) (coordinates from ref. 21). The 8 first sphere His ligands were truncated by replacing the β-carbons by H atoms. These hydrogens were frozen along with the hydrogens of the non-coordinating His-nitrogens. The two carboxylates were truncated by replacing the β- and γcarbons of aspartate and glutamate, respectively, with H atoms. These were also frozen during optimizations.
The geometry optimization was performed using the BLYP functional with 10, 20, or 30% Hartree Fock (HF) and the 6–311g* basis set on Cu, 6–31g* on first sphere nitrogens and oxygens, and 3–21g* on all remaining atoms. For single point energies, 6–311g** was used on all atoms. Solvation effects were included with the polarized continuum model as implemented in Gaussian 09 with a dielectric constant of 4.0.
The computational reduction steps of RO and the oxidation step of fully reduced enzyme to AR was done with addition (or subtraction) of an electron and a proton. This was done according to experimental results where it has been found that the reduction of the T2 Cu and the reduction of the T3 pair by the first electron are both proton dependent. Furthermore, electrochemical results have shown a pH dependent reversible peak for AR reduction/oxidation.34
3 Results and analysis
3.1 Characterization of as-isolated fungal laccase from Podospora anserina
Fungal laccase from P. anserina (PaL) was expressed in Pichia pastoris. The as-isolated laccase expresses with 3.9±0.2 Cu’s per enzyme as determined by the biquinoline method.35 The spectroscopic features of the as-isolated enzyme include an intense ~600 nm absorption band but no 330 nm shoulder in UVvis absorption (Figure S1A), and a combination of two isolated Cu(II) EPR signals, determined by spin integration (Figure S1B). These features are similar to the those observed in bilirubin oxidase from Magnaporthe Oryzae (MaBOD), which we have previously shown derive from the AR form of the enzyme, where the T1 Cu and one of the Cu’s in the TNC are oxidized, with the remaining two Cu’s of the TNC reduced.21
In order to determine the redox potential of the T1 Cu, purified PaL was adsorbed on a spectrographic graphite electrode (SPGE) and cyclic voltammetry was performed. As observed in Figure S2 (blue trace), the main activation of electrocatalytic turnover is initiated at ~400 mV in the first scan, but shifts to a higher onset potential of ~700 mV in the second (red scan). This behavior mimics that observed in MaBOD where the low potential initiation in the first scan was assigned to reduction of the one-electron oxidized AR TNC Cu after which electrocatalytic turnover was initiated with electron transfer via the T1 Cu, consistent with the high onset potential observed in the second scan. With a T1 Cu onset potential of ~700 mV, PaL can be classified as a high potential MCO.4
3.2a Outersphere reduction and the redox properties of the alternative resting TNC in high potential PaL
Electron transfer (ET) to the TNC Cu’s in MCOs is mediated via the T1 Cu, both in the reduction of the resting TNC and during catalytic turnover. To investigate the ET properties of the alternative resting state in PaL, three electron equivalents of the substrate ABTS were added anaerobically to a 0.3 mM solution of PaL-AR and monitored by EPR. To ensure that all Cu’s capable of being reduced via the T1 remained as Cu(I), ABTS was left in solution. The addition of electrons attenuates the T1 Cu(II) EPR signal (Figure 2, black to blue spectrum), whereas there is no observable decrease in the EPR intensity of the oxidized TNC Cu (blue spectrum). This is consistent with a higher reduction potential (>150 mV), for the T1 Cu(II) compared to the singly oxidized TNC in AR. Subsequently, O2 was added to this solution and no immediate change in the EPR spectrum was observed (~10 s). At extended times, the T1 Cu(I) slowly autooxidizes to completion within ~1 h (Figure 2, red spectrum), whereas the lack of additional spectroscopic changes indicates that the two reduced Cu’s in the TNC cannot be oxidized by O2. This behavior is similar to that observed for MCOs with O2-inactive TNCs where the reduced T1 Cu slowly autoxidizes in an outersphere process.36,37
Figure 2.
EPR of AR in PaL (black), AR with three electron equivalents of ABTS (blue), and AR after subsequent exposure to O2 (red). The intense radical signals at ~3400–3500 gauss originate from oxidized ABTS. 0.1 M sodium phosphate buffer with 0.1 M NaCl, pH=6.
Although the one hole TNC in the alternative resting form of PaL could not be reduced via the T1 Cu, it was possible to reduce it, over several hours, by addition of excess dithionite resulting in a fully reduced enzyme, i.e. four Cu(I)’s. After buffer exchange to remove excess dithionite, addition of O2 to this fully reduced protein resulted in immediate four-electron reoxidation as evaluated by the observation of a ~600 nm absorption band and a T1 Cu(II) EPR signal, a 330 nm absorption shoulder, and a T2 Cu(II) EPR signal (Figure S3A and B), indicative of the formation of the RO form of the enzyme. Again, this behavior is consistent with that observed in MaBOD.21
3.2b Outersphere reduction of the resting oxidized TNC in high potential PaL
In contrast to AR, anaerobic addition of ABTS to the RO form of PaL results in the depletion of the EPR signals from both the T1 and T2 Cu(II)’s, as observed in Figure 3 (black to blue spectrum). Again, ABTS was left in solution to ensure that all Cu’s that could be reduced via the T1 remained fully reduced. The observed behavior is consistent with reports on high- as well as low-potential MCOs that showed complete reduction of the TNC Cu(II)’s in the RO form via the T1 Cu. In contrast to the T1-reduced alternative resting PaL (Figure 2), addition of O2 to reduced RO results in the immediate return of the T1 and T2 Cu(II) EPR signals (<10s) (Figure 3, red spectrum), indicating a facile O2 reaction of the fully reduced TNC in this laccase. Hence, while the electron affinity of the singly oxidized Cu in the TNC in AR is too low to accept electrons from the high potential T1 Cu, all TNC Cu(II)’s in RO can be readily reduced via the T1 Cu in PaL. Furthermore, complete reduction of AR by addition of excess dithionite results in formation of the same fully reduced active site as in reduction of RO, as verified by the identical facile O2 reactivity.
Figure 3.
EPR of RO in PaL (black), RO with five electron equivalents of ABTS (blue), and RO after subsequent exposure to O2 (red). The intense radical signals at ~3400–3500 gauss originate from oxidized ABTS. 0.1 M sodium phosphate buffer with 0.1 M NaCl, pH=6.
To further probe the reduction behavior of the TNC in the resting oxidized form of PaL, a redox titration was performed where the electron distribution between the Cu sites were obtained from the anaerobic addition of sub-stoichiometric electron equivalents of low-potential dithionite monitored by UVvis absorption and EPR. (dithionite was chosen as the reducing substrate for the following reasons: 1. it does not absorb in the 600 nm region in contrast to ABTS; 2. although dithionite is capable of reducing the TNC Cu’s independently of the T1, this reaction is on the hour scale whereas reduction via the T1 Cu is on the seconds scale); 3. the low potential (<−200 mV ensures complete electron delivery to the enzyme, which is further supported by the fact that no new UVvis features are observed in the 320 nm region (vide infra) where reduced dithionite absorbs.) Figure 4 shows the reduction of the binuclear T3 Cu(II) (monitored at 330 nm) as compared to the reduction of the T1 Cu(II) (monitored at 595 nm) in the titration of RO by dithionite. The remaining absorption intensities of the 595 and 330 nm bands were evaluated at each titration point, and are given in Table S1. In principle, the 330 nm band can be reduced as either a one-electron or two-electron acceptor; to distinguish between the two possibilities, an EPR spectrum was obtained after addition of 0.9 electron equivalents (Fig. S4). The peak in the EPR spectrum at ~2800 gauss results from the T2 Cu(II) which is seen to decrease by ~25 % after 0.9 electrons have been added (black to light blue in Fig. S4). Together with the estimated decrease of the T1 Cu(II) from UVvis of ~18% (also consistent with the T1 decrease in EPR intensity at liquid N2 temperature), this accounts for ~0.43 electron equivalents out of 0.9. This requires that the ~23% decrease in the 330 nm absorption band in Figure 3 is a consequence of a two-electron reduction of the T3 binuclear Cu(II) pair. (Note the error in electron equivalents is ≤15%; thus, the lower and upper limits on the number of electrons added to the T3 are 0.41 and 0.53.) This is further supported by the lack of any new EPR features after addition of 0.9 electrons. A one-electron reduction of the T3 pair would have produced a new EPR signal with 25% of the original total intensity, which would have easily been observed in EPR, and furthermore would have resulted in less than a 15% decrease in total EPR spin intensity, which is significantly lower than the actual observed decrease of ~25%.
Figure 4.
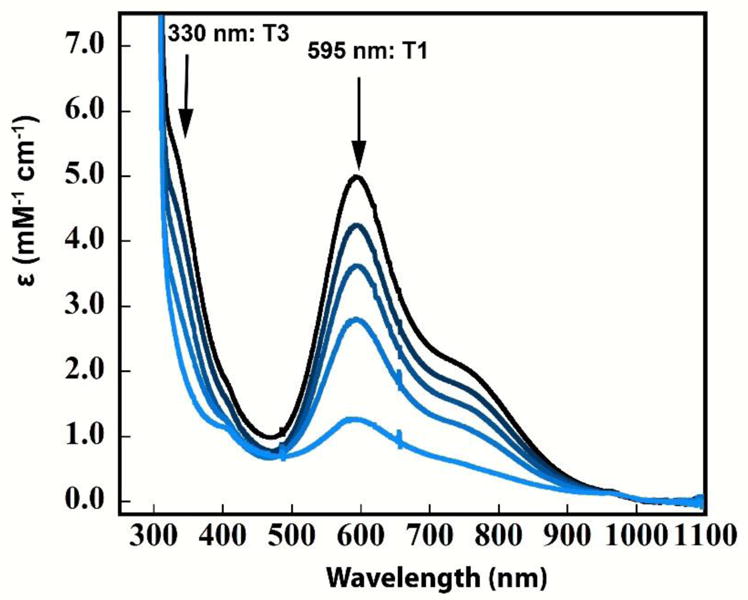
Reductive titration of RO. UVvis spectra of RO obtained after addition of 0, 0.9, 1.8, 2.7, and 3.6 electron equivalents of dithionite (black to light blue). Arrows indicate decrease in intensity of the T1 and T3 Cu(II)’s, respectively. 0.1 M potassium phosphate buffer with 0.1 M KBr, pH=7.
Finally, it should be mentioned that the 0.9 electron equivalent reduction was evaluated after ~ 30 s of dithionite addition, and at this point the corresponding spectral changes caused by the reduction were complete. Overall, from the data of the reduction titration it can be concluded that the decrease in 330 nm absorption intensity is due to a two-electron reduction of the T3 pair in RO.
3.3 Spectroscopic characterization of the 1xCu(II), 2xCu(I) TNC of alternative resting PaL
The TNC structure of RO has been defined in a number of spectroscopic, crystallographic, and computational studies.5,34,38–40 In contrast, little is known about the geometric or electronic structure of the 2xCu(I), 1xCu(II) TNC in AR. To obtain insight into the different behaviors observed in the two resting TNCs defined in the previous sections, we conducted a spectroscopic analysis of the TNC in AR. The high redox potential of the T1 Cu in PaL allows for the spectroscopic features of the one-electron oxidized Cu(II) in the AR TNC to be analyzed. The T1 Cu(II) in the alternative resting form of PaL was anaerobically reduced by titrating dithionite into a 0.1 mM PaL sample anaerobically. After each addition, an EPR spectrum was obtained until the T1 features were eliminated. This resulted in a one-hole TNC form of the enzyme that was analyzed by EPR, UVvis absorption, CD, and MCD spectroscopy. Figures 5A and B show the X-and Q band EPR spectra (black) of the 1xCu(II), 2xCu(I) TNC with simulations (green) allowing for the spin Hamiltonian EPR parameters to be obtained (Table 1). Figure 6A–C gives the UVvis, CD, and low temperature MCD spectra with the positions of the transitions indicated by 1–8, with the energies of these peak maxima, evaluated by simultaneous Gaussian fits, presented in Table 2.
Figure 5.
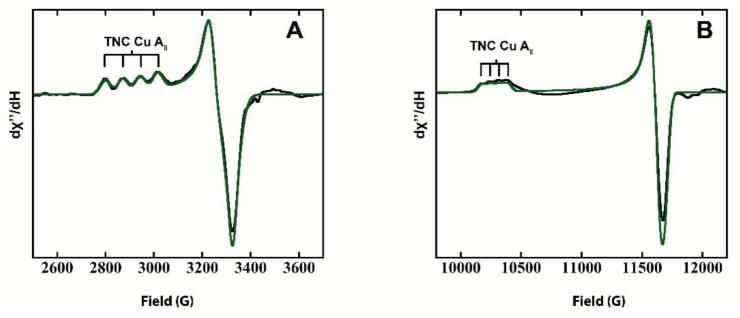
EPR spectra of T1-reduced AR. (A) Experimental (black) and simulated (green) X-band EPR spectra. (B) Experimental (black) and simulated (green) Q-band EPR spectra.
Table 1.
EPR simulation parameters
| gx | 2.085 | Ax | 24×10−4cm−1 |
| gy | 2.096 | Ay | 23×10−4cm−1 |
| gz | 2.367 | Az | 79×10−4cm−1 |
Figure 6.

Absorption spectra of T1-reduced AR. Room temperature (A) UVvis absorption, (B) CD, and (C) low temperature (4 K) MCD experimental spectra (red), overall simultaneous fit (green), and individually resolved bands from fit (black) with transition numbers indicated. (*) represents heme contaminant.
Table 2.
Simultaneous Gaussian fit parameters for MCD, CD, and Abs.
| MCD (cm−1) | CD (cm−1) | UVVis (cm−1) | Δε/ε | |
|---|---|---|---|---|
| 1 | 6071 | - | - | - |
| 2 | 7544 | - | - | - |
| 3 | 9330 | 9285 | - | - |
| 4 | 11383 | 11505 | 11543 | 0.39 |
| 5 | 16562 | - | 16823 | −0.081 |
| 6 | 20000 | - | 20396 | 0.29 |
| 7 | 22232 | - | 22602 | 0.027 |
| 8 | 28348 | 28724 | 28533 | −0.016 |
From EPR, it is seen in Figure 5 that gz > gx,y which is consistent with a Cu(II) dx2-y2 ground state. It should be noted, however, that the gz value of 2.37 is significantly higher than those normally observed for tetragonal Cu(II) complexes (2.2–2.27). Also, the A|| hyperfine splitting of |79| ×10−4cm−1 is reduced in magnitude in comparison to tetragonal Cu(II) species (|140–200| ×10−4cm−1). The UVvis, CD, and MCD data in Figure 6 allow for the assignment of bands 1–4 as d–d transitions and bands 5–8 as ligand-to-metal CT transitions. This is based on the high C/D ratio of d–d transitions that enhances MCD intensities relative to Abs. intensities due to the high spin-orbit coupling constant of Cu(II) (~−830 cm−1), and the high CD intensities relative to Abs. intensities of d–d transitions due to their magnetic dipolar character. It is interesting to note the low energy of the d–d transitions, which start at 6070 cm−1. This is also in contrast to the higher energy d–d transitions (>10,000 cm−1) observed for most tetragonal Cu(II) complexes. Finally, it should be noted that the MCD spectrum shows a derivative shaped pseudo A-term for the two lowest-energy CTs at 16823 cm−1(−) and 20396 cm−1(+) (bands 5 and 6).
To gain insight into the origin of these properties, the well-defined ligand-field methodology for Cu(II) model complexes was applied.41 A tetrahedral distortion from square planar in CuN4 complexes results in an increase in gz from 2.21 to 2.32, a decrease in magnitude of Az from |206| to |95|×10−4 cm−1, and a decrease in the energy of the d–d bands from ~13,500 to 5,000 cm−1. Also, low-energy CTs are observed at ~20,000 cm−1, that is ~10,000 cm−1 lower than the lowest-energy CT in the square planar analogue. 42–44 Based on a comparison to these model complexes, the properties of the Cu(II) in the TNC in AR are consistent with a tetrahedrally distorted Cu(II) site. By correlating to the numerous crystal structures available of MCOs, the Cu(II) in AR can therefore be assigned to either of the T3 Cu’s, but not the T2 Cu center.
A quantitative comparison between the T3 Cu(II) in AR and the well-defined coordinatively unsaturated planar T2 Cu(II) in RO can be performed using the following ligand-field equations:
| (1) |
| (2) |
where λ(−830 cm−1 for Cu(II)) is the spin-orbit coupling constant of Cu(II), α2β2 is the metal character of the ground and excited states, Exy–Ex2–y2 is the ligand field transition energy and Pd(−κ-4/7) are the Fermi contact and spin dipolar coupling contributions to the parallel hyperfine coupling constant. The parameters gz and Az in T2 Cu(II) are 2.253 and |191|×10−4 cm−1 (in RvL)45, respectively, and the dxy to dx2-y2 d–d transition is at 9700 cm−1. The observed change in dxy transition energy from 9700 cm−1 in the T2 Cu(II) to 6070 cm−1 in the T3 Cu(II) center of AR predicts a gz value for the T3 Cu(II) of 2.353 which is in reasonable agreement with the observed value of 2.367. The experimentally observed increase in gz should, according to equation (2), result in a decrease in Az for the AR T3Cu(II) compared to the T2Cu(II), which is also observed experimentally. However, assuming the same value of Pd for both Cu(II) sites, the predicted change would be a decrease in Az by ~50×10−4 cm−1 that is smaller than the observed change by ~60×10−4 cm−1. This discrepancy is possibly due to a lower covalency of the 3-coordinate T2 Cu as opposed to the 4-coordinate T3 Cu in AR. An increased T3 covalency is reflected in the low energy CT transition of AR in Figure 6, which is consistent with a hydroxide bound to a tetrahedral Cu(II) site. This would contribute to the pseudo A term in MCD (i.e. bands 5 and 6) as this requires 2 perpendicular CT transitions from two different ligands; the higher energy component would then involve CT from the His ligands.
In summary, the spectroscopic features of the one-hole TNC in AR reveal that one of the T3 Cu’s is oxidized and the other reduced (from our previous XAS on AR),21 in contrast to the fully oxidized T3 pair in RO. Also, crystallographic results from our previous study showed that while the two T3 Cu(II)’s in RO are kept in close proximity (<4.0 A) by a bridging hydroxide, the T3 Cu’s in AR are much further apart (>4.8 Å).21 These differences result in the different behaviors of the TNCs, where only RO can be reduced by the T1 Cu, whereas the low potential T3 Cu(II) in AR cannot. (vide supra). The correlation between structure and reactivity of RO and AR will be further explored in section 3.5.
3.4 Outersphere oxidation of fully reduced TNCs
3.4.1 High potential P. anserina laccase
From the previous sections, high potential PaL has two distinguishable resting forms, AR and RO, which show markedly different outersphere (i.e. via the T1 Cu) reduction behavior. This has only been observed in high potential MCOs, indicating that the potential of the T1 Cu may play a critical role. While a fully reduced TNC will undergo rapid innersphere reoxidation by O2, independent of the T1 Cu potential, it is not known how outersphere anaerobic oxidation of the fully reduced TNC occurs, and how that relates to the T1 potential.
In order to probe this, we first designed an experiment where electrons were removed from the high potential T1 Cu, via equilibration between fully reduced PaL (4xCu(I)) and PaL in the alternative resting form (T1 Cu(II), 1x TNC Cu(II), 2x TNC Cu(I)). Note, that while electrons could have been removed from the T1 Cu(I) by addition of the oxidized form of a high-potential (> 800mV) redox couple, this could lead to undesirable side reactions and was avoided. The equilibration over time between fully reduced PaL and AR PaL was monitored by EPR (Figure 7). Importantly, the simultaneous slow loss of the T1 Cu(II) features and the appearance of the AR specific TNC Cu(II) features were observed. This is evidenced by an increase in the EPR intensity of the first two hyperfine features at ~2790 and 2870 gauss and the negative feature at ~3350 gauss, both specific to the Cu(II) of the AR, with a concomitant decrease in the negative feature at ~3400 gauss (and loss of blue color), specific to the T1 Cu(II). The conversion between the two forms was further verified by the conservation of the total EPR intensity from spin integration. This shows that when an electron is removed from the T1 Cu(I) of a fully reduced enzyme, via equilibration with an oxidized T1 Cu in the alternative resting form (that has a high potential), the oxidized T1 Cu is backfilled by a Cu(I) of the fully reduced TNC, which has a lower electron affinity than the T1 Cu. The time course of this reaction is presented in the SI.
Figure 7.
EPR of reoxidation of fully-reduced-PaL with AR-PaL. (A) Time points shown are at 2 min, 18.5 h, 64 h, and 136 h. (B) Parallel region of (A). (C) Perpendicular region of (A). Arrows indicate direction of change in the spectra over time.
The outersphere oxidation of the high potential laccase PaL reveals that one of the TNC Cu’s has a lower electron affinity than the T1 Cu, while the other two TNC Cu’s have higher electron affinities than the T1 Cu. Therefore, the thermodynamically favored two-electron reduced, one-electron oxidized form of the TNC is the alternative resting form. Importantly, as shown in section 3.2b, the formation of this species is not observed during reductive titration of the resting oxidized form of this enzyme. This further supports the assignment of the T3 pair in RO as a two-electron acceptor, which requires that after the first electron is delivered to the T3 pair, the second electron must be delivered rapidly to a high energy, meta-stable, half reduced state that is different from the thermodynamically favored half oxidized state observed in AR.
3.4.2 Low potential R. vernicifera laccase
The results of the reduction and oxidation experiments of PaL indicate that the T1 Cu potential controls the ability to perform outersphere electron transfer into and out of the TNC. It is therefore of interest to compare this behavior to that of a low potential MCO. Laccase from Rhus vernificera (RvL) (ET1° = 430 mV)26 has been studied intensely and it has been documented that the TNC of the resting oxidized form of the enzyme is readily reduced via electrons from the T1 Cu.30 It has not, however, been determined if any of the TNC Cu’s of the fully reduced TNC can be oxidized via the T1 Cu. To investigate this, a similar experiment to that performed on PaL was performed with fully reduced RvL. In this case, ferricyanide was used to extract electrons from the T1 Cu(I), since the redox potential of the ferro/ferri cyanide couple is only slightly higher than that of T1 Cu in RvL and should therefore not lead to undesirable side reactions. Furthermore, ferrocyanide is a well known T1 substrate in low potential laccases.
Oxidation of fully reduced RvL by ferricyanide was monitored by EPR and UVvis absorption (Figure 8A and B). As observed in Figure 8A, addition of excess ferricyanide to fully reduced RvL resulted in complete oxidation of the T1 Cu(I), with no observable features from the TNC (blue to red spectrum). Similarly, the ~600 nm T1 Cu absorption band is regenerated upon ferricyanide addition, as seen in Figure 8B (red). Due to the intense absorption features of ferricyanide (~420 nm), it was not possible to determine whether a new absorption feature originating from the TNC Cu’s was present at high energy. (Note that ferri/ferrocyanide is in equilibrium with the T1 Cu, and in order to ensure that the T1 Cu remained oxidized, this was not removed prior to obtaining the UVVis spectrum.)
Figure 8.

Reoxidation of fully-reduced RvL by addition of ferricyanide. (A) EPR spectra of RvL before reduction (black), after reduction with dithionite (blue), and after subsequent addition of ferricyanide (red). (B) UVvis spectra of RvL before reduction (black), after reduction with dithionite (blue), and after subsequent addition of ferricyanide (red).
While the T1 Cu(I) readily undergoes oxidation by ferricyanide, the lack of a T2 or other EPR signals is not sufficient to determine if any of the TNC Cu’s undergoes oxidation via the T1 Cu. A one-electron oxidation of the TNC would result in a Cu(II) EPR signal, whereas a two-electron oxidation could result in the formation of an anti-ferromagnetically coupled Cu(II) pair and hence no EPR signal. This leaves the possibility of either no oxidation or a two-electron oxidation of the TNC. To distinguish between these two possibilities, the ferricyanide oxidized enzyme was exposed to O2. (Note that fully reduced T1-depleted MCOs reacts with O2 to rapidly form the peroxide intermediate (PI)).12,46,47 Figure S6 shows the changes in the absorption spectrum upon O2 exposure to the ferricyanide oxidized RvL. Subtracting the spectrum before exposure to O2, from the spectrum obtained immediately after exposure, produces a difference spectrum with prominent features at 340, 475, and 720nm (Figure 9A). These UVVis features are the same as those of PI formed in enzyme derivatives lacking a redox active T1 (dashed spectrum in Figure 9A)48. No new feature is observed in the EPR spectrum immediately after O2 exposure, but the T2 Cu(II) specific EPR feature reappears at extended times (Figure S7). This behavior is consistent with the formation and decay of PI as observed in T1-depleted MCOs. To confirm the formation of PI, CD spectroscopy was applied, where PI has a highly characteristic CD spectrum with an intense positive feature at 365nm that slowly disappears as the PI decays to the RO form. As shown in Figure 9B, a new CD signal does indeed form at 365nm upon exposure of ferricyanide-treated RvL to O2. (The presence of ferricyanide prevents the observation of UV features in CD, this was therefore removed from PI before the CD spectrum was acquired.) The 365 nm CD feature slowly decays on the same time scale as the appearance of the T2 Cu(II) EPR signal, consistent with the slow conversion from PI to RO.48 (Note that this is the first time the peroxide intermediate has been observed in an intact MCO, i.e. no chemical or genetic modification of the enzyme, which is a separate, important observation.) The formation of PI conclusively shows that the TNC Cu’s remain reduced upon oxidation of the T1 Cu in RvL. Therefore, all the TNC Cu’s in the low potential laccase have significantly higher electron affinities than the T1 Cu. This is in contrast to the above results for the high potential laccase, where the high potential of the T1 Cu allows for its one-electron oxidation of the TNC.
Figure 9.
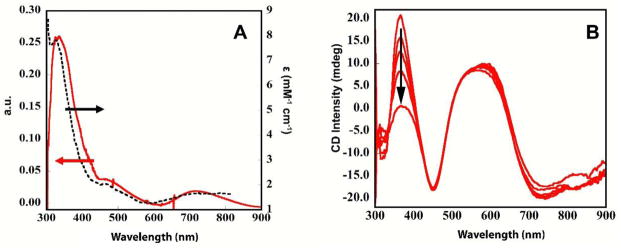
Exposure of ferricyanide-treated-RvL to O2. (A) Difference UVvis spectrum of ferricyanide-treated-RvL before and 30s after exposure to O2 (red), and spectrum of PI in RvL derivative (dashed) from ref 48. (B) CD spectra of ferricyanide-treated-RvL exposed to O2 after 25, 55, 85, 145, and 1200mins. Arrow indicates the decay of the PI-specific 365nm band. Note that ferricyanide was removed before acquisition of CD.
3.5 Computational evaluation of the outersphere reduction and oxidation behaviors of the TNC
The experimental results presented above show that while the three TNC Cu’s in the resting oxidized form of the high potential laccase from P. anserina are readily reduced via the T1 Cu (with the T3 pair behaving as a two-electron acceptor), reduction of the singly oxidized T3 pair in the AR form does not occur via the T1 Cu. In fact, upon oxidation of the T1 Cu, AR is reformed by electron transfer to the T1 Cu from one of the two T3 Cu’s of the fully reduced TNC, showing that the half-oxidized T3 pair, separated by >4.8 Å, is the thermodynamically favored 2xCu(I), 1xCu(II) form of the TNC in the high potential MCOs. To obtain further insight into these observations, Density Functional Theory (DFT) calculations were employed. The reduction behavior of RO was evaluated according to Figure 10, starting from an optimized structure of the resting oxidized TNC, followed by optimization of three one-electron/one-proton reductions (Reduction Steps 1–3 in Figure 10), generating the fully reduced TNC. The three TNC Cu’s and the 8 innersphere His residues are included in the model (Figure S8). Also, the conserved carboxylates, D107 at the T2/T3β edge and E464 at the T3 edge (residue numbers from the MaBOD crystal structure)21 are included, as well as additional water molecules that form the hydrogen bonding network between the carboxylates and the TNC Cu’s (for further computational details, see Materials and Methods). The optimizations were performed using the BLYP functional with 10, 20, and 30% Hartree Fock. The relative energy of each reduction step was evaluated, as presented in Table 3 (note, the energy of the first reduction step, resting oxidized to T2-reduced, was set to 0 kcal/mol and used as a reference for the subsequent reduction steps).
Figure 10.

Reduction of the TNC in RO to the fully reduced TNC, and reoxidation of the fully reduced TNC to AR. Enlarged images are given in Figure S9.
Table 3.
Relative energies of individual electron/proton reduction steps.
| Reduction step | ΔE for 1e−/1H+ reductions | BLYP- HF10 (kcal/mol) | BLYP-HF20 (kcal/mol) | BLYP-HF30 (kcal/mol) |
|---|---|---|---|---|
| 1* | Resting oxidized (RO) → [T2red,2xT3ox] | 0 | 0 | 0 |
| 2 | [T2red,2xT3ox] → [T2red, 1xT3red, 1xT3ox] (= A in Fig. 11) | +14.2 | +7.4 | +26.6 |
| 3 | [T2red, 1xT3red, 1xT3ox] (= A in Fig. 11) → Fully reduced | +21.5 | +14.6 | +19.7 |
The energy of step 1 is set to 0 kcal/mol
Reduction of the T2 Cu occurred in Step 1 (Figure 10, Table 3) and includes protonation of the hydroxide at the T2. This step was the most favorable of the three, independent of the functional employed, which is consistent with its experimentally determined highest electron affinity (vide supra). The first electron into the T3 Cu(II) pair (Step 2) resulted in an optimized structure with a short T3 Cu-Cu distance (see Table S2 for selected distances and angles of the optimized structures) bridged by a hydroxide, with the added proton favored on E464 (Figure 11, species A). Proton delivery to the T3 Cu’s occurs via the conserved carboxylate (E464 in PaL) in MCOs, and the additional proton was placed at this position in the starting structure. Although the Cu-Cu distance varied relatively little between the optimized structures of the one-electron reduced T3 with different HF included (Table S2), the spin density varied from complete delocalization of the electron between the two T3 Cu’s with 10% HF to almost complete localization of the electron on the T3α Cu with 30% HF (Table S3).
Figure 11.
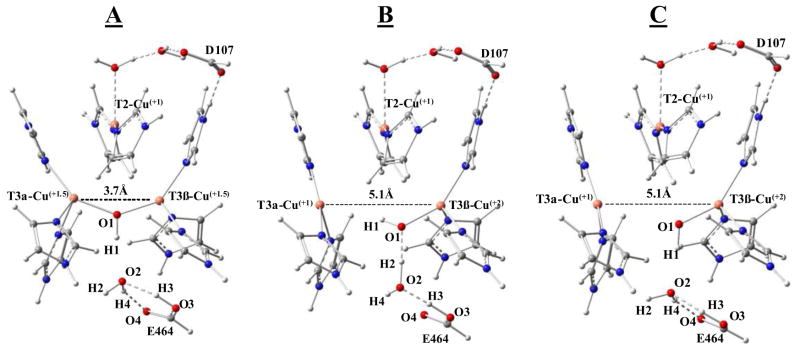
Optimized structures of the one-electron reduced T3 site in RO reduction (A), the one-electron oxidized T3 site from the fully reduced TNC (B), and the one-electron reduced T3 site generated in the linear transit calculation by increasing the T3α to T3β Cu-Cu distance (C).
The addition of the second electron (and proton) into the T3 (Step 3) protonates and breaks the hydroxide bridge between the T3 Cu’s resulting in the elongation of the Cu-Cu distance to more than 5.8 Å in the optimized structure. This distance is longer than in the fully reduced MCO crystal structures, which does not exceed ~5.1 Å.49–51 To better mimic the crystal structures, the T3 Cu-Cu distance was therefore fixed at 5.1 Å. (Note that the energies of the 5.1 Å vs. 5.8 Å structures differ by less than 5 kcal/mol and this difference does not qualitatively affect any of the following results). From Table 3, the relative energies of the two separate reduction (+ protonation) steps of the T3 Cu’s (reduction step 2 and 3 in Figure 10 and in Table 3) vary with the amount of HF included in the functional. With 10 or 20% HF, the first reduction is more favorable by ~7 kcal/mol, whereas the reverse is the case when 30% HF is included. On average, however, the two one-electron reduction steps of the T3 Cu in RO have similar energies.
To address the results of the experiments in section 3.4.1, where the fully reduced TNC is oxidized through an outer-sphere process via the T1 Cu, we also performed calculations of the one-electron oxidation (with deprotonation) of the reduced TNC. This resulted in the lowest energy optimized structure presented in Figure 11, species B, where the T3 Cu-Cu distance remains long and the unpaired spin is localized on the T3β Cu, regardless of the functional applied (Table S3). The geometry of the T3β Cu(II) in the optimized structure is distorted tetrahedral. From Table 4, the energy of this one-hole oxidized T3, species B, is more stable (by 13–20 kcal/mol depending on the functional employed) compared to the one-electron reduced T3 structure, species A, shown in Figure 11. Therefore, B has a lower electron affinity than A, which makes it significantly harder to re-reduce B to the fully reduced TNC. These results are consistent with the experimental results of outersphere oxidation of the fully reduced PaL and indicate that the optimized structure, computationally generated by one-electron oxidation from the fully reduced TNC, species B in Figure 11, is the experimentally determined TNC in the alternative resting form of the enzyme.
Table 4.
Relative energies of species A, B, and C presented in Figure 10 and text
| Stucture | BLYP-HF10 (kcal/mol) | BLYP-HF20 (kcal/mol) | BLYP-HF30 (kcal/mol) |
|---|---|---|---|
| A* | 0 | 0 | 0 |
| B | −12.6 | −16.9 | −20.4 |
| C | −0.6 | −3.9 | −7.1 |
The energy of A is set to 0kcal/mol.
Evaluation of the two optimized one-hole TNC structures in Figure 11, A generated from one-electron reduction of the fully oxidized T3 pair and B generated by one-electron oxidation of the fully reduced TNC, highlights two major differences. First, the Cu-Cu distance in A (maintaining the hydroxyl bridge) is 3.68 Å vs. 5.1 Å in B (with the hydroxide bound only to T3β) and second, the hydrogen bonding network is significantly different. There are two hydrogen bonds formed between the oxygen 3 and 4 of E464 and oxygen 2 of the water molecule in A, while in B two hydrogen bonds are formed between the oxygen 2 of the water and oxygen 1 bound to the T3β Cu and oxygen 3 of E464. In order to evaluate why the lower energy structure B is not observed in the reduction of the T3 in RO, two linear transit calculations, starting from structure A, were performed using the 20% HF functional. One where the Cu-Cu distance was incrementally increased from 3.68 Å to 5.10 Å and one where hydrogen 2 (Figure 11, species A) was moved incrementally closer to oxygen 1. In the first case, the increase in Cu-Cu distance resulted in a small energy barrier of 1 kcal/mol at around 4.1 Å after which the T3 hydroxide bridge broke and the Cu’s optimized apart (Figure S10). The optimized structure at 5.1 Å in this linear transit calculation is shown in Figure 11 (species C) and it is observed that the hydrogen bond network in C is similar to that in A. Structure C was futher optimized with the 10 and 30% HF functionals giving the relative energies shown in Table 4. Interestingly, the stabilization of C relative to A increases with increasing HF in the functional (from −0.6 to −7 kcal/mol), but this does not affect the difference in energy between B and C. From this, the major contribution to the stabilization of the AR structure, B, in Figure 11, relative to the one-electron reduced T3 structure (A), is the more favorable hydrogen bonding network present in B. A closer inspection of the hydrogen bonding networks in A and B reveals that while both the hydrogen bonds in B have short oxygen-oxygen distances (~2.5 Å) and close to linear O-H-O angles, the hydrogen bonds in A (and C) are slightly longer (2.57 Å and 2.62 Å). More importantly, their angles are smaller with one angle at 152° and the other at 144° (relative to 177° and 169°) and therefore form weaker hydrogen bonds than in B. This significantly stabilizes the TNC in AR (by ~13 kcal/mol) leading to the thermodynamically favored one-hole TNC observed experimentally.
Finally, to evaluate the potential energy barrier required to realign the hydrogen bond network in A to the more favorable network in B in Figure 11, the second linear transit calculation was performed where the O1-H2 distance in species A (Figure 11) was incrementally shortened. As shown in Figure 12, the energy increases continuously upon shortening of the O1-H2 distance and plateaus at ~+9 kcal/mol at around 2.2 Å. At this point the Cu-Cu distance is still short (~3.75 Å), but upon further decrease in O1-H2 distance to 2.1 Å, the hydroxide bridge breaks and the Cu-Cu distance greatly increases from ~3.8 to >5.8 Å. This results in a sharp decrease in energy (Figure 12), that corresponds to the formation of a similar hydrogen bonding network to that in B. Importantly, this linear transit calculation shows that there is a considerable energy barrier associated with going from the less stable one-electron reduced T3 site in RO (A), to the more stable one-electron oxidized T3 in AR (B) (associated with the required realignment of the hydrogen bond network). This barrier would allow the second electron to be delivered to the T3 in RO (A) via the high potential T1 Cu before the half-reduced T3 pair can relax to the thermodynamically more stable structure in AR, as observed experimentally.
Figure 12.
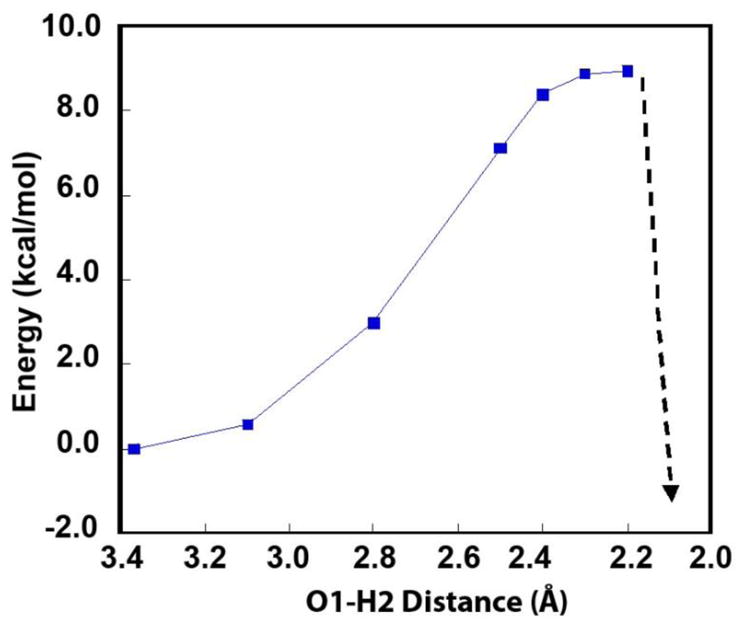
Energies of the linear transit calculation of decreasing the O1-H2 distance in species A in Figure 10A from 3.37Å to 2.1 Å.
4 Discussion
This study has defined the correlation between the two resting forms in the high potential MCOs, the resting oxidized (RO) and alternative resting (AR). The fully oxidized TNC in RO readily undergoes three electron reductions via the T1 Cu (~700 mV) with the T3 pair reducing as a two-electron acceptor. Alternatively, the half reduced T3 Cu pair in AR is significantly more stable than the half reduced T3 pair in RO, as evaluated in section 3.5, and can therefore not be reduced via a high potential T1 Cu.
A computational evaluation of the experimental results shows that one-electron reduction (and protonation) of the oxidized T3 pair produces an optimized structure where the T3 Cu-Cu distance is relatively short (3.5–3.7 A) as the T3 Cu’s are bridged by a hydroxide (species A in Figure 11), with the electron distributed over both Cu’s (with 10 or 20% HF in the functional) or localized on the T3α Cu (with 30% HF). Importantly, a significantly more stable one-electron reduced T3 pair (−17 kcal/mol more stable with 20% HF) is obtained upon one-electron oxidation (and deprotonation) of the fully reduced TNC. This structure has a Cu-Cu distance of 5.1 Å with the spin (i.e. oxidation) localized on the T3β Cu that has a tetrahedrally distorted Cu(II) with a bound hydroxide (species B in Figure 11), consistent with the spectroscopic features of AR. By evaluating the correlation between the two half-reduced T3 structures, A and B in Figure 11, via linear transit calculations, the major contribution to the energy difference is the more favorable hydrogen bonding network in B. Importantly, the conversion from the hydrogen bonding network in A to that in B introduces a significant energy barrier that enables A to undergo a second reduction by the T1 Cu (at a similar potential to the first electron into the T3 pair) and thereby generate the catalytically relevant fully reduced form of the enzyme. These correlations are summarized in Scheme 1.
Scheme 1.

Reduction and oxidation behavior of high potential MCOs.
From the above experiments, the two T3 TNC Cu’s in RO have electron-affinities that enable them to be reduced via a high potential T1 Cu, provided the protein environment controls the process by constraining the one-electron reduced T3 pair from converting to its more stable form (AR) that cannot be further reduced via the high potential T1 Cu. Considering the redox potential of O2 of 815 mV at pH=7 (vs. a 0 V electron donor), this provides a relatively narrow thermodynamic window in which the high potential MCOs operate. It is important to note, that upon outersphere oxidation of the fully reduced TNC (via the T1 Cu), AR is formed where the T2 and T3α Cu’s are reduced, but not able to perform the two-electron reduction of O2. Instead, it is the ability of the fully reduced TNC to perform innersphere reduction of O2, delivering four electrons in two sequential two-electron steps that enables the enzyme to function in this narrow thermodynamic window.
Finally, in the above sections we have found that it is the outersphere oxidation of the T1 that leads to the one-electron oxidation of the TNC that produces AR, which is not functional in O2 reduction. However, this only occurs in the MCOs when the T1 has a high potential. This is consistent with the fact that T1 has approximately a 700 mV redox potential while the AR has a redox potential of ~400 mV.34 The fact that this does not occur in the MCOs with the low T1 potentials (~400 mV) indicates that the one-electron oxidation of a reduced TNC in these forms has to be >550 mV. It would be interesting, in a genetically modified system, to shift a low potential T1 to a high enough potential to oxidize the TNC in an outersphere reaction to determine whether this involves a one- or two-electron process.
In summary, we have shown that the resting oxidized TNC in the high potential MCOs readily undergoes outersphere reduction via the T1 Cu (the T3 reducing with n=2 electrons) to generate the fully reduced TNC, which is activated for O2 reduction. In contrast, the outersphere oxidation of the fully reduced TNC results in the one-electron oxidation of the T3 to form AR. AR has a significantly lower electron-affinity than the high potential T1 Cu, and will therefore not accept an electron from this center that serves as the entry point for outersphere reduction of the MCOs by substrates. Thus, in the reduction of the functional RO enzyme, the protein environment ensures that the one-electron reduced T3 pair does not convert to the more stable AR form. This enables the second electron to be delivered into the T3 pair via the T1 Cu, resulting in a two-electron process.
Supplementary Material
Acknowledgments
This work was supported by the National Institute of Diabetes and Digestive and Kidney Diseases under NIH grant R01DK31450 (to E.I.S). The content is solely the responsibility of the authors and does not necessarily represent the official views of the National Institutes of Health. C.H.K. acknowledges a John Stauffer Stanford Graduate Fellowship.
Footnotes
Supporting information includes EPR and UVvis spectra of AR and RO in PaL, CV plot of AR PaL, kinetic modeling of outersphere PaL TNC, enlarged images and geometries of optimized DFT structures. This information is available free of charge via the internet at http://pubs.acs.org.
References
- 1.Wood PM. Biochem J. 1988;253:287–289. doi: 10.1042/bj2530287. [DOI] [PMC free article] [PubMed] [Google Scholar]
- 2.Mano N, Kim HH, Heller A. J Phys Chem B. 2002;106:8842–8848. [Google Scholar]
- 3.Thorseth MA, Tornow CE, Tse ECM, Gewirth AA. Coord Chem Rev. 2013;257:130–139. [Google Scholar]
- 4.Solomon EI, Sundaram UM, Machonkin TE. Chem Rev. 1996;96:2563–2606. doi: 10.1021/cr950046o. [DOI] [PubMed] [Google Scholar]
- 5.Piontek K, Antorini M, Choinowski T. J Biol Chem. 2002;277:37663–37669. doi: 10.1074/jbc.M204571200. [DOI] [PubMed] [Google Scholar]
- 6.Messerschmidt A, Rossi A, Ladenstein R, Huber R, Bolognesi M, Gatti G, Marchesini A, Petruzzelli R, Finazzi-Agró A. J Mol Biol. 1989;206:513–529. doi: 10.1016/0022-2836(89)90498-1. [DOI] [PubMed] [Google Scholar]
- 7.Hadt RG, Gorelsky SI, Solomon EI. J Am Chem Soc. 2014;136:15034–15045. doi: 10.1021/ja508361h. [DOI] [PMC free article] [PubMed] [Google Scholar]
- 8.Nakamura K, Go N. Cell Mol Life Sci. 2005;62:2050–2066. doi: 10.1007/s00018-004-5076-x. [DOI] [PMC free article] [PubMed] [Google Scholar]
- 9.Solomon EI, Heppner DE, Johnston EM, Ginsbach JW, Cirera J, Qayyum M, Kieber-Emmons MT, Kjaergaard CH, Hadt RG, Tian L. Chem Rev. 2014;114:3659–3853. doi: 10.1021/cr400327t. [DOI] [PMC free article] [PubMed] [Google Scholar]
- 10.Solomon EI, Augustine AJ, Yoon J. Dalton Trans. 2008;9226:3921–3923. doi: 10.1039/b800799c. [DOI] [PMC free article] [PubMed] [Google Scholar]
- 11.Cole JL, Ballou DP, Solomon EI. J Am Chem Soc. 1991;113:8544–8546. [Google Scholar]
- 12.Shin W, Sundaram UM, Cole JL, Zhang HH, Hedman B, Hodgson KO, Solomon EI. J Am Chem Soc. 1996;118:3202–3215. [Google Scholar]
- 13.Lee SK, George SD, Antholine WE, Hedman B, Hodgson KO, Solomon EI. J Am Chem Soc. 2002;124:6180–6193. doi: 10.1021/ja0114052. [DOI] [PubMed] [Google Scholar]
- 14.Yoon J, Solomon EI. J Am Chem Soc. 2007;129:13127–13136. doi: 10.1021/ja073947a. [DOI] [PMC free article] [PubMed] [Google Scholar]
- 15.Heppner DE, Kjaergaard CH, Solomon EI. J Am Chem Soc. 2013;135:12212–12215. doi: 10.1021/ja4064525. [DOI] [PMC free article] [PubMed] [Google Scholar]
- 16.Heppner DE, Kjaergaard CH, Solomon EI. J Am Chem Soc. 2014;136:17788–17801. doi: 10.1021/ja509150j. [DOI] [PMC free article] [PubMed] [Google Scholar]
- 17.Huang H, Zoppellaro G, Sakurai T. J Biol Chem. 1999;274:32718–32724. doi: 10.1074/jbc.274.46.32718. [DOI] [PubMed] [Google Scholar]
- 18.Yoon J, Liboiron BD, Sarangi R, Hodgson KO, Hedman B, Solomon EI. Proc Natl Acad Sci USA. 2007;104:13609–13614. doi: 10.1073/pnas.0705137104. [DOI] [PMC free article] [PubMed] [Google Scholar]
- 19.Shimizu A, Kwon JH, Sasaki T, Satoh T, Sakurai N, Sakurai T, Yamaguchi S, Samejima T. Biochemistry. 1999;38:3034–3042. doi: 10.1021/bi9819531. [DOI] [PubMed] [Google Scholar]
- 20.Martins LO, Soares CM, Pereira MM, Teixeira M, Costa T, Jones GH, Henriques AO. J Biol Chem. 2002;277:18849–18859. doi: 10.1074/jbc.M200827200. [DOI] [PubMed] [Google Scholar]
- 21.Kjaergaard CH, Durand F, Tasca F, Qayyum MF, Kauffmann B, Gounel S, Suraniti E, Hodgson KO, Hedman B, Mano N, Solomon EI. J Am Chem Soc. 2012;134:5548–5551. doi: 10.1021/ja211872j. [DOI] [PMC free article] [PubMed] [Google Scholar]
- 22.Mano N. Appl Microbiol Biotechnol. 2012;96:301–307. doi: 10.1007/s00253-012-4312-9. [DOI] [PubMed] [Google Scholar]
- 23.Kawahara K, Suzuki S, Sakurai T, Nakahara A. Arch Biochem Biophys. 1985;241:179–186. doi: 10.1016/0003-9861(85)90374-1. [DOI] [PubMed] [Google Scholar]
- 24.Shleev S, Christenson A, Serezhenkov V, Burbaev D, Yaropolov A, Gorton L, Ruzgas T. Biochem J. 2005;385:745–754. doi: 10.1042/BJ20041015. [DOI] [PMC free article] [PubMed] [Google Scholar]
- 25.Farver O, Goldberg M, Wherland S, Pecht I. Proc Natl Acad Sci U S A. 1978;75:5245–5249. doi: 10.1073/pnas.75.11.5245. [DOI] [PMC free article] [PubMed] [Google Scholar]
- 26.Reinhammar BR, Vänngård TI. Eur J Biochem. 1971;18:463–468. doi: 10.1111/j.1432-1033.1971.tb01264.x. [DOI] [PubMed] [Google Scholar]
- 27.Reinhammar BR. Biochim Biophys Acta. 1972;275:245–259. doi: 10.1016/0005-2728(72)90045-x. [DOI] [PubMed] [Google Scholar]
- 28.Fee JA, Malkin R, Malmstrom BG, Vänngard T. J Biol Chem. 1969;244:4200–4207. [PubMed] [Google Scholar]
- 29.Brändén R, Reinhammar B. Biochim Biophys Acta. 1975;405:236–242. doi: 10.1016/0005-2795(75)90090-2. [DOI] [PubMed] [Google Scholar]
- 30.Andréasson LE, Reinhammar B. Biochim Biophys Acta. 1976;445:579–597. doi: 10.1016/0005-2744(76)90112-1. [DOI] [PubMed] [Google Scholar]
- 31.Malkin R, Malmström BG, Vänngård T. Eur J Biochem. 1969;7:253–259. doi: 10.1111/j.1432-1033.1969.tb19600.x. [DOI] [PubMed] [Google Scholar]
- 32.Durand F, Gounel S, Mano N. Protein Expr Purif. 2013;88:61–66. doi: 10.1016/j.pep.2012.11.016. [DOI] [PubMed] [Google Scholar]
- 33.Reinhammar B. Biochim Biophys Acta. 1970;205:35–47. doi: 10.1016/0005-2728(70)90059-9. [DOI] [PubMed] [Google Scholar]
- 34.Shleev S, Andoralov V, Falk M, Reimann CT, Ruzgas T, Srnec M, Ryde U, Rulíšek L. Electroanalysis. 2012;24:1524–1540. [Google Scholar]
- 35.Felsenfeld G. Arch Biochem Biophys. 1960;87:247–251. doi: 10.1016/0003-9861(60)90168-5. [DOI] [PubMed] [Google Scholar]
- 36.Augustine AJ, Kragh ME, Sarangi R, Fujii S, Liboiron BD, Stoj CS, Kosman DJ, Hodgson KO, Hedman B, Solomon EI. Biochemistry. 2008;47:2036–2045. doi: 10.1021/bi7020052. [DOI] [PubMed] [Google Scholar]
- 37.Kjaergaard CH, Qayyum MF, Augustine AJ, Ziegler L, Kosman DJ, Hodgson KO, Hedman B, Solomon EI. Biochemistry. 2013;52:3702–3711. doi: 10.1021/bi4002826. [DOI] [PMC free article] [PubMed] [Google Scholar]
- 38.Cole JL, Clark PA, Solomon EI. J Am Chem Soc. 1990;112:9534–9548. [Google Scholar]
- 39.Quintanar L, Yoon J, Aznar CP, Palmer AE, Andersson KK, Britt RD, Solomon EI. J Am Chem Soc. 2005;127:13832–13845. doi: 10.1021/ja0421405. [DOI] [PubMed] [Google Scholar]
- 40.Hu L, Farrokhnia M, Heimdal J, Shleev S, Rulíšek L, Ryde U. J Phys Chem B. 2011;115:13111–13126. doi: 10.1021/jp205897z. [DOI] [PubMed] [Google Scholar]
- 41.Desjardins SR, Penfield KW, Cohen SL, Musselman RL, Solomon EI. J Am Chem Soc. 1983;105:4590–4603. [Google Scholar]
- 42.Herring FG, Patmore DJ, Storr A. Dalton Trans. 1975;16:711–717. [Google Scholar]
- 43.Bernarducci E, Schwindinger WF, Hughey JL, Krogh-Jespersen K, Schugar HJ. J Am Chem Soc. 1981;103:1686–1691. [Google Scholar]
- 44.Ferguson J. J Chem Phys. 1964;40:3406–3410. [Google Scholar]
- 45.Tamilarasan R, McMillin DR. Biochem J. 1989;263:425–429. doi: 10.1042/bj2630425. [DOI] [PMC free article] [PubMed] [Google Scholar]
- 46.Kataoka K, Kitagawa R, Inoue M, Naruse D, Sakurai T, Huang HW. Biochemistry. 2005;44:7004–7012. doi: 10.1021/bi0476836. [DOI] [PubMed] [Google Scholar]
- 47.Quintanar L, Stoj C, Wang TP, Kosman DJ, Solomon EI. Biochemistry. 2005;44:6081–6091. doi: 10.1021/bi047379c. [DOI] [PubMed] [Google Scholar]
- 48.Palmer AE, Lee SK, Solomon EI. J Am Chem Soc. 2001;123:6591–6599. doi: 10.1021/ja010365z. [DOI] [PubMed] [Google Scholar]
- 49.Messerschmidt A, Luecke H, Huber R. J Mol Biol. 1993;230:997–1014. doi: 10.1006/jmbi.1993.1215. [DOI] [PubMed] [Google Scholar]
- 50.Taylor AB, Stoj CS, Ziegler L, Kosman DJ, Hart PJ. Proc Natl Acad Sci USA. 2005;102:15459–15464. doi: 10.1073/pnas.0506227102. [DOI] [PMC free article] [PubMed] [Google Scholar]
- 51.Bento I, Silva CS, Chen Z, Martins LO, Lindley PF, Soares CM. BMC Struct Biol. 2010;10:28. doi: 10.1186/1472-6807-10-28. [DOI] [PMC free article] [PubMed] [Google Scholar]
Associated Data
This section collects any data citations, data availability statements, or supplementary materials included in this article.