Abstract
AIM: To investigate the autofluorescence spectroscopic differences in normal and adenomatous colonic tissues and to determine the optimal excitation wavelengths for subsequent study and clinical application.
METHODS: Normal and adenomatous colonic tissues were obtained from patients during surgery. A FL/FS920 combined TCSPC spectrofluorimeter and a lifetime spectr-ometer system were used for fluorescence measurement. Fluorescence excitation wavelengths varying from 260 to 540 nm were used to induce the autofluorescence spectra, and the corresponding emission spectra were recorded from a range starting 20 nm above the excitation wavelength and extending to 800 nm. Emission spectra were assembled into a three-dimensional fluorescence spectroscopy and an excitation-emission matrix (EEM) to exploit endogenous fluorophores and diagnostic information. Then emission spectra of normal and adenomatous colonic tissues at certain excitation wavelengths were compared to determine the optimal excitation wavelengths for diagnosis of colonic cancer.
RESULTS: When compared to normal tissues, low NAD (P)H and FAD, but high amino acids and endogenous phorphyrins of protoporphyrin IX characterized the high-grade malignant colonic tissues. The optimal excitation wavelengths for diagnosis of colonic cancer were about 340, 380, 460, and 540 nm.
CONCLUSION: Significant differences in autofluorescence peaks and its intensities can be observed in normal and adenomatous colonic tissues. Autofluorescence EEMs are able to identify colonic tissues.
Keywords: Autofluorescence spectroscopy, Excitation-emission matrix, Optical diagnosis, Colonic cancer
INTRODUCTION
Colonic cancer is an important public health concern in industrialized countries and around the world. Diagnosis and localization of early carcinoma play an important role in the prevention and curative treatment of colonic cancer. However, physical biopsies do not fully solve this problem because they are sampled at random locations, which is highly dependent on the skill and experience of the investigator. As a result, a significant number of lesions, especially the carcinoma in situ lesions, are not sampled and subsequently diagnosed[1,2]. Laser-induced autofluorescence depends on endogenous fluorophores in the biological tissue, which undergoes a change related to malignant transformations. Therefore, it is possible for us to develop more sensitive techniques for the detection of early colonic tissue. During the past two decades, autofluorescence spectroscopy has been investigated as an effective and noninvasive method for detecting and imaging the abnormal tissues from the surrounding normal tissues.
Measurement of three-dimensional fluorescence spectroscopy or fluorescence excitation-emission matrices (EEMs) for tissue samples in vitro is a crucial step to exploit the endogenous fluorophores and determine which excitation wavelengths contain the most diagnostic information for clinical diagnostic analysis[3-6]. However, an important limitation of most studies on the autofluorescence diagnosis of colonic cancer is that the selection of excitation wavelengths is based on the availability of a special light source, and few studies have been done to understand the real reasons responsible for the spectral differences[6-9]. In this study, we conducted the measurement of autofluorescence EEMs in order to investigate the spectroscopic differences in normal and adenomatous colonic tissues, and to further determine the optimal excitation wavelengths. It is hoped that information from this investigation may be useful for subsequent studies and clinical diagnosis.
MATERIALS AND METHODS
Adenomatous colonic tissues (n = 5) were obtained from four patients during surgery for malignant tumors of the colon, and normal tissue sample (n = 4, matched controls) was also collected from the same patient. Each tissue sample was cut into two specimens. One specimen was sent to the pathologist for standard histopathological evaluation, the other unstained and unfixed specimen was placed on a non-fluorescence quartz substrate for laser-induced autofluorescence within 2 h after surgical resection.
Autofluorescence EEM was performed using a FL/ FS920 combined TCSPC spectrofluorimeter and a lifetime spectrometer system (Edinburgh Instruments Ltd, UK). The wavelength-selected excitation light onto the sample with a 60° incident angle and fluorescence emission was collected at 45° with respect to the normal quartz substrate in order to minimize the detection of the backscattered excitation light. The slit sizes of excitation and emission monochromator were 1.5 and 0.5 mm, respectively. The wavelength dependence of the excitation power and the detector response was corrected and calibrated for all emission spectra. Fluorescence EEMs were recorded by measuring the fluorescence emission spectra over a range of excitation wavelengths. The excitation wavelengths varied from 260 to 540 nm in 20-nm increments. At each excitation wavelength, the fluorescence emission spectra were recorded from a range starting 20 nm above the excitation wavelength and extending to 800 nm at 5-nm intervals. These wavelength ranges enabled characterization of all endogenous fluorophores, tryptophan, collagen, and elastin, NAD(P)H, FAD and endogenous phorphyrins, present in tissues in the UV-Vis spectrum[10,11]. This resulted in a total measurement time about 25 min for each EEM. After each measurement, a repeat fluorescence spectrum was measured at 260 nm excitation and compared to that measured at the beginning of the experiment to confirm that the measurement protocol used did not induce photobleaching. Fluorescence data from each single measurement were then combined to construct EEM containing fluorescence intensity as a function of both excitation and emission wavelengths.
RESULTS
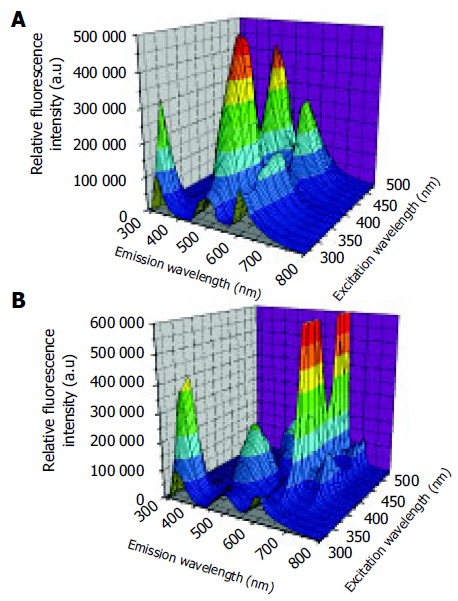
No significant differences were observed in the autofluo-rescence spectra of normal and cancerous tissues. However, remarkable differences in fluorescence peaks and intensities were detected between normal and adenomatous tissue from the same patient. The representative three-dimensional autofluorescence spectra for the normal colonic tissue and adenomatous colonic tissue are shown in Figures 1A and B, respectively. The relative fluorescence intensity was recorded as a function of both excitation and emission wavelengths. Although the fluorescence intensities were indicated in arbitrary units, the same experimental set-ups were maintained throughout our measurements for comparison.
Figure 1.

Three-dimensional autofluorescence spectra for normal colonic tissue (A) and adenomatous colonic tissue (B).
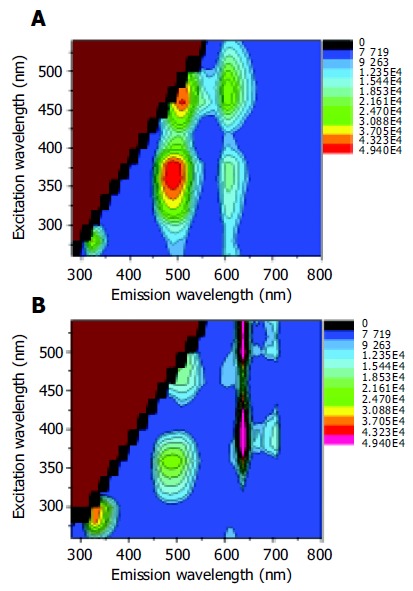
The corresponding autofluorescence EEMs for normal and adenomatous colonic tissue are displayed in Figures 2A and B, respectively. The colorized scale represents different fluorescence intensities. The plots are shown on a log contour scale, where each contour connects points of equal fluorescence intensity.
Figure 2.

Autofluorescence EEMs for normal colonic tissue (A) and adenomatous colonic tissue (B).
In the case of autofluorescence EEM for normal colonic tissue in Figure 2A, the primary fluorescence peaks occurred at the excitation-emission wavelength pairs of 280-330, 350-480, 350/460-605, and 460-520 nm. According to the previous studies, these fluorescence peaks were attributed to the amino acids tryptophan and tyrosine, reduced nicotinamide adenine dinucleotide (NADH) or reduced nicotinamide adenine dinucleotide phosphate (NADPH), ceroid and flavin adenine dinucleotide (FAD), respectively[10,12]. Adenomatous tissues exhibited emission peaks at 635 and 710 nm (Figure 2B) that were not observed in the emission spectra of normal colonic tissues. These remarkable peaks were the contribution of naturally occurring high endogenous phorphyrins of protoporphyrin IX in cancerous tissues[13-15]. Furthermore, the emission intensity from tryptophan and tyrosine was more intense in cancerous tissue than in normal tissue EEM. However, the endogenous fluorescence near 500 nm reduced in tumor tissues relative to normal colonic tissues. The differences might lie in the decrease of the oxidized forms of flavins and the relative amount of NAD (P)H in malignant tissues. As a result, low NAD(P)H and FAD but high amino acids and protoporphyrin IX accumulated in the human colonic malignancy. An evaluation of the average fluorescence spectrum at 260 nm excitation collected at the end of each EEM indicated that its peak fluorescence intensity was within 8% of that acquired at the beginning of each EEM. This means that minimal photobleaching occurred during the process of the 25-min EEM measurement.
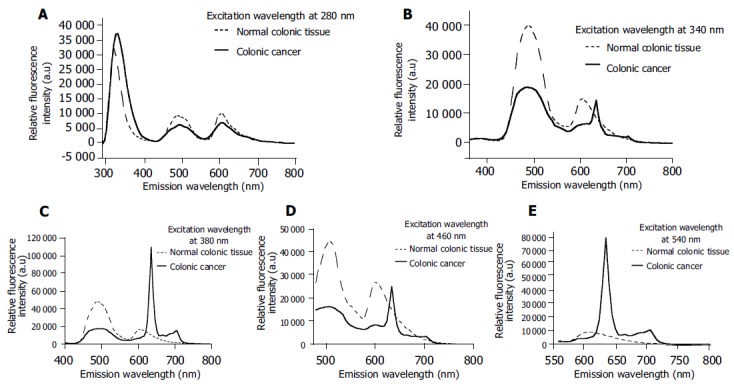
In order to further determine the optimized excitation wavelengths for the diagnosis of colonic cancer, autofluo-rescence emission spectra at certain excitation wavelengths of 280, 340, 380, 460, and 540 nm for normal and adenomatous colonic tissues were compared in Figure 3, respectively. The greatest spectroscopic differences could be achieved for diagnosis of colonic cancer when the excitation wavelengths were 340, 380, 460, and 540 nm. In particular, the emission from endogenous phorphyrins of protoporphyrin IX demonstrably characterized the autofluorescence spectroscopy of cancerous tissues when the excitation wavelength was higher than 380 nm.
Figure 3.

Fluorescence spectra of normal and cancerous tissues at excitation wavelengths of 280 (A), 340 (B), 380 (C), 460 (D), and 540 nm (E).
DISCUSSION
In this study, autofluorescence EEMs were measured using a standard spectrofluorimeter to determine the location of the endogenous fluorescent peaks and their relative intensity in normal and adenomatous colonic tissues. We observed significant differences in the autofluorescence spectra of normal tissues and adenomatous colonic tissues, and these differences could be attributed to the differences in fluorophores expression. The endogenous fluorophores that are speculated to cancerous transformations are the amino acids tryptophan and tyrosine, the structural proteins collagen and elastin, the coenzymes NAD(P)H and FAD, and phorphyrins[12].
Our results indicate that the fluorescence intensity of the amino acids tryptophan and tyrosine is dominant in both normal and cancerous colonic tissues at 280 nm excitation, which demonstrates the fact that amino acids are the basic structural units of protein and play an important role in biological tissues. These results also agree well with those of Pradhan et al[16] who suggested that there is an increase in tryptophan as cells progress from normal to cancerous state. Secondly, we observed that the intensity in the blue region of the autofluorescence spectra significantly reduced in adenomatous colonic tissues compared to normal tissues, which is in substantial agreement with the early work showing that the concentration of NADH and NADPH in adenomatous tissues is lower than that in normal tissues[6,7]. Moreover, Anidjar et al[17] have demonstrated a decrease of FDA in cancerous tissues, which is proved in our research. However, Georgakoudi et al[18] and Drezek et al[19] suggested that low collagen and high NAD(P)H fluorescence characterize the high-grade dysplastic lesions when compared to nondysplastic cervix tissues. It is possible that the differences in NAD(P)H fluorescence may be due to different colonic and cervix tissues and the comparable measurements should be carried out for further confirmation. In addition, it should be noted that the emission specific peaks from collagen and elastin were not shown in our tissue EEMs except for one case, suggesting that the increments of excitation wavelength should be limited to 10 nm in order to exploit the emission fluorescence from structural proteins collagen and elastin. Bottiroli et al[7] have observed a red fluorescence in some parts of tissue section from a cancerous colon. The red fluorescence has been reported by Moesta et al[13] and also demonstrated in this investigation, which can be definitely attributed to high endogenous phorphyrins of protoporphyrin IX accumulating naturally in colonic cancer.
In summary, the presence or absence of fluorescence peaks in both normal and adenomatous colonic tissues can be explained by the different endogenous fluorophores to generate autofluorescence signals, and the ability of laser-induced autofluorescence EEMs to distinguish normal from cancerous colonic tissues. The present investigation offers evidence that low NAD(P)H and FAD but high amino acids and protoporphyrin IX characterize the high-grade malignant colonic tissues. Based on our results, the optimal excitation wavelengths for diagnosis of colonic cancer are 340, 380, 460, and 540 nm.
ACKNOWLEDGMENTS
We thank Professor Ming-Ren Li at the Department of Oncology of the First Affiliated Hospital of Fujian Medical University for providing the colonic tissue samples and the results of standard histopathological diagnosis.
Footnotes
Supported by the Natural Science Foundation of Fujian Province, No. A0310018 and No. 2002F008, and the Scientific Research Program of Fujian Province, No. JA03041
Science Editor Guo SY Language Editor Elsevier HK
References
- 1.Yova D, Atlamazoglou V, Kavantzas N, Loukas S. Develop-ment of a fluorescence-based imaging system for colon can-cer diagnosis using two novel rhodamine derivatives. Lasers Med Sci. 2000;15:140–147. [Google Scholar]
- 2.Prosst RL, Gahlen J. Fluorescence diagnosis of colorectal neoplasms: a review of clinical applications. Int J Colorectal Dis. 2002;17:1–10. doi: 10.1007/s003840100343. [DOI] [PubMed] [Google Scholar]
- 3.Heintzelman DL, Utzinger U, Fuchs H, Zuluaga A, Gossage K, Gillenwater AM, Jacob R, Kemp B, Richards-Kortum RR. Optimal excitation wavelengths for in vivo detection of oral neoplasia using fluorescence spectroscopy. Photochem Photobiol. 2000;72:103–113. doi: 10.1562/0031-8655(2000)072<0103:OEWFIV>2.0.CO;2. [DOI] [PubMed] [Google Scholar]
- 4.Palmer GM, Marshek CL, Vrotsos KM, Ramanujam N. Optimal methods for fluorescence and diffuse reflectance measurements of tissue biopsy samples. Lasers Surg Med. 2002;30:191–200. doi: 10.1002/lsm.10026. [DOI] [PubMed] [Google Scholar]
- 5.Chang SK, Follen M, Malpica A, Utzinger U, Staerkel G, Cox D, Atkinson EN, MacAulay C, Richards-Kortum R. Optimal excitation wavelengths for discrimination of cervical neoplasia. IEEE Trans Biomed Eng. 2002;49:1102–1111. doi: 10.1109/TBME.2002.803597. [DOI] [PubMed] [Google Scholar]
- 6.Richards-Kortum R, Rava RP, Petras RE, Fitzmaurice M, Sivak M, Feld MS. Spectroscopic diagnosis of colonic dysplasia. Photochem Photobiol. 1991;53:777–786. doi: 10.1111/j.1751-1097.1991.tb09892.x. [DOI] [PubMed] [Google Scholar]
- 7.Bottiroli G, Croce AC, Locatelli D, Marchesini R, Pignoli E, Tomatis S, Cuzzoni C, Di Palma S, Dalfante M, Spinelli P. Natural fluorescence of normal and neoplastic human colon: a comprehensive "ex vivo" study. Lasers Surg Med. 1995;16:48–60. doi: 10.1002/lsm.1900160107. [DOI] [PubMed] [Google Scholar]
- 8.Banerjee B, Miedema B, Chandrasekhar HR. Emission spectra of colonic tissue and endogenous fluorophores. Am J Med Sci. 1998;316:220–226. doi: 10.1097/00000441-199809000-00013. [DOI] [PubMed] [Google Scholar]
- 9.Sheng JQ, Li SR, Chen ZM, Gao G. Value of LIAF spectra for detection of colorectal carcinoma during colonoscopy. Zhongguo Jiguang Yixue Zazhi. 2001;10:145–147. [Google Scholar]
- 10.Richards-Kortum R, Sevick-Muraca E. Quantitative optical spectroscopy for tissue diagnosis. Annu Rev Phys Chem. 1996;47:555–606. doi: 10.1146/annurev.physchem.47.1.555. [DOI] [PubMed] [Google Scholar]
- 11.Palmer GM, Keely PJ, Breslin TM, Ramanujam N. Autofluorescence spectroscopy of normal and malignant human breast cell lines. Photochem Photobiol. 2003;78:462–469. doi: 10.1562/0031-8655(2003)078<0462:asonam>2.0.co;2. [DOI] [PubMed] [Google Scholar]
- 12.Ramanujam N. Fluorescence spectroscopy in vivo, in Meyers RA ed. Encyclopedia of Analytical Chemistry. Chichester, John Wiley Sons Ltd. 2000. pp. 20–56. [Google Scholar]
- 13.Moesta KT, Ebert B, Handke T, Nolte D, Nowak C, Haensch WE, Pandey RK, Dougherty TJ, Rinneberg H, Schlag PM. Protoporphyrin IX occurs naturally in colorectal cancers and their metastases. Cancer Res. 2001;61:991–999. [PubMed] [Google Scholar]
- 14.DaCosta RS, Andersson H, Wilson BC. Molecular fluorescence excitation-emission matrices relevant to tissue spectroscopy. Photochem Photobiol. 2003;78:384–392. doi: 10.1562/0031-8655(2003)078<0384:mfemrt>2.0.co;2. [DOI] [PubMed] [Google Scholar]
- 15.Huang Z, Zheng W, Xie S, Chen R, Zeng H, McLean DI, Lui H. Laser-induced autofluorescence microscopy of normal and tumor human colonic tissue. Int J Oncol. 2004;24:59–63. [PubMed] [Google Scholar]
- 16.Pradhan A, Pal P, Durocher G, Villeneuve L, Balassy A, Babai F, Gaboury L, Blanchard L. Steady state and time-resolved fluorescence properties of metastatic and non-metastatic malignant cells from different species. J Photochem Photobiol B. 1995;31:101–112. doi: 10.1016/1011-1344(95)07178-4. [DOI] [PubMed] [Google Scholar]
- 17.Anidjar M, Cussenot O, Blais J, Bourdon O, Avrillier S, Ettori D, Villette JM, Fiet J, Teillac P, Le Duc A. Argon laser induced autofluorescence may distinguish between normal and tumor human urothelial cells: a microspectrofluorimetric study. J Urol. 1996;155:1771–1774. [PubMed] [Google Scholar]
- 18.Georgakoudi I, Jacobson BC, Müller MG, Sheets EE, Badizadegan K, Carr-Locke DL, Crum CP, Boone CW, Dasari RR, Van Dam J, et al. NAD(P)H and collagen as in vivo quantitative fluorescent biomarkers of epithelial precancerous changes. Cancer Res. 2002;62:682–687. [PubMed] [Google Scholar]
- 19.Drezek R, Sokolov K, Utzinger U, Boiko I, Malpica A, Follen M, Richards-Kortum R. Understanding the contributions of NADH and collagen to cervical tissue fluorescence spectra: modeling, measurements, and implications. J Biomed Opt. 2001;6:385–396. doi: 10.1117/1.1413209. [DOI] [PubMed] [Google Scholar]


