

Background: All-trans-retinoic acid is a promising therapeutic agent in breast cancer.
Results: All-trans-retinoic acid modulates mammary tumor cell epithelial-to-mesenchymal-transition via the TGFβ and NOTCH pathways.
Conclusion: The present study unveils a new aspect of all-trans-retinoic acid activity (i.e. regulation of phenotypic cell plasticity).
Significance: Our results indicate that all-trans-retinoic acid is endowed with anti-metastatic properties that could be exploited at the therapeutic level.
Keywords: cancer biology, cancer therapy, cell biology, cell differentiation, cell migration, epithelial-mesenchymal transition (EMT), NOTCH pathway, nuclear receptor, retinoic acid, retinoid
Abstract
All-trans-retinoic acid (ATRA) is a natural compound proposed for the treatment/chemoprevention of breast cancer. Increasing evidence indicates that aberrant regulation of epithelial-to-mesenchymal transition (EMT) is a determinant of the cancer cell invasive and metastatic behavior. The effects of ATRA on EMT are largely unknown. In HER2-positive SKBR3 and UACC812 cells, showing co-amplification of the ERBB2 and RARA genes, ATRA activates a RARα-dependent epithelial differentiation program. In SKBR3 cells, this causes the formation/reorganization of adherens and tight junctions. Epithelial differentiation and augmented cell-cell contacts underlie the anti-migratory action exerted by the retinoid in cells exposed to the EMT-inducing factors EGF and heregulin-β1. Down-regulation of NOTCH1, an emerging EMT modulator, is involved in the inhibition of motility by ATRA. Indeed, the retinoid blocks NOTCH1 up-regulation by EGF and/or heregulin-β1. Pharmacological inhibition of γ-secretase and NOTCH1 processing also abrogates SKBR3 cell migration. Stimulation of TGFβ contributes to the anti-migratory effect of ATRA. The retinoid switches TGFβ from an EMT-inducing and pro-migratory determinant to an anti-migratory mediator. Inhibition of the NOTCH1 pathway not only plays a role in the anti-migratory action of ATRA; it is relevant also for the anti-proliferative activity of the retinoid in HCC1599 breast cancer cells, which are addicted to NOTCH1 for growth/viability. This effect is enhanced by the combination of ATRA and the γ-secretase inhibitor N-(N-(3,5-difluorophenacetyl)-l-alanyl)-S-phenylglycine t-butyl ester, supporting the concept that the two compounds act at the transcriptional and post-translational levels along the NOTCH1 pathway.
Introduction
All-trans-retinoic acid (ATRA)2 and derived retinoids are potent antitumor agents (1), causing growth inhibition, differentiation, and secondary apoptosis. Retinoids bind to specific nuclear receptors (RARs), which function as transcriptional regulators controlling the expression of numerous genes. RARs consist of three subtypes (α, β, and γ), which act by heterodimerizing with the retinoid X receptors (2). ATRA controls diverse developmental processes and the homeostasis of numerous organs, including the mammary gland (3–5). In this organ, the retinoid induces lactogenic differentiation of breast cancer cells and triggers an epithelial-like phenotype via cadherin-mediated junction formation (6, 7).
Phenotypic plasticity (i.e. the ability of cells to reversibly change phenotype) modulates tumor growth and dissemination (8). Epithelial to mesenchymal transition (EMT) drives polarized, non-motile epithelial cells to acquire highly migratory and fibroblastoid-like features, and it is crucial in normal embryonic development, tissue remodeling, and wound healing (9, 10). Increasing evidence supports a role for EMT in tumor invasion and metastatic spread. EMT causes loss of apical-basal polarity, disintegration of tight/adherens junction, and cytoskeletal changes. These structural features are associated with the acquisition of a motile and invasive phenotype (9). Accordingly, many signal transduction pathways, such as TGFβ, NOTCH, and WNT, that are involved in physiological EMT are activated in tumorigenesis and contribute to disease progression (11). The molecular mechanisms underlying EMT are controlled by transcription factors, such as SNAIL, SLUG, TWIST, and ZEB1, as well as specific miRNAs acting in regulatory feedback loops (12).
NOTCH signaling is an evolutionarily conserved pathway involved in development, stem cell self-renewal, and tissue differentiation (13, 14). NOTCH activation requires ligand binding and proteolytic cleavage by ADAM/TACE metalloproteases and γ-secretase. This results in intracellular release of the NOTCH intracellular domain (NICD) from the inner cell membrane. NICD migrates to the nucleus, where it associates with a number of transcription factors. NOTCH activation triggers mesenchymal transformation of breast cancer epithelial cells, particularly via TGFβ (15, 16). For instance, TGFβ up-regulates NOTCH ligands (17), and TGFβ-induced EMT is blocked by pharmacological inhibition of NOTCH (17).
In this study, we exploit a cellular model of breast cancer exquisitely sensitive to the anti-proliferative action of ATRA to demonstrate that the retinoid influences cell plasticity. The retinoid modulates the process of EMT induced by EGF or heregulin-β1 (Herg), and it inhibits cell migration. We also identify NOTCH1 as a major molecular determinant of ATRA anti-migratory action.
Experimental Procedures
Cell and Culture Conditions
HCC1954, MDAMB453, MDAMB361, SKBR3, and UACC812 cell lines were purchased from the ATCC. The HCC1599 cell line was obtained from DSMZ (Deutsche Sammlung von Mikroorganismen und Zellkulturen GmbH, Braunschweig, Germany). Cells were grown in phenol red-free Dulbecco's modified Eagle's medium F-12 (DMEM/F-12; Invitrogen) supplemented with glutamine (2 mm) and 5% fetal bovine serum (Lonza). For the experiments involving the use of ATRA, cells were grown in DMEM/F-12 medium supplemented with glutamine (2 mm) and 5% charcoal-stripped fetal bovine serum (Lonza). For estrogen receptor-positive cells, estradiol (10 nm) was always added to the medium. ATRA and estradiol were from Sigma. The RARα agonist, AM580, the RARβ agonist, BMS641, and the RARγ agonist, CD437, have already been described (6, 18). EGF and Herg were from Sigma and Peprotech, respectively. N-(N-(3,5-difluorophenacetyl)-l-alanyl)-S-phenylglycine t-butyl ester (DAPT) and 4-(5-benzol(1,3)dioxol-5-yl-4-pyrldin-2-yl-1H-imidazol-2-yl)-benzamide hydrate, 4-(4-(1,3-benzodioxol-5-yl)-5-(2-pyridinyl)-1H-imidazol-2-yl)-benzamide hydrate, 4-(4-(3,4-methylenedioxyphenyl)-5-(2-pyridyl)-1H-imidazol-2-yl)-benzamide hydrate (SB431542) were from Sigma.
Three-dimensional Cell Cultures
Experiments involving three-dimensional cell cultures were carried out according to the protocol of the Muthuswamy laboratory (available on the Muthuswamy laboratory Web site). Briefly, 8-well plates (μ-slide 8-well, Ibidi) were filled with 70 μl of phenol red/growth factor-free Matrigel (BD Biosciences) and incubated for 20 min at 37 °C to solidify the matrix. SKBR3 cells were harvested in trypsin-EDTA and resuspended in culture medium (DMEM/F-12, supplemented with 5% charcoal-stripped FBS) to generate a cell suspension of 2,500 cells/100 μl. One volume of 5% Matrigel was combined with one volume of cell suspension, and 400 μl of the mixture were seeded in culture wells. Cells were incubated at 37 °C in 5% CO2 for 5 days (the optimal time necessary to grow non-polarized aggregates typical of the tumor phenotype) before treatment. Medium and chemicals were replaced every 3 days.
Cell Growth Assays
Cell growth was determined with the sulforhodamine assay (19) or by the CellTiter-Glo luminescent cell viability assay (Promega) according to the manufacturer's instructions. Each cell line was exposed to increasing concentrations of ATRA (0.001, 0.01, 0.1, 1.0, and 10.0 μm) for 3, 6, or 9 days. In the latter case, the culture medium was replaced with fresh medium once every 3 days. The percentage growth inhibition (% GI) induced by ATRA concentration i was calculated only for concentrations for which Ti(6) ≥ C(3), according to the formula, % GI(i) = 100 × (Ti(6) − Ti(3))/(C(6) − C(3)), where Ti(3) represents the absorbance at day 3 of treated samples for a drug concentration i; C(3) is the absorbance at day 3 of control samples for a drug concentration i; Ti(6) is the absorbance at day 6 of treated samples for a drug concentration i; and C(6) is the absorbance at day 6 of control samples for a drug concentration i. The % GI(i) values were fitted for ATRA concentrations with a Hill function. GI50 was calculated from the best fit function if at least three data points with % GI between 5 and 95% could be fitted and the r2 of the fit was >0.8; otherwise, the value was determined by linear interpolation.
Immunofluorescence and Time Lapse Microscopy
For indirect immunofluorescence microscopy, cells were fixed with 3% paraformaldehyde and permeabilized with 0.1% Triton X-100 in PBS for 5 min. Fixed cells were incubated for 45 min with anti-VE-cadherin (BV9) (20), anti-β-catenin (BD Biosciences), anti-occludin (Zymed Laboratories Inc.), anti-ZO-1 (Zymed Laboratories Inc.), and anti-SNAIL (Cell Signaling) antibodies. For NOTCH1 immunofluorescence, cells were fixed and permeabilized with methanol for 5 min on ice and stained with anti-NOTCH1 antibodies (Cell Signaling). Positive cells were identified following incubation with 488 or 543 Alexa-conjugated secondary antibodies (Invitrogen) for 30 min. Three-dimensional immunofluorescence studies were performed according to a standard protocol (available on the Muthuswamy laboratory Web site). Fluorescence microscopy studies were performed with an IX71 apparatus (Olympus), and images were recorded using a CCD camera and the Cell∧F imaging software (Olympus). Confocal laser microscopy experiments were conducted with a IX81 microscope coupled to an Olympus FluorView 300 laser-scanning confocal microscope (Olympus).
Transfections and Western Blots
For the experiments involving NOTCH1 overexpression, SKBR3 cells were seeded in 6-well plates and transfected at 30–40% confluence with the mammalian expression plasmids pcDNA3HAN1ΔE FLAG (hNOTCH1) (1 μg) and pEGFPN1 (100 ng) using Lipofectamine 2000 (Life Technologies, Inc.) according to the manufacturer's instructions. Twenty-four hours later, cells were split and reseeded to normalize for the transfection efficiency. For the experiments involving SMAD3 silencing, SKBR3 cells were co-transfected with a 60 nm concentration of a validated SMAD3 siRNA (HSS106252, Life Technologies) (6) or an appropriate control siRNA (stealth RNAi siRNA negative control HiGC, 12935400) and the normalization plasmid, pEGFPN1 (300 ng), using Lipofectamine 3000 (Life Technologies) according to the manufacturer's instructions. Forty-eight hours following transfection, cells were subjected to cell motility assays using Boyden chambers.
Proteins obtained after lysis in SDS buffer and sonication (21) were separated by SDS-PAGE and transferred to nitrocellulose membranes. Membranes were incubated overnight at 4 °C with the following antibodies: anti-VE-cadherin (BV9) (20), anti-β-catenin (BD Biosciences), anti-α-catenin (BD Biosciences), anti-RARα (6), anti-tubulin (Sigma), anti-SNAIL (Cell Signaling), anti-NOTCH1, anti-cleaved NOTCH1 (Val-1744) (Cell Signaling), anti-FLAG (Sigma), anti-HA (Sigma), anti-GFP (Santa Cruz Biotechnology, Inc.), anti-actin (Santa Cruz Biotechnology), anti-SMAD3 (Abcam), and anti-phosphorylated SMAD3 (Ser-423/Ser-425) (Abcam). Blots were rinsed three times with Blotto/Tween 20 and incubated with Cy5-conjugated goat anti-rabbit (GE Healthcare) or Cy3 goat anti-mouse (GE Healthcare) antibodies for 1 h at room temperature. Blots were washed three times in Blotto/Tween 20, rinsed in phosphate-buffered saline, and analyzed using an automated fluorescence scanner (Typhoon, GE Healthcare).
Subcellular Fractionation
Triton X-100-soluble and -insoluble fractions were obtained as described (22). Briefly, cells were incubated with Triton lysis buffer (1% Triton X-100, 0.3 m sucrose, 25 mm HEPES, pH 7.4, 100 mm NaCl, 4.7 mm KCl, 1.2 mm KH2PO4, 1.2 mm MgCl2, protease inhibitors-complete; Roche Applied Science) on a rocking platform for 15 min. After centrifugation for 15 min at 10,000 × g, the supernatant (Triton-soluble fraction) was collected. The Triton-insoluble fraction was resuspended in SDS lysis buffer. Both fractions were reconstituted in equal volumes, and 15 μl of each fraction were analyzed by Western blot.
Cell Motility Assays
Migration assays were performed using Boyden chambers with insets coated on the bottom surface with fibronectin (8.0-μm pore size; BD Biosciences). Subconfluent cell cultures were serum-starved for 24 h prior to harvesting with trypsin-EDTA and seeding (100,000 cells/well) in serum-free medium (DMEM/F-12, 1% BSA) supplemented with the indicated growth factor and/or chemical compound. The lower compartment of the chamber was filled with DMEM/F-12 medium supplemented with 5% charcoal-stripped FBS as chemoattractant and with the indicated growth factor and/or chemical compound. Migrated cells were washed twice with PBS and fixed with 100% ice-cold methanol for 10 min. After methanol removal, cells were stained with crystal violet (0.5% in 25% methanol) for 10 min and washed several times with water. The number of migrated cells was determined by counting three replicates of six independent visual fields per well at ×20 magnification under an inverted microscope (IX71, Olympus).
For wound closure assays, cells were allowed to reach confluence before serum starvation for 24 h. The monolayers were scraped with a plastic pipette tip and replenished with fresh serum-free medium supplemented with vehicle (ethanol), EGF (50 ng/ml), Herg (50 ng/ml), ATRA (1 μm), and combinations thereof. Phase contrast images were obtained 24 h after wounding.
RNA Extraction and Gene Expression Analysis by qRT-PCR
Total RNA was isolated with the miRNeasy minikit (Qiagen, Hilden, Germany). GeneAmp® RNA PCR core kits (Applied Biosystems) were used to perform reverse transcription reactions according to the manufacturer's instructions.
qRT-PCR was performed with the 7300 system (Applied Biosystems) and the TaqMan or SYBR Green technology using Power SYBR® Green PCR Master Mix and TaqMan® Universal Master Mix II (Life Technologies), respectively. Taqman assays for the following mRNAs were purchased from Life Technologies: 18S (Hs99999901_sl 18S), TGFβR2 (Hs00234253_ml), TGFβ3 (Hs01086000_ml), GDF15 (Hs00171132_ml), RARα (Hs00940455_ml), RARβ (Hs00233405_ml), and RARγ (Hs00171273_ml). The following SYBR green amplimers were from Sigma: CYCLOPHYLIN A (forward, 5′-GACCCAACACAAATGGTTCC-3′; reverse, 5′-TTTCACTTTGCCAAACACCA-3′); FOXC2 (forward, 5′-GATCACCTTGAACGGCATCT-3′; reverse, 5′-CTTGACGAAGCACTCGTTGA-3′); SLUG (forward, 5′-TGGTTGCTTCAAGGACACAT-3′; reverse, 5′-TGACCTGTCTGCAAATGCTC-3′); SNAIL (forward, 5′-ACCCCACATCCTTCTCACTG-3′; reverse, 5′-TACAAAAACCCACGCAGACA-3′); TWIST (forward, 5′-CCTTCTCGGTCTGGAGGAT-3′; reverse, 5′-TCCATTTTCTCCTTCTCTGGA-3′); NOTCH1 (forward, 5′-GGTGAGACCTGCCTGAATG-3′; reverse, 5′-GTTGGGGTCCTGGCATC-3′); NICD (forward, 5′-CGGGTCCACCAGTTTGAATG-3′; reverse, 5′-GTTGTATTGTTCGGCACCAT-3′); HES4 (forward, 5′-CCTCAGAAAAGAGAGCTCCCGCC-3′; reverse, 5′-GGCGCGGTACTTGCCCAGAA-3′); HEY2 (forward, 5′-AGGGGGTAAAGGCTACTTTGA-3′; reverse, 5′-TGGCGCAAGTGCTGAGATG-3′); MYC (forward, 5′-TGCTCCATGAGGAGACACC-3′; reverse, 5′-CTCTGACCTTTTGCCAGGAG-3′); CYCLIN D1 (forward, 5′-CCCTCGGTGTCCTACTTCAA-3′; reverse, 5′-AAGACCTCCTCCTCGCACTT-3′).
DNA Extraction and Gene Copy Number Assessment by qRT-PCR
DNA was prepared with the DNeasy blood and tissue kit (Qiagen). RARA gene copy number was determined by qRT-PCR, using the 7300 System (SDS software version 1.3, Applied Biosystems, Foster City, CA). Predesigned TaqMan copy number assays Hs01079964_cn (RARA) were from Applied Biosystems. The ribonuclease P RNA component H1 gene (RPPH1) was used as a reference control. Samples were analyzed in triplicate. Human genomic DNA (catalog no. G1471) (Promega, Madison, WI) was used as a calibrator sample in every assay. Analysis of gene copy number was carried out using the comparative Ct method (23). The copy number of ERBB2 and RARA genes in normal human genomic DNA was set as 2.0, and a copy number of 3.0 was considered as the threshold value for the gene amplification calls.
Whole Genome Gene Expression Microarrays
Gene expression data for SKBR3 cells treated with ATRA (100 nm) were previously deposited (Arrayexpress E-MEXP-3192). For enrichment analysis, we used genes whose expression was significantly altered by ATRA either at 12 or at 48 h (paired t test, p < 0.05) and the Metacore platform (see the Thomson Reuters Web site).
Results
ATRA Induces Adherens and Tight Junctions in SKBR3 Cells
The HER2+ SKBR3 cell line is highly responsive to the anti-proliferative activity of ATRA, because it is characterized by amplification of the gene coding for RARα (6). This luminal cell line does not express typical epithelial or mesenchymal biomarkers, and it is an excellent model to study the action of ATRA on EMT (24–26), a process activated by exposure to EGF (27, 28) and Herg (29). In SKBR3 cells, ATRA increased the amounts of VE-cadherin, α-catenin, and β-catenin (Fig. 1A), which participate in the formation of intercellular contacts (30, 31). ATRA-dependent induction involves both the Triton X-100-soluble and -insoluble pools of the three proteins. Increases in the Triton X-100-insoluble fraction are consistent with relocalization of VE-cadherin and β-catenin to adherens junctions, which were visible only in SKBR3 cells exposed to ATRA (Fig. 1B). VE-cadherin is the only cadherin induced by ATRA in SKBR3 cells (6). In ATRA-induced adherens junctions, VE-cadherin is likely to substitute for E-cadherin, the major adhesion protein observed in the mammary gland epithelium. In fact, SKBR3 cells do not express E-cadherin, because the corresponding gene is deleted (32). In SKBR3 cells, ATRA exposure led also to reorganization of tight junctions and relocalization of occludin as well as ZO-1 to these structures (Fig. 1B).
FIGURE 1.

ATRA induces the formation of adherens junctions and the reorganization of tight junctions. A, SKBR3 cells were treated with vehicle (ethanol) or ATRA (1 μm) for 24 h. The Western blots illustrate the amounts of VE-cadherin, α- and β-catenin, RARα, and tubulin in the Triton X-100-soluble and -insoluble cell extracts. Tubulin serves as a loading control, whereas RARα degradation is associated with ligand-dependent activation of the receptor. B, SKBR3 cells were treated as in A for 48 h. Immunofluorescence analysis was performed for the adherens junction proteins VE-cadherin and β-catenin as well as for the tight junction proteins occludin and ZO-1. The results are representative of at least two independent experiments.
Taken together, our results demonstrate that ATRA increases the number of cell-to-cell contacts. The process may involve activation of a program causing cancer cells to progress along the mammary epithelial differentiation pathway (6).
ATRA Stimulates the Formation of Organized Structures Reminiscent of a Luminal Epithelium in Three-dimensional Cultures of SKBR3 Cells
We used three-dimensional cultures of SKBR3 cells to evaluate whether ATRA-dependent induction of adherens and tight junctions is indeed part of an epithelial differentiation program set in motion by the retinoid. Normal mammary epithelial cells grown in three-dimensional Matrigel cultures respond to microenvironmental stimuli by reducing their proliferation and by differentiating into mammary acinar structures (spheres). These responses are lost in three-dimensional cultures of breast cancer cells (33). In three-dimensional Matrigel cultures, untreated or vehicle-treated SKBR3 cells are organized in grapelike clusters (34) with no apical/basal polarity, as indicated by triple-fluorescence staining with the plasma membrane protein HER2, the Golgi protein GM-130, and the nuclear dye Hoechst (Fig. 2A). Upon challenge with ATRA, the grapelike clusters turn into hollow spheres, which are reminiscent of a normal mammary gland epithelium. These spheres are polarized with HER2 displaying an apico-lateral distribution and the Golgi apparatus oriented toward the lumen. The spherical structures are characterized by cell-to-cell contacts that are maintained by VE-cadherin (Fig. 2B). In fact, anti-VE-cadherin antibodies disrupt cellular interactions and consequently sphere integrity (Fig. 2C).
FIGURE 2.

ATRA induces the formation of organized structures reminiscent of the mammary gland epithelium in three-dimensional cultures of SKBR3 cells. SKBR3 cells were grown in a three-dimensional matrix of Matrigel for 5 days and subsequently treated with ATRA (1 μm) or vehicle (ethanol) for 48 h. A, at the end of the treatment, confocal immunofluorescence analysis was performed for the membrane protein HER2 and the Golgi marker GM130. Cell nuclei were stained with Hoechst. The results are representative of three independent experiments. B, SKBR3 cells were grown and treated as indicated above. At the end of the treatment, cells were subjected to immunofluorescence analysis with anti-VE-cadherin antibodies. The cells were counterstained with Hoechst to visualize cell nuclei. The results are representative of three independent experiments. C, SKBR3 cells were grown as detailed above before treatment with ATRA (1 μm) or vehicle (ethanol) for 24 h. Seventeen hours after ATRA administration, cells were incubated with a blocking anti-VE-cadherin monoclonal antibody (BV9) or control IgG, as indicated. Left, bright field images at the indicated low magnification. Right, high magnifications of bright field images are shown in the bottom left panels, whereas the top two confocal images were obtained by immunofluorescence analysis of the same microscopic fields after challenge with anti-VE-cadherin antibodies (top right panels) and staining of the cell nuclei with Hoechst (top left panels). Merged images of the bright field and the confocal fluorescence-labeled fields are illustrated in the bottom right panels (Merge).
In ATRA-treated cultures, propidium iodide staining demonstrates cell death in undifferentiated grape-like clusters (Fig. 3A). In contrast, no appreciable cell death was evident in ATRA-induced spheres. The observation suggests that spheres consist of viable cells organized into a luminal epithelium. No cell death or caspase activation was detectable in the lumen of spheres (Fig. 3B). Thus, the cavity is likely to result from a structural reorganization of the growing cells rather than an apoptotic process involving the inner cell layer.
FIGURE 3.

Apoptotic responses in three-dimensional cultures of SKBR3 cells exposed to ATRA. SKBR3 cells were grown in a three-dimensional matrix of Matrigel with vehicle (ethanol) or ATRA (1 μm) for 5 days. The results are representative of two independent experiments. A, cells were incubated for 20 min with propidium iodide (PI) to stain necrotic cells, washed in PBS, and subjected to fluorescence microscopy. The panels show representative images of vehicle- and ATRA-treated cultures of SKBR3 cells. High magnifications of bright field images are shown in the top panels, whereas the two middle confocal images were obtained after staining of cells with propidium iodide. Merged images of the bright and the confocal fluorescence-labeled fields are illustrated in the bottom panels (Merge). B, SKBR3 cells were grown as detailed above. High magnifications of bright field images are shown in the top left panels, whereas the bottom two confocal images were obtained after staining of the cell nuclei with Hoechst (bottom left panel) and by immunofluorescence analysis of the same microscopic field after challenge with cleaved caspase-3 targeting antibodies (bottom right panel). A merged image of the bright field and the confocal fluorescence-labeled field are illustrated in the top right panel (Merge).
ATRA Modulates Plasticity in HER2+ Breast Cancer Cells via RARα Independently of Growth Inhibition
We tested whether ATRA-dependent differentiation leading to the generation of organized luminal structures is associated with a growth-inhibitory response. To this purpose, we used a small and homogeneous panel of cell lines belonging to the same HER2+ breast cancer subtype as the SKBR3 counterpart (24, 25). The five selected cell lines are characterized by resistance or sensitivity to the anti-proliferative action of ATRA (Table 1). MDAMB453 and HCC1954 cells, which showed relative resistance to ATRA, were equally unresponsive to the retinoid in three-dimensional cultures (Fig. 4A). Similar to the SKBR3 counterparts, ATRA-sensitive UACC812 cells underwent epithelial differentiation into hollow spherical structures upon challenge with the retinoid (Fig. 4A). In UACC812 spheres, cells were polarized with nuclei located at the periphery (Fig. 4B). These spheres resemble the prototypical epithelial ducts described for three-dimensional cultures of Madin-Darby canine kidney cells (35). The data obtained in our cell lines suggest that the process of growth inhibition set in motion by ATRA is generally accompanied by epithelial differentiation. However, sensitivity to growth inhibition by ATRA in HER2+ breast cancer cells is not sufficient to induce morphological effects. Indeed, three-dimensional cultures of ATRA-sensitive MDAMB361 cells (Fig. 4A) did not show the same retinoid-dependent morphological changes observed in the SKBR3 and UACC812 counterparts, indicating that epithelial differentiation is not a direct consequence of growth inhibition.
TABLE 1.
Characteristics of the HER2-positive breast cancer cell lines and ATRA sensitivity
The table lists the characteristics of the HER2-positive cell lines used in the study and the corresponding sensitivity to ATRA growth-inhibitory activity. L, luminal subtype; B, basal subtype; PE, pleural effusion; PT, primary tumor; BR, brain metastasis; AC, adenocarcinoma; DC, ductal carcinoma; IDC, invasive ductal carcinoma; MetAC, metastatic adenocarcinoma; GI50, concentration of ATRA causing 50% of growth inhibition; Dt, cell line duplication time.
| Cell line | Subtype | ER | PR | HER2 | Source | Tumor type | GI50 | Dt |
|---|---|---|---|---|---|---|---|---|
| nm | days | |||||||
| SKBR3 | L | − | − | + | PE | AC | 5 | 1.5 |
| MDAMB361 | L | + | + | + | BR | MetAC | 211 | 2.0 |
| UACC812 | L | + | − | + | PT | IDC | 353 | 2.7 |
| HCC1954 | B | − | − | + | PT | DC | 3903 | 1.5 |
| MDAMB453 | L | − | − | + | PE | MetAC | >10,000 | 1.5 |
FIGURE 4.

ATRA modulates cell plasticity in three-dimensional cultures of RARα-amplified breast cancer cells. The indicated cell lines were grown in Matrigel for 5 days and treated with ATRA (1 μm) or vehicle (ethanol) for 48 h. A, bright field images of the indicated cultures. The insets illustrate higher magnifications of the fields boxed with dotted lines. The results are representative of at least two independent experiments per cell line. B, UACC812 cells were grown in Matrigel and treated with vehicle or ATRA as detailed above. High magnifications of bright field images are shown in the top left panels, whereas the bottom two confocal images were obtained by immunofluorescence analysis of the same microscopic fields after challenge with anti-HER2 antibodies (bottom right panels) and staining of the cell nuclei with Hoechst (bottom left panels). Merged images of the bright and the confocal fluorescence-labeled fields are illustrated in the top right panels (Merge). The results are representative of three independent experiments.
The HER2+ cell lines considered expressed significant levels of RARα3 and RARγ1, the major RARα and RARγ transcripts (Fig. 5A, left). With the exception of UACC812 cells, which showed barely detectable amounts of the RARβ1 transcript, no significant expression of the main RARβ mRNA was observed in the other cell lines. In all of the cell lines, RARα3 was the most abundant RAR form measured, and the highest levels of the transcript were observed in SKBR3 and UACC812 cells. This is due to the fact that the two cell types are characterized by amplification of the RARA gene, which is part of the HER2 amplicon (Fig. 5A, right) (6). This observation suggests that RARα3 is involved in the formation of ATRA-induced spheric structures. Because ATRA is a pan-RAR agonist, binding and activating RARα, RARβ, and RARγ with the same affinity and efficiency, we compared the action of the RARα agonist AM580, the RARβ agonist BMS641, and the RARγ agonist CD437 on sphere formation in SKBR3 and UACC812 three-dimensional cultures (Fig. 5B). In both cell lines, AM580 is capable of recapitulating the effects of ATRA, whereas BMS641 and CD437 do not induce spheres. It must be noted that BMS961, another RARγ agonist, is equally ineffective as CD437 in inducing spheres (data not shown). Taken together, our results indicate that activation of RARα is necessary and sufficient to trigger the differentiation process leading to the formation of spheres.
FIGURE 5.

RARα, RARβ, and RARγ expression and RARA gene copy number in breast cancer cells; role of RAR isoforms in ATRA-modulated cell plasticity. A, right, the histogram shows the copy number of the RARA gene in a panel of breast cancer cell lines, as determined by qRT-PCR. The threshold value for the amplification of the gene is shown by the horizontal dashed line. Pool, reference human genomic DNA. Each value is the mean ± S.D. of three independent determinations. Left, the bar graph shows the levels of the major RARα, RARβ, and RARγ transcripts expressed in the indicated cell lines and determined by qRT-PCR following reverse transcription of total RNA. Each value is the mean ± S.D. of three replicates. ND, not detectable. B, SKBR3 and UACC812 cells were treated with vehicle (DMSO), the RARα agonist AM580 (100 nm), the RARβ agonist BMS641 (100 nm), and the RARγ agonist CD437 (100 nm), for 48 h. The panels show bright field images of the cell cultures. The results are representative of two independent experiments.
ATRA Modulates EMT and Inhibits SKBR3 Cell Migration
The data obtained in breast cancer cell lines indicate that the differentiation program set in motion by ATRA leads to an increase in cell-to-cell interactions. This process is a key regulator of cancer cell motility, invasiveness, and metastatic spread. In cell lines characterized by plasticity, such as SKBR3, the migratory potential is augmented by acquisition of a mesenchymal phenotype (9) via the reversible process of EMT.
To induce EMT in HER2+ SKBR3 cells, we used EGF and Herg (29, 36), which activate the process through the HER1/HER2 and HER3/HER2 pathways, respectively (27). SKBR3 cells treated with EGF or Herg for 24 h acquired an elongated/fibroblast-like phenotype characteristic of mesenchymal cells (Fig. 6A). ATRA suppressed the EMT-associated morphological changes afforded by EGF and Herg. This was paralleled by induction and reorganization of adherens and tight junctions, as demonstrated by the formation of β-catenin- and ZO-1-containing complexes in cell-to-cell contacts (Fig. 6B). To test whether these actions translate into inhibitory effects on the directional migration of SKBR3 cells, we used Boyden chambers. The studies were complemented by an analysis of the morphological traits of migrating cells performed with the use of wound assays (37). As expected, EGF and Herg caused a dramatic increase in SKBR3 cell migration (Fig. 6C), which was due to an increase in single-cell motility (Fig. 6D). In fact, cells stained for the occludin marker did not show the appearance of tight junctions and an increase in cell-to-cell contacts (Fig. 6D). In Boyden chamber assays, ATRA inhibited the dramatic increase in SKBR3 cell migration caused by EGF and Herg (Fig. 6C). This is likely to be the result of an ATRA-dependent increase in intercellular contacts, as indicated by the relocalization of occludin to tight junctions (Fig. 6D), which causes a shift from single to collective cell migration (37).
FIGURE 6.

EGF/heregulin-induced EMT and migration of SKBR3 cells are counteracted by ATRA. A, subconfluent SKBR3 cells were serum-starved in DMEM/F-12 medium containing 1% BSA for 18 h and subsequently treated with vehicle (ethanol), EGF (50 nm), Herg (50 nm), or ATRA (1 μm) and the indicated combinations for 24 h. Bright field light microscopy images of two-dimensional cultures are shown. The results are representative of at least five independent experiments. B, cells treated as in A were subjected to immunofluorescence analysis for β-catenin and ZO-1, as indicated. The results are representative of at least three independent experiments. C, subconfluent SKBR3 cells were serum-starved as in A. Subsequently, cells were seeded at 1 × 10⁵ cells/well in the transwells of a Boyden chamber and allowed to migrate toward growth medium containing charcoal-stripped 5% FBS in the presence of vehicle (ethanol), EGF (50 nm), Herg (50 nm), ATRA (1 μm), and combinations thereof for 24 h. A quantitative analysis of the number of cells migrated is shown by the bar graph. Each value is the mean ± S.D. of three replicates. The results are representative of three independent experiments. **, significantly different (t test, p < 0.01). D, immunofluorescence analysis of cells cultured, treated as in A, and subjected to wound assays. Wounds were generated at the moment of growth factor/ATRA addition. The right panels represent bright field images of the wound front taken 24 h after growth factor/ATRA addition. The left panels show merged fluorescence images of cells stained with Hoechst (blue fluorescence) to visualize the nuclei and anti-occludin (OC) antibodies (green fluorescence), as indicated. The results are representative of two independent experiments. E, SKBR3 cells were seeded and treated as in C in the presence of ATRA (100 nm), the RARα agonist AM580 (100 nm), the RARβ agonist BMS641 (100 nm), and the RARγ agonist CD437 (100 nm). Cells were subjected to transwell Boyden chamber assays as in C. The number of cells migrated is shown by the bar graph. Each value is the mean ± S.D. of three replicates. The results are representative of three independent experiments. **, significantly different (t test, p < 0.01); *, significantly different (t test, p < 0.05).
To identify the specific RAR isoform mediating the anti-migratory action, we compared the effects of ATRA, AM580, BMS641, and CD437 on the migratory behavior of SKBR3 cells using Boyden chamber assays (Fig. 6E). The RARα agonist AM580 is the only compound capable of mimicking the anti-motility action of ATRA. This effect is likely to result from activation of the same differentiation program set in motion by ATRA and AM580. In fact, AM580 was the sole RAR agonist that inhibited EGF- and Herg-activated EMT (data not shown). In addition and unlike BMS641 or CD437, exposure of SKBR3 cells to AM580 caused the same reorganization of tight junctions observed with ATRA (data not shown).
In conclusion, the results indicate that the epithelial differentiation process triggered by ATRA via RARα activation in retinoid-sensitive and plastic SKBR3 cells is capable of counteracting the EMT responses ignited by two established EMT-inducing agents, like EGF and Herg. EMT inhibition is likely to be a major contributor to the anti-migratory action of ATRA determined in our in vitro models.
ATRA Suppresses the Induction of NOTCH1 and SNAIL Afforded by EMT Activation in SKBR3 Cells
To clarify the molecular mechanisms underlying the inhibitory effects of ATRA on migration, we considered SNAIL, SLUG, NOTCH1, FOXC2, and TWIST, a series of EMT-associated transcription factors. Using qRT-PCR, we evaluated the effects of EGF, Herg, and ATRA alone and in combination on the expression of the corresponding mRNAs.
In SKBR3 cells, SLUG, FOXC2, and TWIST are unlikely to play a role in the EMT process triggered by EGF or Herg and inhibited by ATRA. In fact, TWIST was never detectable in any of the experimental conditions considered (data not shown). In addition, SLUG mRNA expression was left unaffected by EGF, Herg, and ATRA alone or in combination (Fig. 7A). Finally, the FOXC2 transcript was up-regulated only by the retinoid. In contrast, SNAIL and NOTCH1 are potential mediators of ATRA-dependent EMT inhibition. Indeed, EGF and Herg up-regulate SNAIL and NOTCH1 mRNA. Challenge of SKBR3 cells with ATRA left the basal expression levels of SNAIL and NOTCH1 mRNAs unaltered, whereas it suppressed induction of the two transcripts by EGF and Herg (Fig. 7A). The mRNA results were confirmed at the protein level (Fig. 7B). The immunofluorescence analyses conducted on SNAIL indicate that EGF-dependent induction leads to relocalization of the transcription factor into the nucleus of SKBR3 cells (Fig. 7C). Consistent with the suppressive effect of the retinoid on SNAIL induction, the transcription factor was undetectable in the nuclei of cells treated with ATRA and EGF.
FIGURE 7.

ATRA modulates the expression of transcription factors involved in EMT. Subconfluent SKBR3 cells were serum-starved in DMEM/F-12 medium containing 1% BSA for 18 h and subsequently treated with vehicle (ethanol), EGF (50 nm), Herg (50 nm), or ATRA (1 μm) and the indicated combinations for 24 h. A, cells were harvested, and total RNA was extracted to measure the expression of the indicated EMT markers by qRT-PCR after reverse transcription. Each value is the mean ± S.D. of three independent experiments. **, significantly different (t test, p < 0.01). *, significantly different (t test, p < 0.05). B, representative Western blots of the SNAIL and NOTCH1 proteins in SKBR3 cells treated as indicated above. β-Actin was used as a loading control. The results are representative of three independent experiments. C, immunofluorescence analyses of cells cultured and treated as indicated above. The middle and left panels show fluorescence images of cells stained with Hoechst (blue fluorescence) to visualize the nuclei and anti-SNAIL antibodies (green fluorescence), as indicated. Merged images (Merge) are shown in the right panels. The results are representative of two independent experiments.
ATRA-dependent Suppression of EMT-associated NOTCH1 Induction Is Accompanied by Reduction of the Derived NICD Cleavage Product
Given the predicted significance in breast cancer progression and the role played in the metastatic process of this tumor (38–40), we studied the regulation of NOTCH1 by ATRA in more detail.
In a first set of experiments, we evaluated whether NOTCH1 down-regulation by ATRA is the result of a transcriptional effect and performed transfection studies with a luciferase construct controlled by the NOTCH1 promoter (41). EGF stimulated luciferase activity in SKBR3 cells transfected with the construct, and ATRA counteracted this effect (data not shown). These results support the concept that NOTCH1 down-regulation by the retinoid is the result of a transcriptional effect.
In a second set of experiments, we evaluated whether post-transcriptional effects contribute to NOTCH1 down-regulation by ATRA. In fact, the NOTCH1 gene codes for a cell membrane-bound precursor, which can be processed into NICD via two sequential proteolytic steps involving ADAM/TACE and γ-secretase. NICD consists of the intracellular carboxyl-terminal portion of the protein, which translocates to the nucleus, where it acts as a transcription factor (14). Thus, we evaluated whether ATRA exerts any effect on NOTCH1 proteolytic cleavage following EMT activation by EGF. The total amounts of NOTCH1 and NICD were determined by Western blot analyses with an antibody recognizing the C-terminal portion of the protein (Fig. 8A). As expected, treatment of SKBR3 cells with EGF caused an increase in NOTCH1 + NICD, which was suppressed by ATRA. To determine the amounts of NICD specifically, we used an antibody targeting Val-1744 (42). The data indicate that the surge of NICD in SKBR3 cells exposed to EGF is also blocked by ATRA. This demonstrates that ATRA-dependent down-regulation of the NOTCH1 transcript translates into a decrease in the corresponding precursor and the γ-secretase processed product. To further evaluate the effects of EGF and/or ATRA in SKBR3 cells, we performed confocal immunofluorescence studies in conditions allowing specific visualization of membrane-associated NOTCH1. EGF caused a remarkable increase in the amounts of NOTCH1 (Fig. 8B). In contrast, ATRA did not alter the basal levels of NOTCH1 in conditions causing the expected increase in tight junction-associated β-catenin (see also Fig. 1B). Additionally, the retinoid suppressed EGF-dependent up-regulation of membrane-boundNOTCH1. Incidentally, it is interesting to note that ATRA-induced β-catenin does not co-localize with NOTCH1, indicating that the two proteins are located in different domains of the plasma membrane.
FIGURE 8.

ATRA suppresses the induction of the NOTCH1 protein caused by EGF in SKBR3 cells. Subconfluent SKBR3 cells were serum-starved in DMEM/F-12 medium containing 1% BSA for 18 h and subsequently treated with vehicle (ethanol), EGF (50 nm), Herg (50 nm), or ATRA (1 μm) and the indicated combinations for 24 h. A, representative Western blot of NOTCH1 and the NICD cleavage product in SKBR3 cells treated with vehicle, ATRA, EGF, and EGF + ATRA as indicated above. Tubulin was used as a loading control. The results are representative of three independent experiments. B, immunofluorescence analyses of cells cultured and treated as indicated above. The top left panels show confocal images of cells stained with Hoechst (blue fluorescence) to visualize the nuclei. The top right and bottom left panels show images of cells labeled with anti-NOTCH1 (green fluorescence) and anti-β-catenin antibodies (red fluorescence), as indicated. Merged images (Merge) are shown in the bottom right panels. The results are representative of two independent experiments. C, top, a schematic representation of the constitutive active NOTCH1 plasmid construct used for the overexpression experiment. Bottom, SKBR3 cells were transfected with the NOTCH1 plasmid construct along with a GFP-encoding plasmid as a control for the transfection efficiency. Subconfluent cultures were split, and 24 h later, they were serum-starved for 18 h. At the end of this procedure, cells were treated with vehicle (ethanol), ATRA (1 μm), DAPT (1 μm), and a combination of the two compounds for a further 24 h. Shown are Western blot analyses performed with antibodies recognizing the indicated proteins or domains of the NOTCH1 protein encoded by the transfected plasmid construct.
We evaluated whether the ATRA-dependent decrease in NICD levels is simply consequent to down-regulation of the precursor mRNA/protein or if it is also due to inhibition of γ-secretase-dependent NOTCH1 cleavage. To this purpose, we overexpressed a membrane-tethered, ligand-independent NOTCH1 derivative, which is constitutively cleaved into NICD (43). In this construct, NOTCH1 was tagged with an N-terminal HA epitope located upstream of the γ-secretase cleavage site and a C-terminal FLAG epitope (Fig. 8C). Western blots performed with anti-HA antibodies demonstrated similar steady-state levels of the NOTCH1 precursor protein in SKBR3 cells treated with vehicle, the γ-secretase inhibitor DAPT (44), ATRA, and ATRA + DAPT (Fig. 8C). In these experimental conditions, DAPT was fully active, as demonstrated by the results obtained with the anti-NICD antibody. Finally and more importantly, ATRA exerted no effect on the FLAG-tagged NOTCH1 protein, whose levels were increased by DAPT as predicted. Taken together, these results demonstrate that ATRA does not affect γ-secretase cleavage of NOTCH1. Thus, suppression of EGF-dependent NICD induction by ATRA is solely the result of a transcriptional effect causing a reduction in the levels of the NOTCH1 mRNA and protein.
NOTCH1 and TGFβ Mediate the Anti-migratory Activity of ATRA in SKBR3 Cells
Because NOTCH1 stimulates migration in breast cancer cells (45), retinoid-dependent inhibition of NOTCH1 expression may contribute to the anti-migratory action of ATRA in SKBR3 cells challenged with EGF. To test this hypothesis, we evaluated the effect of DAPT on the promigratory action of EGF. In conditions of NOTCH1 proteolytic cleavage inhibition (Fig. 9, right), treatment of SKBR3 cells with DAPT resulted in a complete suppression of the motile response activated by the growth factor (Fig. 9, left and middle). These results demonstrate that processing of NOTCH1 into NICD is necessary for the pro-migratory activity of EGF. In addition, they are consistent with the idea that NOTCH1 down-regulation is involved in ATRA anti-motility action.
FIGURE 9.
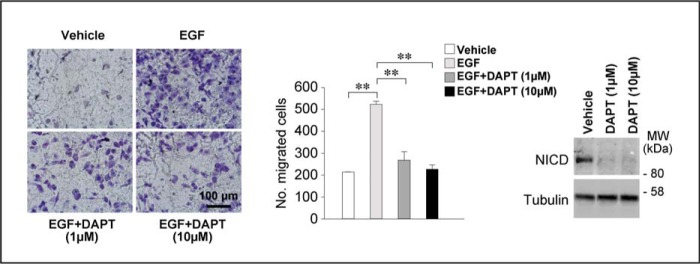
NOTCH1 signaling pathway is involved in the anti-migratory action of ATRA. Left, subconfluent SKBR3 cells were serum-starved for 18 h. Subsequently, cells were seeded at 1 × 10⁵ cells/well on the transwells of a Boyden chamber in the presence of serum-free medium containing vehicle (DMSO) and the γ-secretase inhibitor DAPT (1 and 10 μm) in the presence and absence of EGF (50 nm) for 24 h. Cells were allowed to migrate toward the same growth medium supplemented with charcoal-stripped 5% FBS. Shown are representative images of the cells adhering to the lower side of the transwell membrane. Middle, the bar graph shows a quantitative analysis of the number of cells migrated. Each value is the mean ± S.D. of three replicates. The results are representative of three independent experiments. **, significantly different (t test, p < 0.01). Right, subconfluent SKBR3 cells were treated as described. Cells were harvested by trypsinization, and Western blot analysis was performed to determine the expression levels of the NICD protein. Tubulin was used as a loading control.
The network of NOTCH-interacting genes and proteins is complex (Fig. 10), and it contains many growth factors, including TGFβ, EGF, and Herg (Neuregulin1 in Fig. 10). TGFβ is of particular interest, because it is a well known mediator of ATRA activity in breast cancer cells and it is an EMT inducer (9). The TGFβ pathway contains elements that lie both upstream and downstream of NOTCH1 activation. Pathway-map and process-network analyses of the genes differentially expressed in SKBR3 cells challenged with ATRA (6) demonstrated a significant enrichment of both the NOTCH1 and TGFβ signaling pathways (Table 2 and Table 3). Given the role played by both NOTCH1 and TGFβ in EMT, it is not surprising that this is the most enriched process-network modulated by ATRA in our experimental model. Interestingly, many of the genes regulated by ATRA are indeed part of the TGFβ pathway (Fig. 10). In particular, ATRA down-regulated TGFβ3, and it up-regulated GDF15, TGFβRII, and SMAD3 (Fig. 11, A and B, right). Thus, ATRA acts at multiple levels along the TGFβ signal transduction pathway, controlling the steady-state levels of two ligands (TGFβ3 and GDF15), a type II receptor (TGFβRII), and one of the major intracellular signal transducers (SMAD3). In a related series of experiments, we evaluated whether EGF exerts any effect on the members of the TGFβ pathway regulated by ATRA. These analyses were conducted both in the absence and in the presence of ATRA. EGF regulated the TGFβ3 and GDF15 mRNAs and the SMAD3 protein (Fig. 11, A and B). Thus, the growth factor interferes with the TGFβ pathway in SKBR3 cells. Interestingly, both EGF and ATRA down-regulate TGFβ3 and induce GDF15 mRNAs, despite the opposite effects exerted by EGF and ATRA on EMT. EGF-dependent down-regulation of TGFβ3 is not enhanced by the addition of ATRA, whereas EGF-dependent induction of GDF15 is enhanced by the retinoid. Conversely and in line with the relative action on EMT, up-regulation of the TGFβRII transcript by ATRA is suppressed by EGF.
FIGURE 10.

ATRA-dependent regulation of genes belonging to the NOTCH pathway in SKBR3 cells. Schematic diagram of the genes belonging to the NOTCH signal transduction pathway (MetacoreTM). The genes up- and down-regulated by ATRA in SKBR3 cells treated with the retinoid for 12 and 48 h (6) are indicated with blue (down-regulation) and red (up-regulation) solid circles. Genes whose expression is significantly modified by ATRA in the same direction at both 12 and 48 h are marked by a surrounding open red or open blue circle.
TABLE 2.
Pathway enrichment analysis in SKBR3 cells treated with ATRA
We performed enrichment analysis of the genes regulated by ATRA using Metacore-annotated pathway maps (see the Thomson Reuters Web site). Each pathway map represents a multistep canonical pathway backed by “small experiment” evidence in the literature. The pathways of particular relevance for our study are indicated in boldface type. FDR, false discovery rate.
| No. | Pathway maps | Total genes | ATRA-modulated | p | FDR |
|---|---|---|---|---|---|
| 1 | Cell adhesion_Chemokines and adhesion | 100 | 52 | 9.44E − 15 | 8.17E − 12 |
| 2 | Cytoskeleton remodeling_TGF, WNT and cytoskeletal remodeling | 111 | 54 | 1.07E − 13 | 4.64E − 11 |
| 3 | Cytoskeleton remodeling_Cytoskeleton remodeling | 102 | 49 | 2.72E − 12 | 7.83E − 10 |
| 4 | Ligand-independent activation of androgen receptor in prostate cancer | 67 | 35 | 1.93E − 10 | 4.18E − 08 |
| 5 | Development_EGFR signaling pathway | 71 | 36 | 3.19E − 10 | 5.52E − 08 |
| 6 | Signal transduction_PKA signaling | 51 | 29 | 4.89E − 10 | 6.59E − 08 |
| 7 | Immune response_HSP60 and HSP70/TLR signaling pathway | 54 | 30 | 5.33E − 10 | 6.59E − 08 |
| 8 | Signal transduction_PTEN pathway | 46 | 27 | 7.32E − 10 | 7.92E − 08 |
| 9 | Aberrant B-Raf signaling in melanoma progression | 55 | 30 | 9.73E − 10 | 9.35E − 08 |
| 10 | Immune response_HMGB1/RAGE signaling pathway | 53 | 29 | 1.68E − 09 | 1.45E − 07 |
| 11 | Apoptosis and survival_BAD phosphorylation | 42 | 25 | 2.09E − 09 | 1.64E − 07 |
| 12 | DNA damage_ATM/ATR regulation of G1/S checkpoint | 32 | 21 | 3.3E − 09 | 2.33E − 07 |
| 13 | Signal transduction_AKT signaling | 43 | 25 | 4.14E − 09 | 2.33E − 07 |
| 14 | Apoptosis and survival_TNFR1 signaling pathway | 43 | 25 | 4.14E − 09 | 2.33E − 07 |
| 15 | Immune response_MIF-induced cell adhesion, migration and angiogenesis | 46 | 26 | 4.65E − 09 | 2.33E − 07 |
| 16 | Development_TGF-β-dependent induction of EMT via RhoA, PI3K, and ILK | 46 | 26 | 4.65E − 09 | 2.33E − 07 |
| 17 | Ovarian cancer (main signaling cascades) | 64 | 32 | 4.84E − 09 | 2.33E − 07 |
| 18 | Development_Regulation of epithelial-to-mesenchymal transition (EMT) | 64 | 32 | 4.84E − 09 | 2.33E − 07 |
| 19 | LRRK2 in neurons in Parkinson disease | 33 | 21 | 7.54E − 09 | 3.43E − 07 |
| 20 | Development_Gastrin in cell growth and proliferation | 62 | 31 | 8.42E − 09 | 3.53E − 07 |
| 21 | Development_PIP3 signaling in cardiac myocytes | 47 | 26 | 8.63E − 09 | 3.53E − 07 |
| 22 | Cell cycle_Chromosome condensation in prometaphase | 21 | 16 | 8.97E − 09 | 3.53E − 07 |
| 23 | IGF family signaling in colorectal cancer | 60 | 30 | 1.46E − 08 | 5.51E − 07 |
| 24 | Development_Cytokine-mediated regulation of megakaryopoiesis | 57 | 29 | 1.54E − 08 | 5.54E − 07 |
| 25 | Development_Prolactin receptor signaling | 58 | 29 | 2.55E − 08 | 8.53E − 07 |
TABLE 3.
Process/network enrichment analysis in SKBR3 cells treated with ATRA
We performed enrichment analysis of the genes regulated by ATRA using Metacore-annotated process networks (see the Thomson Reuters Web site). The content of these cellular and molecular processes is defined and annotated by Thomson Reuters scientists. Each process represents a preset network of protein interactions characteristic for the process. The processes of particular relevance for our study are indicated in boldface type.
| No. | Process networks | Total genes | ATRA-modulated | p | FDR |
|---|---|---|---|---|---|
| 1 | Development_EMT_Regulation of epithelial-to-mesenchymal transition | 225 | 104 | 2.2426E − 10 | 3.5657E − 08 |
| 2 | Cell cycle_G1-S growth factor regulation | 195 | 92 | 6.7242E − 10 | 5.3457E − 08 |
| 3 | Cell cycle_G2-M | 206 | 95 | 1.6024E − 09 | 8.4929E − 08 |
| 4 | Signal transduction_WNT signaling | 177 | 83 | 6.6881E − 09 | 2.6585E − 07 |
| 5 | Cell cycle_Mitosis | 179 | 83 | 1.2834E − 08 | 4.0814E − 07 |
| 6 | Reproduction_Progesterone signaling | 214 | 93 | 8.7775E − 08 | 2.326E − 06 |
| 7 | Cell cycle_G1-S interleukin regulation | 128 | 62 | 1.2866E − 07 | 2.9225E − 06 |
| 8 | Development_Hemopoiesis, erythropoietin pathway | 136 | 64 | 3.085E − 07 | 5.9313E − 06 |
| 9 | Development_Blood vessel morphogenesis | 228 | 96 | 3.3573E − 07 | 5.9313E − 06 |
| 10 | Apoptosis_Anti-apoptosis mediated by external signals via MAPK and JAK/STAT | 179 | 79 | 3.8476E − 07 | 6.1177E − 06 |
| 11 | Inflammation_TREM1 signaling | 145 | 66 | 9.1905E − 07 | 1.3285E − 05 |
| 12 | Inflammation_Amphoterin signaling | 118 | 55 | 3.0139E − 06 | 3.9935E − 05 |
| 13 | Inflammation_IL-6 signaling | 119 | 55 | 4.1577E − 06 | 5.0852E − 05 |
| 14 | Development_Hedgehog signaling | 254 | 100 | 7.394E − 06 | 8.3975E − 05 |
| 15 | Cytoskeleton_Actin filaments | 176 | 74 | 7.9534E − 06 | 8.4306E − 05 |
| 16 | Cell adhesion_Integrin-mediated cell-matrix adhesion | 214 | 86 | 1.283E − 05 | 0.00012069 |
| 17 | Reproduction_Feeding and neurohormone signaling | 211 | 85 | 1.2904E − 05 | 0.00012069 |
| 18 | Cell cycle_S phase | 149 | 64 | 1.4311E − 05 | 0.00012216 |
| 19 | Cytoskeleton_Spindle microtubules | 109 | 50 | 1.4597E − 05 | 0.00012216 |
| 20 | Inflammation_IL-2 signaling | 104 | 48 | 1.7613E − 05 | 0.00014002 |
| 21 | Apoptosis_Anti-apoptosis mediated by external signals via NF-κB | 111 | 50 | 2.6843E − 05 | 0.00019491 |
| 22 | Signal transduction_NOTCH signaling | 236 | 92 | 2.6969E − 05 | 0.00019491 |
| 23 | Inflammation_IFN-γ signaling | 110 | 49 | 4.6056E − 05 | 0.00031838 |
| 24 | Signal Transduction_TGF-β, GDF and activin signaling | 154 | 64 | 4.9437E − 05 | 0.00031887 |
| 25 | Cell adhesion_Attractive and repulsive receptors | 175 | 71 | 5.0136E − 05 | 0.00031887 |
FIGURE 11.

The TGFβ signaling pathway is involved in the anti-migratory action of ATRA. A, subconfluent SKBR3 cells were treated with vehicle (ethanol), EGF (50 nm), ATRA (1 μm), or ATRA + EGF in the absence or presence of the TGFβ-receptor kinase inhibitor SB431542 (10 μm) for 24 h. Total RNA was extracted, reverse transcribed, and subjected to qRT-PCR with Taqman assays specific for the TGFβ3, TGFβRII, and GDF15 mRNA. Each value is the mean ± S.D. of three replicate cell cultures. **, significantly different (t test, p < 0.01). B, left, subconfluent SKBR3 cells were serum-starved for 18 h and incubated with the TGFβ-receptor kinase inhibitor SB431542 (10 μm) or vehicle (DMSO) for 1 h. Subsequently, cells were seeded at 1 × 10⁵ cells/well on the transwells of a Boyden chamber in the presence of serum-free medium supplemented with EGF (50 nm). Cells were treated with vehicle (DMSO and ethanol) or ATRA (1 μm) in the presence/absence of SB431542 (10 μm) for 24 h and allowed to migrate toward the same growth medium supplemented with charcoal-stripped 5% FBS. Shown are representative images of the cells adhering to the lower side of the transwell membrane. Middle, the bar graph shows a quantitative analysis of the number of cells migrated. Each value is the mean ± S.D. of three replicates. The results are representative of three independent experiments. **, significantly different (t test, p < 0.01). *, significantly different (t test, p < 0.05). Right, subconfluent SKBR3 cells were serum-starved and then incubated with vehicle (DMSO), ATRA (1 μm), and EGF (50 nm), alone or in combination, in the presence/absence of SB431542 (10 μm) for 24 h. Western blot analysis was performed to determine the expression levels of SMAD3, the phosphorylated/activated form of SMAD3, and the NICD proteins. Tubulin was used as a loading control. The results are representative of three independent experiments. C, SKBR3 cells were transfected with a SMAD-3 targeting (siRNA-SMAD3) or a control (siRNA-C) siRNA. 48 h after transfection, cells were serum-starved for 18 h. Left, cell extracts were prepared and subjected to Western blot analysis to confirm SMAD3 silencing. The panel illustrates the results obtained with anti-SMAD3 antibodies. Tubulin was used as a loading control. Middle and right, after serum starvation, cells were treated with vehicle (DMSO) or ATRA (1 μm) in the presence of EGF (50 nm) and subjected to Boyden chamber assays as detailed in B. The pictures show representative images of the cells adhering to the lower side of the transwell membrane. A quantitative analysis of the number of cells migrated is shown by the bar graph. Each value is the mean ± S.D. of three replicates. *, significantly different (t test, p < 0.05).
To directly define the functional involvement of the TGFβ pathway in the NOTCH1-dependent anti-migratory effects exerted by ATRA, SKBR3 cells were exposed to EGF and subjected to Boyden chamber assays using the TGFβRI inhibitor, SB431542. Consistent with the involvement of TGFβ in EMT (46), SB431542 reduced the pro-migratory action of EGF (Fig. 11B, left and middle). Paradoxically, however, TGFβRI inhibition causes a partial and reproducible reversion of the anti-motility action of ATRA observed in cells exposed to EGF. Binding of TGFβ receptors results in the activation of the transcription factor, SMAD3, which plays a central role in this signal transduction pathway (46, 47). To confirm and extend the data obtained with SB431542, we silenced SMAD3 (6) with a validated siRNA (Fig. 11C, left) and evaluated the effects of this knockdown on the migratory behavior of SKBR3 cells exposed to EGF, ATRA, and ATRA + EGF. Down-regulation of SMAD3 and consequent downstream inhibition of the TGFβ signal transduction pathway inhibit the migration of SKBR3 cells challenged with EGF. In contrast and similar to what is observed with SB431542, SMAD3 knockdown causes an increase in the number of migrated cells observed following challenge with ATRA + EGF. Taken together, the data indicate that ATRA causes a switch of the TGFβ pathway from pro-migratory to anti-migratory.
ATRA Controls the Phosphorylation/Activation of SMAD3
ATRA is likely to modulate the levels and the activation state of SMAD3 via TGFβ. In addition, SMAD3 may contribute to NOTCH1 down-regulation by ATRA in SKBR3 cells exposed to EGF. Both ATRA and EGF increase the amounts of the SMAD3 protein. SMAD3 induction was enhanced by the combination of ATRA and EGF (Fig. 11B, right). Unlike EGF, ATRA not only increases SMAD3 expression; it also induces activation of the transcription factor via phosphorylation of its carboxyl-terminal domain at Ser-423 and Ser-425. Ser-423 and Ser-425 phosphorylation by ATRA is mediated by TGFβ, as the specific TGFβRI inhibitor, SB431542, abrogates it. Consistent with the reported relevance of these SMAD3 phosphorylation sites for the growth-inhibitory action of TGFβ (47, 48), ATRA-dependent phosphorylation is counteracted by a growth factor like EGF. These data indicate that both ATRA and EGF modulate the levels of SMAD3, although the two stimuli exert differential effects on the activation status of the TGFβ mediator. With respect to this last point, it is interesting to note that EGF phosphorylates SMAD3 in the linker domain on sites other than Ser-423 and Ser-425, and this phosphorylation site has been associated with the pro-invasive action of the TGFβ pathway (47, 48). We propose that differential phosphorylation of SMAD3 by ATRA and EGF may explain the paradoxical effects on cell migration exerted by activation of the TGFβ pathway in SKBR3 cells.
Because the anti-migratory action of the TGFβ pathway activated by ATRA involves NOTCH1, the effects of SB431542 on NICD levels were evaluated in SKBR3 cells exposed to EGF, ATRA, and ATRA + EGF. SB431542 did not exert any significant and reproducible effect on the levels of NICD observed in any of the experimental conditions considered (Fig. 11B, right). Similarly, SB431542 did not affect the levels of the NOTCH1 mRNA (data not shown). Taken together, our results support the idea that ATRA-dependent induction of the TGFβ pathway does not interfere with NOTCH1 activation.
The Anti-proliferative Action of ATRA Is Mediated by NOTCH1 in HCC1599 Breast Cancer Cells
The relevance of NOTCH1 for the anti-tumor action of ATRA may not be limited to the control of breast cancer cell migratory behavior and invasiveness and may extend to other processes, such as cell growth. However, given the very low basal expression level of NICD, SKBR3 cells are not suitable to define whether NOTCH1 inhibition contributes to the anti-proliferative action of ATRA. For this reason, we turned to HCC1599 breast cancer cells, which are characterized by addiction to NOTCH1 in terms of growth (49). This cell line is exquisitely sensitive to the anti-proliferative action of the retinoid (GI50 = 30 nm). With the highest concentrations of ATRA, growth inhibition was already evident after 3 days, although the maximal anti-proliferative effects were observed after 6 days of treatment (Fig. 12A). Maximal growth inhibition was preceded by down-regulation of the NOTCH1 mRNA (Fig. 12B) and the NICD protein (Fig. 12C). In fact, complete disappearance of NICD was observed after 4 days of treatment with ATRA. In the same experimental conditions, DAPT did not alter NOTCH1 mRNA levels (Fig. 12B), whereas it caused an early and long-lasting suppression of NOTCH1 processing into NICD (Fig. 12C). Co-treatment of HCC1599 cells with ATRA and DAPT enhanced the growth-inhibitory effects exerted by the single components of the combination (Fig. 12D). In this cellular model, ATRA- and DAPT-induced growth arrest is accompanied by down-regulation of the NOTCH1 target genes, c-MYC, CCND1 (cyclin D1), HEY2 (Hes-related family basic helix-loop-helix transcription factor with YRPW motif 2), and HES4 (Hes family basic helix-loop-helix transcription factor 4) (Fig. 12E). In this case too, combined treatment of HCC1599 cells with ATRA and DAPT results in enhanced down-regulation of three (c-MYC, CCND1, and HES4) of the four NOTCH1-regulated genes (13, 14). The additive/synergistic anti-proliferative and gene regulatory effects observed with the combination are consistent with the idea that ATRA and DAPT act at two different points along the NOTCH1 activation pathway (i.e. gene transcription and post-translational processing). In addition, our results indicate the existence of a cross-talk between the retinoid and the NOTCH1 signaling pathways, not only in terms of cell motility but also as far as cell growth is concerned.
FIGURE 12.

NOTCH1 is involved in the anti-proliferative effects exerted by ATRA in NOTCH-addicted HCC1599 breast cancer cells. A, HCC1599 cells were treated for 3 and 6 days with increasing concentration of ATRA as indicated and subjected to the CellTiter-Glo assay to determine growth and viability. The graph shows the growth-inhibitory effect exerted by the retinoid. **, significantly different (t test, p < 0.01);*, significantly different (t test, p < 0.05). B, HCC1599 cells were incubated with vehicle (DMSO), DAPT (1 μm), ATRA (1 μm), or a combination for 24 h. Cells were harvested, and total RNA was extracted to measure the expression of NOTCH1 (NICD) by qRT-PCR after reverse transcription. Each value is the mean ± S.D. of six independent replicates. **, significantly different (t test, p < 0.05). C, HCC1599 cells were incubated with vehicle (DMSO), DAPT (1 μm), ATRA (1 μm), or a combination for the indicated amount of time. Western blot analysis was performed to analyze NICD expression levels. Tubulin was used as a loading control. D, cells were treated as in B for the indicated amount of time and subjected to the CellTiter-Glo assay to determine growth and viability. Each value is the mean ± S.D. of three independent replicates. **, significantly different from vehicle-treated cells (t test, p < 0.01). The results are representative of two independent experiments. E, cells were treated as in B, and RNA was extracted to determine the expression levels of the indicated NOTCH1 target genes by qRT-PCR after reverse transcription. Each value is the mean ± S.D. of six independent replicates. **, significantly different from vehicle-treated cells (t test, p < 0.01); *, significantly different (t test, p < 0.05).
Discussion
The paradigmatic retinoid, ATRA, is the first example of a clinically useful cyto-differentiating agent; it is approved for the treatment of acute promyelocytic leukemia, a rare form of acute myelogenous leukemia in the adult (50). ATRA is proposed as an antitumor agent not only in the context of hematological malignancies but also for the chemoprevention and treatment of breast cancer (1). Unlike classic chemotherapeutics, which are direct cytotoxic agents, the anti-leukemic activity of ATRA in APL blasts is primarily the result of anti-proliferative and cyto-differentiating effects. Similar mechanisms are likely to be at the basis of the anti-tumor action of ATRA in breast cancer, because one of the physiological roles of vitamin A is the control of epithelial homeostasis in the mammary gland (51, 52).
In this report, we demonstrate that ATRA exerts a strong anti-migratory action in the SKBR3 cell line, which is representative of a particular subtype of HER2+ breast cancer characterized by unique sensitivity to the anti-tumor action of the retinoid, because of an amplification of the RARA locus, coding for RARα (6). Our results indicate that ATRA is endowed with anti-migratory properties, which may contribute to the overall anti-tumor activity of this compound in breast cancer, influencing the tissue invasion and metastatic processes. The anti-migratory action of ATRA is observed in conditions in which the process is stimulated by well known inducers of EMT, like the growth factors EGF and Herg. Collectively, our data are consistent with the idea that the anti-migratory action of ATRA is largely the result of regulatory effects on the process of EMT, which is associated with the invasive and metastatic behavior of the cancer cell (53), and it is considered to play a crucial role in tumor progression (9).
In the plastic SKBR3 cell line, the action of ATRA is likely to be secondary to the activation of a mammary epithelial differentiation program. Activation of the program causes an increase in cell-to-cell contacts via the formation of adherens junctions and the reorganization of tight junctions. These phenomena are at the basis of the anti-migratory action of ATRA. Consistent with the activation of an epithelial differentiation program, three-dimensional cultures of SKBR3 cells exposed to ATRA give rise to polarized structures reminiscent of mammary gland acini (33). The phenomenon is not a general feature of cell lines sensitive to the anti-proliferative effects of ATRA, as indicated by the results obtained on a small and homogeneous panel of HER2+ breast cancer cell lines endowed with different sensitivity to the ATRA anti-proliferative action. It is interesting to notice that SKBR3 and UACC812 are the only HER2+ cell lines of the panel undergoing differentiation into polarized epithelial structures in our three-dimensional culture conditions. Both cell lines are characterized by amplification of the RARA gene encoding RARα, which we identified as the receptor responsible for the differentiating action of ATRA (6). Our data are of relevance for a recent study, demonstrating that unliganded RARα triggers cell migration via EMT induction in a model of MCF10A engineered for the overexpression of the retinoid receptor and HER2 (54). Thus, the presence of pharmacological concentrations of ATRA modifies the activity of RARα in the processes of EMT and cell migration.
The present study also provides insights into the molecular mechanisms at the basis of the modulating effects exerted by ATRA on EMT and cell migration. Modulation of the NOTCH1 signal transduction pathway seems to play a major role in the anti-motility responses activated by ATRA in the SKBR3 model. This is consistent with the well known regulatory action of the protein on EMT in breast cancer cells (15, 17). NOTCH1 expression levels are induced by EGF and Herg in SKBR3 cells, and ATRA counteracts this effect. ATRA-dependent inhibition of NOTCH1 expression is the result of a transcriptional action and does not involve modulation of the post-translational activation step carried out by γ-secretase. In fact, ATRA does not affect γ-secretase-dependent cleavage of the NOTCH1 precursor into the transcriptionally active NICD form of the protein, although we cannot exclude the possibility that the retinoid acts on other post-transcriptional regulatory checkpoints (13). The results obtained with the γ-secretase inhibitor, DAPT, which suppresses the migration of SKBR3 cells challenged with EGF, strongly support the functional relevance of the NOTCH1 pathway in the anti-motility action of ATRA. This is in agreement with a previous report demonstrating that NOTCH1 activation favors the motility and invasive ability of epithelial cancer cells (45).
The TGFβ pathway is a second signal transduction system that is of fundamental importance for the anti-migratory action of ATRA in our cellular model. TGFβ is generally considered to be an EMT inducer (55); hence, activation of the corresponding pathway would be expected to increase the migratory potential of breast cancer cells. In contrast, the data obtained in SKBR3 cells exposed to ATRA and EGF indicate that the picture is much more complex. Challenge of SKBR3 cells with ATRA activates the TGFβ pathway, as indicated by increased phosphorylation of the intracellular SMAD3 signal transducer. Nevertheless, the effects observed upon suppression of the TGFβ pathway with SB431542 and SMAD3 silencing are paradoxical. Inhibition of TGFβ signaling reduces the EGF-induced migratory behavior of SKBR3 cells, whereas it stimulates motility in ATRA + EGF-treated cells. This is consistent with a dual role of the TGFβ pathway in EMT, which is dependent on the exposure of the neoplastic cell to pharmacological concentrations of ATRA. In the absence of ATRA, activation of the TGFβ pathway exerts the expected pro-migratory action. In the presence of ATRA, a functional switch of the TGFβ pathway to an anti-migratory determinant is observed. Interestingly, ATRA-dependent activation of the TGFβ pathway in SKBR3 cells results in the phosphorylation of Ser-423 and Ser-425 of SMAD3, whereas EGF-dependent activation of the pathway does not result in the phosphorylation of the same residues. EGF inhibits the phosphorylation of Ser-423 and Ser-425. This differential effect on SMAD3 phosphorylation/activation may contribute to the switch of TGFβ action on EMT observed in the absence and presence of ATRA.
The TGFβ and NOTCH pathways are highly integrated, which raises the question of whether ATRA-dependent down-regulation of NOTCH1 influences the activation state of the TGFβ signal transduction system or if the opposite is true. In our experimental conditions, inhibition of TGFβRI by SB431542 in ATRA-treated SKBR3 cells affects neither the amounts of NICD protein nor the levels of the NOTCH1 mRNA. The observation suggests that stimulation of the TGFβ pathway by ATRA lies downstream of NOTCH1 activation. At present, the elements of the TGFβ pathway responsible for the paradoxical effects of the growth factor on the action of ATRA on cell motility are unknown.
The action of ATRA on the NOTCH pathway is of relevance not only for the anti-migratory but also for the anti-proliferative responses triggered by ATRA, as indicated by the results obtained in the HCC1599 cell line. This cell line is representative of NOTCH1-addicted breast cancer cells, because it is characterized by high levels and constitutive activation of the protein. In addition, the proliferation of HCC1599 cells in culture is dependent on NOTCH1 (49, 56). Interestingly, this model is extremely sensitive to ATRA, despite the basal phenotype and estrogen receptor negativity, which are determinants of retinoid resistance in breast cancer cells (57). In HCC1599 cells, our data support the concept that down-regulation of NOTCH1 contributes to the growth-inhibitory action of ATRA. In fact, combined treatment of the cell line with ATRA and the γ-secretase inhibitor, DAPT, causes a synergistic growth-suppressing effect. Interestingly, the anti-proliferative action of ATRA and DAPT in NOTCH1-addicted cells is associated with a synergistic down-regulation of NOTCH1 target genes. Besides their interest for the molecular mechanisms underlying the action of ATRA, these data suggest further studies aimed at evaluating whether NOTCH1 activation represents a biomarker of ATRA sensitivity in the context of triple negative breast cancer.
The present study unveils a new aspect of ATRA activity on breast cancer epithelial cells (i.e. regulation of phenotypic cell plasticity). Our study supports and revives the long-standing and clinically unexploited idea that the paradigmatic retinoid, ATRA, is endowed with anti-metastatic properties in breast and other tumors (58–60). The idea needs to be strengthened by further in vivo studies in appropriate models of metastatic spread. In the context of breast cancer, one of the main obstacles is represented by the scarcity of suitable retinoid-sensitive human mammary tumor cell lines that can be xenografted in immunodeficient mice and used to study the metastatic process. Nevertheless, it is worthwhile mentioning that preliminary results obtained with subcutaneous xenografts of HCC1599 cells in SCID mice are consistent with the anti-metastatic potential of ATRA. In fact, intraperitoneal administration of ATRA at dosages reducing the primary tumor mass causes a significant down-regulation of the NOTCH1, SNAIL, and SLUG mRNAs.3 These in vivo data are in line with the down-regulation of NOTCH1 and SNAIL observed in SKBR3 cells and the recently reported role of SLUG as a mediator of the EMT and metastatic processes activated by NOTCH1 in xenografts of retinoid-insensitive MDAMB231 cells (61). The anti-metastatic properties of ATRA can be exploited at the clinical level for the design of retinoid-based therapeutic strategies aimed at the treatment or chemoprevention of breast cancer.
Acknowledgments
We thank Gianni Del Sal for providing the active NOTCH1 plasmid construct and Dr. Tohru Kiyono for the kind gift of the NOTCH1 promoter construct. We thank Felice Deceglie for the artwork.
This work was supported by a grant from the Associazione Italiana per la Ricerca sul il Cancro (MFAG 2011 Grant 12100) (to G. P.). This work was also supported by the Fondazione “Italo Monzino.”
G. Paroni, unpublished results.
- ATRA
- all-trans-retinoic acid
- RAR
- retinoic acid receptor
- EMT
- epithelial-to-mesenchymal transition
- NICD
- NOTCH intracellular domain
- Herg
- heregulin-β1
- DAPT
- N-(N-(3,5-difluorophenacetyl)-l-alanyl)-S-phenylglycine t-butyl ester
- SB431542
- 4-(5-benzol(1,3)dioxol-5-yl-4-pyrldin-2-yl-1H-imidazol-2-yl)-benzamide hydrate, 4-(4-(1,3-benzodioxol-5-yl)-5-(2-pyridinyl)-1H-imidazol-2-yl)-benzamide hydrate, 4-(4-(3,4-methylenedioxyphenyl)-5-(2-pyridyl)-1H-imidazol-2-yl)-benzamide hydrate
- qRT-PCR
- quantitative RT-PCR.
References
- 1. Garattini E., Bolis M., Garattini S. K., Fratelli M., Centritto F., Paroni G., Gianni' M., Zanetti A., Pagani A., Fisher J. N., Zambelli A., Terao M. (2014) Retinoids and breast cancer: from basic studies to the clinic and back again. Cancer Treat. Rev. 40, 739–749 [DOI] [PubMed] [Google Scholar]
- 2. Rochette-Egly C., Germain P. (2009) Dynamic and combinatorial control of gene expression by nuclear retinoic acid receptors (RARs). Nucl. Recept. Signal. 7, e005. [DOI] [PMC free article] [PubMed] [Google Scholar]
- 3. Wang Y. A., Shen K., Wang Y., Brooks S. C. (2005) Retinoic acid signaling is required for proper morphogenesis of mammary gland. Dev. Dyn. 234, 892–899 [DOI] [PubMed] [Google Scholar]
- 4. Cho K. W., Kwon H. J., Shin J. O., Lee J. M., Cho S. W., Tickle C., Jung H. S. (2012) Retinoic acid signaling and the initiation of mammary gland development. Dev. Biol. 365, 259–266 [DOI] [PubMed] [Google Scholar]
- 5. Niederreither K., Dollé P. (2008) Retinoic acid in development: towards an integrated view. Nat. Rev. Genet. 9, 541–553 [DOI] [PubMed] [Google Scholar]
- 6. Paroni G., Fratelli M., Gardini G., Bassano C., Flora M., Zanetti A., Guarnaccia V., Ubezio P., Centritto F., Terao M., Garattini E. (2012) Synergistic antitumor activity of lapatinib and retinoids on a novel subtype of breast cancer with coamplification of ERBB2 and RARA. Oncogene 31, 3431–3443 [DOI] [PubMed] [Google Scholar]
- 7. Shah S., Pishvaian M. J., Easwaran V., Brown P. H., Byers S. W. (2002) The role of cadherin, β-catenin, and AP-1 in retinoid-regulated carcinoma cell differentiation and proliferation. J. Biol. Chem. 277, 25313–25322 [DOI] [PubMed] [Google Scholar]
- 8. Nieto M. A. (2013) Epithelial plasticity: a common theme in embryonic and cancer cells. Science 342, 1234850. [DOI] [PubMed] [Google Scholar]
- 9. Thiery J. P., Acloque H., Huang R. Y., Nieto M. A. (2009) Epithelial-mesenchymal transitions in development and disease. Cell 139, 871–890 [DOI] [PubMed] [Google Scholar]
- 10. Trimboli A. J., Fukino K., de Bruin A., Wei G., Shen L., Tanner S. M., Creasap N., Rosol T. J., Robinson M. L., Eng C., Ostrowski M. C., Leone G. (2008) Direct evidence for epithelial-mesenchymal transitions in breast cancer. Cancer Res. 68, 937–945 [DOI] [PubMed] [Google Scholar]
- 11. Micalizzi D. S., Farabaugh S. M., Ford H. L. (2010) Epithelial-mesenchymal transition in cancer: parallels between normal development and tumor progression. J. Mammary Gland Biol. Neoplasia 15, 117–134 [DOI] [PMC free article] [PubMed] [Google Scholar]
- 12. Brabletz T. (2012) To differentiate or not: routes towards metastasis. Nat. Rev. Cancer 12, 425–436 [DOI] [PubMed] [Google Scholar]
- 13. Guruharsha K. G., Kankel M. W., Artavanis-Tsakonas S. (2012) The Notch signalling system: recent insights into the complexity of a conserved pathway. Nat. Rev. Genet. 13, 654–666 [DOI] [PMC free article] [PubMed] [Google Scholar]
- 14. Kopan R., Ilagan M. X. (2009) The canonical Notch signaling pathway: unfolding the activation mechanism. Cell 137, 216–233 [DOI] [PMC free article] [PubMed] [Google Scholar]
- 15. Leong K. G., Niessen K., Kulic I., Raouf A., Eaves C., Pollet I., Karsan A. (2007) Jagged1-mediated Notch activation induces epithelial-to-mesenchymal transition through Slug-induced repression of E-cadherin. J. Exp. Med. 204, 2935–2948 [DOI] [PMC free article] [PubMed] [Google Scholar]
- 16. Sahlgren C., Gustafsson M. V., Jin S., Poellinger L., Lendahl U. (2008) Notch signaling mediates hypoxia-induced tumor cell migration and invasion. Proc. Natl. Acad. Sci. U.S.A. 105, 6392–6397 [DOI] [PMC free article] [PubMed] [Google Scholar]
- 17. Zavadil J., Cermak L., Soto-Nieves N., Böttinger E. P. (2004) Integration of TGF-β/Smad and Jagged1/Notch signalling in epithelial-to-mesenchymal transition. EMBO J. 23, 1155–1165 [DOI] [PMC free article] [PubMed] [Google Scholar]
- 18. Gianni M., Zanotta S., Terao M., Garattini S., Garattini E. (1993) Effects of synthetic retinoids and retinoic acid isomers on the expression of alkaline phosphatase in F9 teratocarcinoma cells. Biochem. Biophys. Res. Commun. 196, 252–259 [DOI] [PubMed] [Google Scholar]
- 19. Voigt W. (2005) Sulforhodamine B assay and chemosensitivity. Methods Mol. Med. 110, 39–48 [DOI] [PubMed] [Google Scholar]
- 20. Corada M., Liao F., Lindgren M., Lampugnani M. G., Breviario F., Frank R., Muller W. A., Hicklin D. J., Bohlen P., Dejana E. (2001) Monoclonal antibodies directed to different regions of vascular endothelial cadherin extracellular domain affect adhesion and clustering of the protein and modulate endothelial permeability. Blood 97, 1679–1684 [DOI] [PubMed] [Google Scholar]
- 21. Paroni G., Henderson C., Schneider C., Brancolini C. (2001) Caspase-2-induced apoptosis is dependent on caspase-9, but its processing during UV- or tumor necrosis factor-dependent cell death requires caspase-3. J. Biol. Chem. 276, 21907–21915 [DOI] [PubMed] [Google Scholar]
- 22. Vogelmann R., Nguyen-Tat M. D., Giehl K., Adler G., Wedlich D., Menke A. (2005) TGFβ-induced downregulation of E-cadherin-based cell-cell adhesion depends on PI3-kinase and PTEN. J. Cell Sci. 118, 4901–4912 [DOI] [PubMed] [Google Scholar]
- 23. Livak K. J., Schmittgen T. D. (2001) Analysis of relative gene expression data using real-time quantitative PCR and the 2(−ΔΔC(T)) method. Methods 25, 402–408 [DOI] [PubMed] [Google Scholar]
- 24. Kao J., Salari K., Bocanegra M., Choi Y. L., Girard L., Gandhi J., Kwei K. A., Hernandez-Boussard T., Wang P., Gazdar A. F., Minna J. D., Pollack J. R. (2009) Molecular profiling of breast cancer cell lines defines relevant tumor models and provides a resource for cancer gene discovery. PLoS One 4, e6146. [DOI] [PMC free article] [PubMed] [Google Scholar]
- 25. Lacroix M., Leclercq G. (2004) Relevance of breast cancer cell lines as models for breast tumours: an update. Breast Cancer Res. Treat. 83, 249–289 [DOI] [PubMed] [Google Scholar]
- 26. Blick T., Widodo E., Hugo H., Waltham M., Lenburg M. E., Neve R. M., Thompson E. W. (2008) Epithelial mesenchymal transition traits in human breast cancer cell lines. Clin. Exp. Metastasis 25, 629–642 [DOI] [PubMed] [Google Scholar]
- 27. Hardy K. M., Booth B. W., Hendrix M. J., Salomon D. S., Strizzi L. (2010) ErbB/EGF signaling and EMT in mammary development and breast cancer. J. Mammary Gland Biol. Neoplasia 15, 191–199 [DOI] [PMC free article] [PubMed] [Google Scholar]
- 28. Hugo H. J., Wafai R., Blick T., Thompson E. W., Newgreen D. F. (2009) Staurosporine augments EGF-mediated EMT in PMC42-LA cells through actin depolymerisation, focal contact size reduction and Snail1 induction: a model for cross-modulation. BMC Cancer 9, 235. [DOI] [PMC free article] [PubMed] [Google Scholar]
- 29. Cheng L., Zha Z., Lang B., Liu J., Yao X. (2009) Heregulin-β1 promotes metastasis of breast cancer cell line SKBR3 through upregulation of Snail and induction of epithelial-mesenchymal transition. Cancer Lett. 280, 50–60 [DOI] [PubMed] [Google Scholar]
- 30. Voura E. B., Sandig M., Siu C. H. (1998) Cell-cell interactions during transendothelial migration of tumor cells. Microsc. Res. Tech. 43, 265–275 [DOI] [PubMed] [Google Scholar]
- 31. Wallez Y., Huber P. (2008) Endothelial adherens and tight junctions in vascular homeostasis, inflammation and angiogenesis. Biochim. Biophys. Acta 1778, 794–809 [DOI] [PubMed] [Google Scholar]
- 32. Hollestelle A., Peeters J. K., Smid M., Timmermans M., Verhoog L. C., Westenend P. J., Heine A. A., Chan A., Sieuwerts A. M., Wiemer E. A., Klijn J. G., van der Spek P. J., Foekens J. A., Schutte M., den Bakker M. A., Martens J. W. (2013) Loss of E-cadherin is not a necessity for epithelial to mesenchymal transition in human breast cancer. Breast Cancer Res. Treat. 138, 47–57 [DOI] [PubMed] [Google Scholar]
- 33. Debnath J., Brugge J. S. (2005) Modelling glandular epithelial cancers in three-dimensional cultures. Nat. Rev. Cancer 5, 675–688 [DOI] [PubMed] [Google Scholar]
- 34. Kenny P. A., Lee G. Y., Myers C. A., Neve R. M., Semeiks J. R., Spellman P. T., Lorenz K., Lee E. H., Barcellos-Hoff M. H., Petersen O. W., Gray J. W., Bissell M. J. (2007) The morphologies of breast cancer cell lines in three-dimensional assays correlate with their profiles of gene expression. Mol. Oncol. 1, 84–96 [DOI] [PMC free article] [PubMed] [Google Scholar]
- 35. Ocaña O. H., Córcoles R., Fabra A., Moreno-Bueno G., Acloque H., Vega S., Barrallo-Gimeno A., Cano A., Nieto M. A. (2012) Metastatic colonization requires the repression of the epithelial-mesenchymal transition inducer Prrx1. Cancer Cell 22, 709–724 [DOI] [PubMed] [Google Scholar]
- 36. Lo H. W., Hsu S. C., Xia W., Cao X., Shih J. Y., Wei Y., Abbruzzese J. L., Hortobagyi G. N., Hung M. C. (2007) Epidermal growth factor receptor cooperates with signal transducer and activator of transcription 3 to induce epithelial-mesenchymal transition in cancer cells via up-regulation of TWIST gene expression. Cancer Res. 67, 9066–9076 [DOI] [PMC free article] [PubMed] [Google Scholar]
- 37. Friedl P., Locker J., Sahai E., Segall J. E. (2012) Classifying collective cancer cell invasion. Nat. Cell Biol. 14, 777–783 [DOI] [PubMed] [Google Scholar]
- 38. Nam D. H., Jeon H. M., Kim S., Kim M. H., Lee Y. J., Lee M. S., Kim H., Joo K. M., Lee D. S., Price J. E., Bang S. I., Park W. Y. (2008) Activation of notch signaling in a xenograft model of brain metastasis. Clin. Cancer Res. 14, 4059–4066 [DOI] [PubMed] [Google Scholar]
- 39. Parr C., Watkins G., Jiang W. G. (2004) The possible correlation of Notch-1 and Notch-2 with clinical outcome and tumour clinicopathological parameters in human breast cancer. Int. J. Mol. Med. 14, 779–786 [DOI] [PubMed] [Google Scholar]
- 40. Suman S., Das T. P., Damodaran C. (2013) Silencing NOTCH signaling causes growth arrest in both breast cancer stem cells and breast cancer cells. Br. J. Cancer 109, 2587–2596 [DOI] [PMC free article] [PubMed] [Google Scholar]
- 41. Yugawa T., Handa K., Narisawa-Saito M., Ohno S., Fujita M., Kiyono T. (2007) Regulation of Notch1 gene expression by p53 in epithelial cells. Mol. Cell Biol. 27, 3732–3742 [DOI] [PMC free article] [PubMed] [Google Scholar]
- 42. Rustighi A., Tiberi L., Soldano A., Napoli M., Nuciforo P., Rosato A., Kaplan F., Capobianco A., Pece S., Di Fiore P. P., Del Sal G. (2009) The prolyl-isomerase Pin1 is a Notch1 target that enhances Notch1 activation in cancer. Nat. Cell Biol. 11, 133–142 [DOI] [PubMed] [Google Scholar]
- 43. Schroeter E. H., Kisslinger J. A., Kopan R. (1998) Notch-1 signalling requires ligand-induced proteolytic release of intracellular domain. Nature 393, 382–386 [DOI] [PubMed] [Google Scholar]
- 44. Micchelli C. A., Esler W. P., Kimberly W. T., Jack C., Berezovska O., Kornilova A., Hyman B. T., Perrimon N., Wolfe M. S. (2003) γ-Secretase/presenilin inhibitors for Alzheimer's disease phenocopy Notch mutations in Drosophila. FASEB J. 17, 79–81 [DOI] [PubMed] [Google Scholar]
- 45. Bolós V., Mira E., Martínez-Poveda B., Luxán G., Cañamero M., Martínez-A C., Mañes S., de la Pompa J. L. (2013) Notch activation stimulates migration of breast cancer cells and promotes tumor growth. Breast Cancer Res. 15, R54. [DOI] [PMC free article] [PubMed] [Google Scholar]
- 46. Wang S. E., Xiang B., Guix M., Olivares M. G., Parker J., Chung C. H., Pandiella A., Arteaga C. L. (2008) Transforming growth factor β engages TACE and ErbB3 to activate phosphatidylinositol-3 kinase/Akt in ErbB2-overexpressing breast cancer and desensitizes cells to trastuzumab. Mol. Cell Biol. 28, 5605–5620 [DOI] [PMC free article] [PubMed] [Google Scholar]
- 47. Kretzschmar M., Doody J., Timokhina I., Massagué J. (1999) A mechanism of repression of TGFβ/Smad signaling by oncogenic Ras. Genes Dev. 13, 804–816 [DOI] [PMC free article] [PubMed] [Google Scholar]
- 48. Sekimoto G., Matsuzaki K., Yoshida K., Mori S., Murata M., Seki T., Matsui H., Fujisawa J., Okazaki K. (2007) Reversible Smad-dependent signaling between tumor suppression and oncogenesis. Cancer Res. 67, 5090–5096 [DOI] [PubMed] [Google Scholar]
- 49. Robinson D. R., Kalyana-Sundaram S., Wu Y. M., Shankar S., Cao X., Ateeq B., Asangani I. A., Iyer M., Maher C. A., Grasso C. S., Lonigro R. J., Quist M., Siddiqui J., Mehra R., Jing X., Giordano T. J., Sabel M. S., Kleer C. G., Palanisamy N., Natrajan R., Lambros M. B., Reis-Filho J. S., Kumar-Sinha C., Chinnaiyan A. M. (2011) Functionally recurrent rearrangements of the MAST kinase and Notch gene families in breast cancer. Nat. Med. 17, 1646–1651 [DOI] [PMC free article] [PubMed] [Google Scholar]
- 50. Lo-Coco F., Ammatuna E., Montesinos P., Sanz M. A. (2008) Acute promyelocytic leukemia: recent advances in diagnosis and management. Semin. Oncol. 35, 401–409 [DOI] [PubMed] [Google Scholar]
- 51. Wolbach S. B., Howe P. R. (1925) Tissue changes following deprivation of fat-soluble A vitamin. J. Exp. Med. 42, 753–777 [DOI] [PMC free article] [PubMed] [Google Scholar]
- 52. Wolbach S. B., Howe P. R. (1933) Epithelial repair in recovery from vitamin A deficiency: an experimental study. J. Exp. Med. 57, 511–526 [DOI] [PMC free article] [PubMed] [Google Scholar]
- 53. Friedl P., Alexander S. (2011) Cancer invasion and the microenvironment: plasticity and reciprocity. Cell 147, 992–1009 [DOI] [PubMed] [Google Scholar]
- 54. Doi A., Ishikawa K., Shibata N., Ito E., Fujimoto J., Yamamoto M., Shiga H., Mochizuki H., Kawamura Y., Goshima N., Semba K., Watanabe S. (2015) Enhanced expression of retinoic acid receptor α (RARA) induces epithelial-to-mesenchymal transition and disruption of mammary acinar structures. Mol. Oncol. 9, 355–364 [DOI] [PMC free article] [PubMed] [Google Scholar]
- 55. Heldin C. H., Vanlandewijck M., Moustakas A. (2012) Regulation of EMT by TGFβ in cancer. FEBS Lett. 586, 1959–1970 [DOI] [PubMed] [Google Scholar]
- 56. Zhang C. C., Pavlicek A., Zhang Q., Lira M. E., Painter C. L., Yan Z., Zheng X., Lee N. V., Ozeck M., Qiu M., Zong Q., Lappin P. B., Wong A., Rejto P. A., Smeal T., Christensen J. G. (2012) Biomarker and pharmacologic evaluation of the γ-secretase inhibitor PF-03084014 in breast cancer models. Clin. Cancer Res. 18, 5008–5019 [DOI] [PubMed] [Google Scholar]
- 57. Centritto F., Paroni G., Bolis M., Garattini S. K., Kurosaki M., Barzago M. M., Zanetti A., Fisher J. N., Scott M. F., Pattini L., Lupi M., Ubezio P., Piccotti F., Zambelli A., Rizzo P., Gianni M., Fratelli M., Terao M., Garattini E. (2015) Cellular and molecular determinants of all-trans retinoic acid sensitivity in breast cancer: Luminal phenotype and RARα expression. EMBO Mol. Med. 10.15252/emmm.201404670 [DOI] [PMC free article] [PubMed] [Google Scholar]
- 58. Liu H., Zang C., Fenner M. H., Possinger K., Elstner E. (2003) PPARgamma ligands and ATRA inhibit the invasion of human breast cancer cells in vitro. Breast Cancer Res. Treat. 79, 63–74 [DOI] [PubMed] [Google Scholar]
- 59. Wu Q., Chen Y. Q., Chen Z. M., Chen F., Su W. J. (2002) Effects of retinoic acid on metastasis and its related proteins in gastric cancer cells in vivo and in vitro. Acta Pharmacol. Sin. 23, 835–841 [PubMed] [Google Scholar]
- 60. Barroga E. F., Kadosawa T., Okumura M., Fujinaga T. (2000) Inhibitory effects of 22-oxa-calcitriol and all-trans retinoic acid on the growth of a canine osteosarcoma derived cell-line in vivo and its pulmonary metastasis in vivo. Res. Vet. Sci. 68, 79–87 [DOI] [PubMed] [Google Scholar]
- 61. Shao S., Zhao X., Zhang X., Luo M., Zuo X., Huang S., Wang Y., Gu S., Zhao X. (2015) Notch1 signaling regulates the epithelial-mesenchymal transition and invasion of breast cancer in a Slug-dependent manner. Mol. Cancer 14, 28. [DOI] [PMC free article] [PubMed] [Google Scholar]