

Background: Tight regulation of ion channel activity is essential for neuronal function.
Results: The scaffold protein Kidins220 associates with brain voltage-gated sodium channels and modulates their activity.
Conclusion: Lack of Kidins220 in mice causes deregulated sodium channel function in inhibitory neurons, ultimately leading to impaired network excitability.
Significance: Kidins220 may help maintain the balance between excitation and inhibition in neural networks.
Keywords: gating, hippocampus, neuron, patch clamp, scaffold protein, sodium channel
Abstract
Kidins220 (kinase D-interacting substrate of 220 kDa)/ankyrin repeat-rich membrane spanning (ARMS) acts as a signaling platform at the plasma membrane and is implicated in a multitude of neuronal functions, including the control of neuronal activity. Here, we used the Kidins220−/− mouse model to study the effects of Kidins220 ablation on neuronal excitability. Multielectrode array recordings showed reduced evoked spiking activity in Kidins220−/− hippocampal networks, which was compatible with the increased excitability of GABAergic neurons determined by current-clamp recordings. Spike waveform analysis further indicated an increased sodium conductance in this neuronal subpopulation. Kidins220 association with brain voltage-gated sodium channels was shown by co-immunoprecipitation experiments and Na+ current recordings in transfected HEK293 cells, which revealed dramatic alterations of kinetics and voltage dependence. Finally, an in silico interneuronal model incorporating the Kidins220-induced Na+ current alterations reproduced the firing phenotype observed in Kidins220−/− neurons. These results identify Kidins220 as a novel modulator of Nav channel activity, broadening our understanding of the molecular mechanisms regulating network excitability.
Introduction
The scaffold protein Kidins2203/ARMS (1, 2), hereafter referred to as Kidins220, acts as a signaling platform implicated in many cellular functions through a plethora of interactions with membrane receptors, cytosolic signaling components, and cytoskeletal proteins (3). In the nervous system, where the protein is preferentially expressed, Kidins220 covers such diverse functions as the control of neuronal survival pathways, neurite outgrowth and maturation, and finally neuronal activity. Cumulative evidence from several studies supported the idea that neuronal activity in the hippocampus is reciprocally connected to Kidins220 protein levels, which appear to affect excitatory and inhibitory circuits in opposite ways (4–7). This connection holds true also in the reverse direction, as sustained neuronal activity reduces the amount of Kidins220 protein via transcriptional down-regulation and calpain-dependent protein cleavage (6, 8). The molecular mechanisms by which Kidins220 affects neuronal activity are only partially understood. In some instances, similarly to other multidomain scaffold proteins, such as PSD-95 (9) or zonula occludens (10), an association of Kidins220 with membrane channels appears to be involved, as demonstrated by immunoprecipitation assays for AMPA and NMDA receptors (5, 8). In the case of AMPA receptors, Kidins220 expression negatively regulated the basal synaptic strength of glutamatergic hippocampal synapses by affecting the phosphorylation state and cell surface expression of the GluA1 subunit (5). In other instances, the effects on neuronal activity are most likely related to the close association of Kidins220 with neurotrophin receptors. In fact, Kidins220 has been shown to interact with the three members of the Trk family and with the p75 neurotrophin receptor (11, 12). Moreover, Kidins220 is tyrosine phosphorylated by Trk receptors upon activation by extracellular neurotrophins (2). Neurotrophins, and in particular brain-derived neurotrophic factor (BDNF), are known to participate in synaptic plasticity (13), and in some cases an involvement of Kidins220 in the synaptic effects of neurotrophins has been demonstrated. Kidins220 knock-down in hippocampal neurons interfered with the BDNF-evoked enhancement of inhibitory neurotransmission (7). Long-term potentiation in mouse hippocampal slices, for which a direct implication of the BDNF-TrkB system has been shown (14), was enhanced in Kidins220+/− mice having reduced protein levels (6). Finally, the potentiation of excitatory post-synaptic currents in hippocampal neurons induced by acute BDNF application (15) was impaired in Kidins220−/− mice (16).
The proper functioning of brain circuits relies on the ability of the neural networks to maintain the correct balance between excitatory and inhibitory activity. Neuronal excitability is determined by a complex network of biological processes, which result from the interplay of extracellular signals, membrane receptors and channels, and intracellular signaling cascades. Being responsible for AP onset at the axonal initial segment, Nav channels are fundamental players in all kinds of neuronal communication. They are multimeric complexes of α and β subunits that exist in several isoforms, creating a large repertoire of channels with different biophysical properties (17). The specific channel localization is determined by the interaction of α and β subunits with a set of adhesion molecules, as well as cytoskeletal and extracellular matrix proteins (17, 18). Nav channel activity is modulated by the coordinated activation of several signaling pathways, being targets of phosphorylation by protein kinase A (19) and by Fyn kinase acting downstream of the BDNF-TrkB complex (20). Despite the vast amount of data available in the literature, however, the network of signaling events controlling Nav channel localization and activity is still far from being completely understood. Here, we examined the effects of Kidins220 ablation on the excitability of cultured hippocampal neurons. Our results revealed increased excitability of GABAergic neurons in Kidins220 null mice and provided evidence for a functional association of Kidins220 with Nav channels in the brain.
Experimental Procedures
Reagents
All chemicals, biochemical reagents, and drugs were from Sigma Aldrich (Milan, Italy), unless otherwise specified. Tissue culture reagents and media were from Life Technologies (Milan, Italy) or Sigma.
Generation of Kidins220−/− Mice and Primary Hippocampal Cultures
The generation of the Kidins220−/− strain was described in a previous study (16). All embryos used in this study were obtained from crosses of Kidins220+/− mice in the C57BL/6 background. Mice were mated overnight and separated in the morning. The development of the embryos was timed from the detection of a vaginal plug, which was considered day 0.5. Hippocampi were dissected from wild-type and Kidins220−/− E18.5 embryo littermates obtained from crossing Kidins220+/− mice. Briefly, hippocampi were dissected in ice-cold PBS, incubated with trypsin (0.125%) for 15 min at 37 °C, and mechanically dissociated. Autaptic cultures were prepared as previously described (21, 22). Briefly, dissociated neurons were plated at very low density (20 cells mm−2) on microdots (40–300 mm diameter) obtained by spraying poly-d-lysine (0.14 mg ml−1) on dishes pre-treated with 0.15% agarose. Neurons were plated in Neurobasal medium containing 10% horse serum, 2 mm glutamine and antibiotics (plating medium). After 3 h, the medium was removed and replaced with Neurobasal containing 2% B27 supplement, 2 mm glutamine and antibiotics (maintenance medium). All experiments were carried out in accordance with the guidelines established by the European Communities Council (Directive 2010/63/EU of September 22, 2010) and were approved by the Italian Ministry of Health.
Cell Culture and Transient Transfection
HEK293 and COS cells were cultured in DMEM supplemented with 10% fetal bovine serum, glutamine (2 mm), and antibiotics, in a humidified 5% CO2 atmosphere at 37 °C. Plasmids coding for HA-Kidins220 (kind gift of Dr. G. Schiavo, UCL, London, UK) and Nav1.2 (kind gift of Dr. W. A. Catterall, University of Washington, Seattle, WA) were transiently co-transfected into cultured cells using Lipofectamine 2000 (Invitrogen), following standard protocols.
Immunoprecipitation and Immunoblot Analysis
Cultured cells were washed once in ice-cold PBS and lysed in RIPA buffer (50 mm Tris-HCl, pH 7.4, 150 mm NaCl, 2 mm EDTA, 1% Nonidet P-40, 0.1% SDS) plus protease inhibitors (complete EDTA-free protease inhibitors, Roche Diagnostics GmbH, Mannheim, Germany) for 1 h at 4 °C under constant agitation. Mouse brain tissue was extracted in the same buffer using a Teflon Dounce homogenizer (Wheaton, Millville, NJ) and incubated as before. After centrifugation at 16,000 × g for 15 min at 4 °C, the protein concentration was quantified by using a Bradford Protein Assay (Bio-Rad). Following protein extraction, protein lysates were precleared using 25 μl of Protein A or G-Sepharose Fast Flow (GE Healthcare) for 2 h at 4 °C. Precleared lysates were incubated 4 h with 1 μg of the appropriate antibody at 4 °C, then immunocomplexes were isolated by adding Protein A or G-Sepharose overnight at 4 °C. SDS-PAGE and Western blotting were performed by using BOLT 4–12% BisTris Plus precast gels (Invitrogen). Nitrocellulose membranes were incubated with the appropriate primary antibodies, successively with fluorescently conjugated secondary antibodies and revealed by a Typhoon TRIO+ Variable Mode Imager (GE Healthcare). The following antibodies were used: polyclonal anti-Kidins220 (number ab34790, Abcam, Cambridge, UK), monoclonal anti-HA high affinity (11867423001, Roche Diagnostics GmbH), monoclonal anti-sodium channel (pan) (number S8809, Sigma Aldrich), polyclonal anti-Nav1.2 (number ASC-002, Alomone Labs Ltd., Jerusalem, Israel), polyclonal anti-GFP (number A11122, Invitrogen), and monoclonal anti-GFP (number ab1218, Abcam).
When used on transfected HEK293 or COS cells, in our hands, the pan-Nav antibody did not recognize Nav1.2 in Western blots, whereas it recognized Nav1.2 very well in immunocytochemical assays (Fig. 3, C and D). This could possibly be due to an alteration of the pan-Nav specific epitope in the HEK-expressed Nav1.2 subunit upon SDS-PAGE processing.
FIGURE 3.
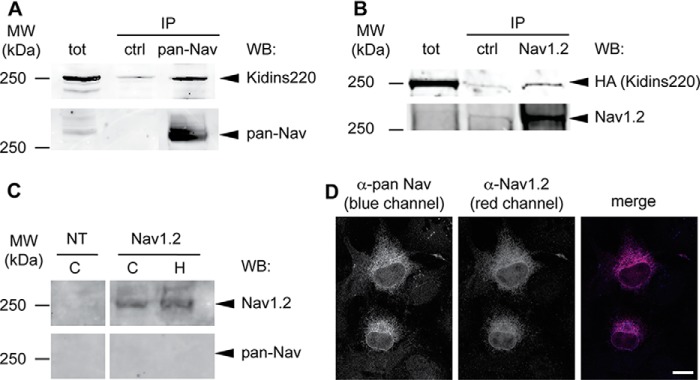
Interaction between Kidins220 and Nav channels. A, endogenous Kidins220 and Nav channels associate in the adult mouse brain. Brain cortices were dissected from adult wild-type (C57BL6/J) mice, lysed, and immunoprecipitated by using anti-pan-Nav antibodies, or anti-GFP antibodies as control (ctrl). Samples were analyzed by SDS-PAGE and immunoblotting with anti-Kidins220 and anti-pan-Nav antibodies, as indicated. B, exogenously expressed Kidins220 and Nav channels associate in HEK293 cells. HEK293 cells were co-transfected with plasmids coding for HA-Kidins220 and Nav1.2, lysed, and immunoprecipitated with anti-Nav1.2 antibodies, or anti-GFP antibodies as control (ctrl). Samples were analyzed by SDS-PAGE and immunoblotting with anti-HA and anti-Nav1.2 antibodies, as indicated. tot, 50 μg of total cortex or cell lysate. C, COS cells (C) and HEK293 cells (H) were transiently transfected with Nav1.2, lysed, and processed by SDS-PAGE. Nitrocellulose membranes were probed with anti-Nav1.2 and anti-pan-Nav antibodies, as indicated. Lysate from non-transfected cells (NT, 50 μg) was run as a control. D, HEK293 cells were transiently transfected with Nav1.2, fixed after 48 h, and processed for immunocytochemistry with the indicated antibodies. Scale bar, 10 μm. WB, Western blot.
Immunocytochemistry
Cells were fixed with 4% PFA, 20% sucrose in PBS for 15 min at room temperature and permeabilized with 0.1% Triton X-100 in PBS for 5 min at room temperature. Samples were blocked for 30 min in IF buffer (2% BSA, 10% goat serum in PBS). Primary and secondary antibodies were diluted in IF buffer and incubated for 45 min at room temperature. Primary antibodies were as described above. Fluorescently conjugated secondary antibodies for immunofluorescence were from Molecular Probes (Invitrogen). Images were acquired at an inverted Leica TCS SP5 AOBS TANDEM confocal microscope equipped with a ×40/1.25–0.75 HCX PL APO oil objective. Images were visualized and processed using Leica LAS AF, ImageJ, and Adobe Photoshop CS3 software.
Multielectrode Array Recordings
Hippocampal neurons prepared from Kidins220−/− and wild-type littermates were plated on 12-well planar multielectrode array devices (Axion Biosystems, Atlanta, GA) at a density of 85,000 neurons per well. Each well of the device contains 64 individual embedded microelectrodes. After 21 days in vitro, recordings were performed at 36.5 °C in Tyrode solution (in mm: 140 NaCl, 4 KCl, 2 CaCl2, 1 MgCl2, 10 glucose, 10 HEPES, pH 7.3) supplemented with 50 μm d-(−)-2-amino-5-phosphonopentanoic acid and 5 μm CGP 55845. For pulse stimulation of the neuronal network, the electrode was chosen among 64 possible stimulation sites based on visual inspection of the evoked responses to ensure maximal activation of the network, generally close to the center of the culture (within a 425-μm range). Pulse stimulation was biphasic with a 1.5-V peak-to-peak amplitude, 500-μs duration, and 50% duty cycle. Spike detection was performed with Axion Biosystems software (Axion Integrated Studio, version 1.6.3.3349) by individually setting a voltage threshold for each channel equal to 6–7 times the standard deviation of the noise present in 200-Hz high pass-filtered traces. Evoked spiking activity was averaged over 50 consecutive stimulations applied at a frequency of 0.1 Hz. Data analysis was done using custom-made MatLab 2010a scripts (The MathWorks Inc., Natick, MA), except for mean firing rates that were calculated using SPYCODE software (23).
Patch Clamp Recordings
Recordings were performed in the whole cell configuration using EPC-10 (HEKA Elektronik, Lambrecht, Germany) or Axopatch 200A (Molecular Devices, Sunnyvale, CA) patch clamp amplifiers. All experiments were performed at room temperature (21–23 °C).
Patch clamp experiments on hippocampal autaptic neurons were conducted between 10 and 14 days in vitro. Data of membrane voltage were low-pass filtered at 3 kHz and acquired at 10 kHz sample frequency. Patch pipettes fabricated from borosilicate glass capillaries had final resistances of 4.5–5.5 MΩ when filled with the pipette solution containing (in mm): 126 K-gluconate, 4 NaCl, 1 MgSO4, 0.02 CaCl2, 0.1 BAPTA (1,2-bis(2-aminophenoxy)ethane-N,N,N′,N′-tetraacetic acid)), 3 Na2ATP, 0.1 NaGTP, 15 glucose, 5 HEPES, pH 7.30, adjusted with KOH. The bath solution contained (in mm) 140 NaCl, 4 KCl, 2 CaCl2, 1 MgCl2, 10 glucose, 10 HEPES, pH 7.30, adjusted with NaOH. d-(−)-2-Amino-5-phosphonopentanoic acid (50 μm) and CGP 55845 (5 μm) were routinely added to block NMDA receptors and GABAB receptors, respectively. After the establishment of the whole cell configuration, post-synaptic autaptic currents were evoked by brief depolarization in the voltage-clamp mode. The distinction between excitatory (AMPA receptor-mediated) post-synaptic currents and inhibitory (GABAA receptor-mediated) post-synaptic currents was based on their decay kinetics, reversal potentials, and sensitivity toward specific antagonists of post-synaptic receptors, 6-cyano-7-nitroquinoxaline-2,3-dione (10 μm; Sigma) for AMPA receptors and (−)-bicuculline methiodide (30 μm) for GABAA receptors. Toxins were purchased from Tocris (Bristol, UK), unless otherwise indicated, and were supplemented as concentrated stock solutions. Autaptic neurons were locally superfused at a constant rate of 150 μl min−1, using a perfusion pipette with five inlets and a single outlet. Following identification of the neuronal cell type, the autaptic neuron under investigation was held at a membrane potential of −70 mV in the current-clamp mode and subjected to current injection of 1-s duration and stepwise increasing amplitude. Input resistance was determined using the Ohm law in the linear region of the voltage-current relationship determined in response to injection of hyperpolarizing current (0 to −100 pA amplitude). Instantaneous firing frequency was calculated from the time interval between the first and the second action potential elicited at a given current step. Phase-plane plots, i.e. plots of the time derivative of voltage (dV/dt) versus voltage, were constructed from the first action potential evoked by current injection (20-pA steps) and used to extract threshold potential, maximum rising slope, and peak potential. The threshold potential was defined as the membrane potential at which dV/dt exceeded 10 V−1. Spike width was measured at 50% of the spike amplitude, defined as the difference between peak potential and threshold potential.
Na+ currents were recorded using the whole cell configuration in HEK293 cells transfected as described above, either with Nav1.2 + EGFP or Nav1.2 + EGFP + Kidins220. Transfected cells were dissociated and re-plated at low density about 20 h post-transfection. Recordings were performed 40–74 h post-transfection, transfected cells were identified by EGFP fluorescence. Patch pipettes fabricated from borosilicate glass capillaries had final resistances of 1.5–2.2 MΩ when filled with the pipette solution containing (in mm): 10 NaF, 110 CsF, 20 CsCl, 2 EGTA, 10 HEPES, pH 7.3 (with CsOH). The extracellular bath solution contained (in mm): 145 NaCl, 4 KCl, 15 tetraethylammonium-Cl, 1.8 mm CaCl2, 1 mm MgCl2, 10 HEPES, pH 7.3 (with NaOH). Membrane currents were low-pass filtered at 5–10 kHz and acquired at 50 kHz sample frequency. Series resistance was compensated electronically by 80–95%. After the establishment of the whole cell configuration, sodium currents and access resistance were monitored for at least 15 min, during which cells were allowed to equilibrate with the pipette solution. Subsequently, the different voltage-clamp protocols were applied in a similar order.
The voltage dependence of channel activation was determined from peak currents recorded during 20-ms test pulses to potentials ranging from −60 to +70 mV in 5-mV increments. Conductance values were calculated from peak current (I) amplitudes according to G = I/(V − Vrev), where V is the test potential and Vrev is the measured reversal potential. The voltage dependence of channel inactivation was determined by applying 150-ms pre-pulses to potentials ranging from −130 to +5 mV in 5-mV increments, followed by a test pulse to −10 mV. Normalized activation and inactivation curves were fitted with the Boltzmann equations 1/[1 + exp (V − V1/2)/k] and 1/[1 + exp (V1/2 − V)/k], respectively, where V1/2 is the half-activation voltage and k is a slope factor. To determine the time course of recovery from inactivation, Na+ channels were inactivated with a 10-ms pulse to −10 mV, followed by a recovery pulse of variable duration to −100, −120, or −140 mV, and a test pulse to −10 mV to determine the fraction of recovered channels. Normalized recovery data were fitted with a single exponential to determine the time constant of recovery from inactivation.
Data analysis was done using PatchMaster (HEKA Elektronik, Lambrecht, Germany) and IgorPro software (Wavemetrics, Lake Oswego, OR). Linear leak current and capacitive artifacts were digitally subtracted before analysis using a P/4 protocol.
Computational Modeling of Neuronal Excitability
Simulations were performed with a model of CA1/CA3 hippocampal interneurons (24). The code of the model is deposited at Senselab.med.yale.edu. This model represents a realistic reconstruction of the geometry of an interneuron and is endowed with a set of conductances able to replicate cells with a regular firing pattern (cell model olm-t2.hoc). We constrained the model to have the same passive properties of the recorded cells. Without any modifications, the input resistance of the simulated cells (249 ± 26 MΩ) was already comparable with that of the experiments. Then, to obtain the same resting potential of our experiments, it sufficed to set the reversal potential of the leak current (parameter “epas”) to −45 mV. Shifts of the activation curve were introduced by setting the parameter “tha_nax” to −20 for WT and −30 for Kidins220−/−. Shifts of the inactivation curve were introduced by setting the parameter “thinf_nax” to −40 for WT and −50 for Kidins220−/−. Given that the time constant (hTau) is defined as hTau = 1/(α + β)/q10-inact_nax, where α and β are the voltage-dependent opening and closing rates, modifications of the inactivation time constants were introduced by setting the parameter “q10-inact_nax” (temperature coefficient of the inactivation time constant) to 1 for WT (default value) and 2 for Kidins220−/−.
Statistical Analyses
Data are represented as mean ± S.E. (for the number n of cells) throughout text and figures. Statistical comparisons were made using unpaired Student's t test; p values <0.05 were considered significant, with *, 0.01 < p < 0.05; **, 0.001 < p < 0.01; and ***, p < 0.001.
Results
Reduced Spiking Activity in Kidins220−/− Hippocampal Networks
We compared the network activity of wild-type and Kidins220−/− primary neuronal cultures using the MEA technique. Embryonic hippocampal neurons were plated at high density on MEA supports and assayed after 21 days in vitro. Recordings of spontaneous spiking activity did not reveal significant differences between Kidins220−/− and wild-type cultures (Fig. 1, A and B). However, when the networks were challenged with low-frequency pulse stimulation (Fig. 1C), Kidins220−/− cultures displayed significantly lower spiking rates within a 150-ms period after pulse delivery compared with those derived from wild-type littermates (472 ± 37 spikes for WT (n = 8) versus 365 ± 24 for Kidins220−/− (n = 16); Student's t test p < 0.05). The number of active MEA channels was on average 62.4 ± 1.6 for WT and 62.5 ± 0.5 for Kidins220−/− cultures (Student's t test p = 0.86), indicating for both genotypes the near-complete coverage of the MEA support, consisting of 64 microelectrodes, by cultured neurons. Temporal analysis of evoked spiking in post-stimulus time histograms (Fig. 1D) revealed two phases of increased activity in WT cultures, an early phase lasting 20 ms immediately after stimulus delivery and a delayed phase of lower amplitude in the time window between 50 and 80 ms. Evoked spiking activity of Kidins220−/− cultures was similar in the early phase, but was virtually absent in the delayed phase. These results indicate an impairment in the polysynaptic and reverberant propagation of excitation within Kidins220−/− networks.
FIGURE 1.

Reduced evoked spiking activity in Kidins220−/− hippocampal networks. A, Raster plots of spontaneous spiking activity recorded from wild-type (WT) and Kidins220−/− hippocampal cultures at 21 days in vitro, shown for individual microelectrodes of the MEA device (vertical axis) and a 75-s time window (horizontal axis). B, mean firing rate of WT (n = 8) and Kidins220−/− (n = 16) cultures averaged over a 5-min recording period. C, Raster plots of evoked spiking activity recorded from WT and Kidins220−/− hippocampal cultures, shown for a 150-ms time window after stimulus delivery (horizontal axis). D, post-stimulus time histogram of evoked spiking activity averaged over 50 consecutive stimulations delivered at 0.1 Hz. Bin size was 5 ms. Number of cultures as in B.
Altered Firing Properties in Kidins220−/− Hippocampal Neurons
The changes in the network firing activity evoked by electrical stimulation can stem from alterations of intrinsic excitability and/or synaptic transmission in excitatory and inhibitory neurons. No major changes were observed in the basal synaptic transmission in Kidins220−/− neurons, except for a faster recovery from depression in inhibitory synapses (22). To further elucidate the basis for the reduced spiking activity of Kidins220−/− hippocampal networks, we investigated the firing properties of glutamatergic and GABAergic neurons separately. To this end, we used the autaptic culture technique that allows for straightforward identification of the neuronal cell type through post-synaptic current recordings (22). Specifically, our method of distinction between inhibitory (GABAergic) and excitatory (glutamatergic) neurons was based on the kinetics and reversal potential of post-synaptic currents as well as on their sensitivity toward specific receptor antagonists. Following identification of the neuronal cell type, the autaptic neuron under investigation was held at a membrane potential of −70 mV in the current-clamp mode and subjected to current injection of 1-s duration and stepwise increasing amplitude. In the subpopulation of GABAergic neurons, cells derived from Kidins220−/− mice required significantly less injected current to elicit AP firing compared with control neurons from wild-type littermates (Fig. 2, A1 and B1). This was not due to differences in cell size or passive membrane properties, because no changes of membrane capacitance, resting membrane potential, and input resistance were observed (Table 1). In addition, the firing frequency of these cells was strongly increased (Fig. 2, A1 and C1), which was possibly a consequence of the reduced rheobase, as the input-output relationship displayed a leftwards shift in the absence of changes in slope (“gain”, Fig. 2C1). To investigate the basis for the reduced rheobase and increased excitability of Kidins220−/− GABAergic neurons, we analyzed the shape of the first AP elicited by current injection (Fig. 2D1). First, the spike width at half-maximal amplitude was significantly smaller in Kidins220−/− neurons than in control cells (Fig. 2E1). Moreover, plots of the time derivative of voltage versus membrane voltage (Fig. 2F1) revealed that, whereas the threshold potential was unchanged (Table 1), both the maximal rising slope and the peak amplitude of the first spike were strongly increased in Kidins220−/− cells (Fig. 2G1). Both parameters are intimately linked to the size of the neuronal Na+ conductance, because upstroke and peak of the AP are predominantly due to the explosive activation of inward currents mediated by Nav channels (25).
FIGURE 2.

Kidins220 ablation alters the firing properties of hippocampal neurons. A, typical current-clamp recordings of action potential firing evoked by somatic current injection in autaptic hippocampal neurons from wild-type (WT; black traces) and Kidins220−/− mouse embryos (colored traces). Holding potential was −70 mV. Recordings were made in the subpopulations of inhibitory neurons (A1, Kidins220−/− in blue) and excitatory neurons (A2, Kidins220−/− in green). Scale bars: 200 ms/40 mV. B, mean threshold current amplitudes in inhibitory neurons (B1; n = 24 for WT; n = 23 for Kidins220−/−) and excitatory neurons (B2; n = 24 for WT; n = 21 for Kidins220−/−). C, plot of the mean instantaneous firing frequency (i-F) versus injected current amplitude in inhibitory neurons (C1) and excitatory neurons (C2). D, representative shapes of the first action potential evoked by current injection (20-pA steps) in an inhibitory (D1) and an excitatory neuron (D2). Scale bars, 10 ms/20 mV. E, mean action potential width at half-maximal amplitude in inhibitory (E1) and excitatory neurons (E2). F, phase-plane plots of the first action potential evoked by current injection (20-pA steps) in an inhibitory (F1) and an excitatory neuron (F2). G, summary plot of the mean maximum rising slope (dV/dt) and mean peak potential (Vpeak), derived from phase-plane plots as shown in F, for inhibitory (G1) and excitatory neurons (G2). C, E, and G, number of cells as in B.
TABLE 1.
Electrophysiological properties of GABAergic and glutamatergic autaptic neurons derived from Kidins220−/− mice and wild-type littermates
| Neuronal cell type genotype (number n) | GABAergic |
Glutamatergic |
||
|---|---|---|---|---|
| WT (24) | Kidins220−/− (22) | WT (24) | Kidins220−/− (21) | |
| Cell capacitance (pF) | 26.7 ± 2.3 | 27.0 ± 1.7NSa | 51.0 ± 4.6 | 47.2 ± 2.9NS |
| Resting potential (mV) | −57.2 ± 1.0 | −57.4 ± 1.2NS | −61.8 ± 0.5 | −60.6 ± 0.8NS |
| Input resistance (MΩ) | 257 ± 15 | 250 ± 22NS | 274 ± 24 | 263 ± 28NS |
| Threshold potential (mV) | −29.8 ± 0.8 | −30.0 ± 0.8NS | −30.2 ± 0.8 | −31.8 ± 0.9NS |
a Not significantly different from WT values (Student's t test).
By contrast, glutamatergic neurons derived from Kidins220−/− mice were similar to control cells, regarding threshold current (Fig. 2, A2 and B2), membrane capacitance, resting membrane potential, and input resistance (Table 1). Yet Kidins220−/− cells displayed a small but significant increase of the firing frequency above 200 pA of injected current (Fig. 2C2). Analysis of AP shape in this subpopulation (Fig. 2, D2 and F2), however, did not reveal any difference in spike width (Fig. 2E2), threshold potential (Table 1), maximal rising slope or peak amplitude (Fig. 2G2). In summary, these results indicated that Kidins220 ablation leads to an increase of the Na+ conductance specifically in GABAergic, but not in glutamatergic hippocampal neurons and suggested the possibility of an association between Kidins220 and Nav channels.
Kidins220 Associates with α Subunits of Brain Voltage-gated Na+ Channels
To verify whether Kidins220 associates with Nav channels, we conducted co-immunoprecipitation experiments with lysates from adult mouse brain, using an antibody recognizing all isoforms of Nav α subunits (pan-Nav antibody). As shown in Fig. 3A, we could indeed detect a specific co-immunoprecipitation between endogenous Kidins220 and Nav channels.
The sodium channel α subunit Nav1.2 is one of the main isoforms expressed in the juvenile and adult central nervous system. It is enriched at the axon initial segment of myelinated and unmyelinated neurons, where it contributes to AP onset, and it is also found at the nodes of Ranvier and in the proximity of pre-synaptic terminals (26–28). Given the prominent role of this Nav isoform in the modulation of neuronal excitability, we asked whether Kidins220 could specifically interact with Nav1.2. To this aim, HEK293 cells were co-transfected with HA-Kidins220 and Nav1.2, and co-immunoprecipitation experiments were performed. As shown in Fig. 3B, a clearly detectable Kidins220-immunoreactive band co-immunoprecipitated with Nav1.2, indicating that the two proteins may indeed interact. The weaker signal detected in HEK293 cells, compared with the experiment conducted with brain lysate, could be due to the absence of one or more accessory proteins that may stabilize the association between Kidins220 and Nav channels in neurons, and/or to Kidins220 interaction with other brain Nav α subunits. For technical reasons (see Fig. 3, C and D, and ”Experimental Procedures“ for details), immunoprecipitation of Nav1.2 in transfected cells with pan-Nav antibodies was not possible. Altogether, these results indicate that Kidins220 associates with native Nav channels in mouse brain and, in particular, interacts with the Nav1.2 isoform when both proteins are exogenously expressed in HEK293 cells.
Kidins220 Modulates Nav1.2-dependent Na+ Currents in HEK293 Cells
To evaluate the functional consequences of the Nav1.2-Kidins220 interaction, we performed whole cell patch clamp experiments on transiently transfected HEK293 cells. Recordings on control cells expressing Nav1.2 alone showed typical fast-inactivating Na+ currents (Fig. 4A, left traces). When HEK293 cells were initially co-transfected with approximately equimolar amounts of Kidins220 and Nav1.2 cDNA, we often observed similar currents as in control cells, yet in four cases (out of 27 cells tested) the inactivation kinetics were conspicuously slowed down (Fig. 4A, right traces). A closer inspection revealed that both fast and slow time constants of current decay at −20 mV were dramatically increased in these cells (termed si-Kids for slowly inactivating Kidins220-transfected cells; Fig. 4B), compared with control cells or fast-inactivating Kidins220-transfected cells (termed fi-Kids). We suspected that the low occurrence of si-Kids cells could be related to a low efficiency of Kidins220 expression. Transfecting cells with Kidins220 and Nav1.2 cDNA at progressively higher molar ratios indeed produced increased percentages of si-Kids cells, which, however, did not exceed 50% at a Kidins220:Nav1.2 cDNA ratio of 10 (Fig. 4C). Based on the findings that (i) the inactivation time constants of si-Kids cells were far outside the range of values found in control cells, and (ii) the occurrence of si-Kids depended on the Kidins220:Nav1.2 cDNA ratio, we concluded that Kidins220 co-expression was responsible for the dramatic deceleration of Nav1.2 current inactivation in transfected HEK293 cells. Both fast and slow time constants of inactivation were significantly increased in si-Kids cells over the whole voltage range between −25 and +5 mV, yet the increase of both parameters was particularly pronounced at negative potentials and progressively attenuated toward positive values (Fig. 4, D and E). Additionally, the relative amplitudes of the two components of current decay were affected by Kidins220 co-expression (Fig. 4F): whereas current decay in Nav1.2-expressing cells was dominated by the fast time constant, its amplitude contribution in si-Kids cells decreased by about 10% at all membrane potentials, shifting its relative weight toward the slow component. Finally, the effects of Kidins220 co-expression were not limited to current inactivation, but also affected current activation, because the time required to reach the peak amplitude was significantly increased in si-Kids cells in the whole range of membrane potentials (Fig. 4G). Note that in all cases the various parameters determined in fi-Kids cells were identical to those in control cells (Fig. 4, D–G; Table 2).
FIGURE 4.

Kidins220 co-expression slows the activation and inactivation kinetics of Nav1.2-mediated Na+ currents in HEK293 cells. A, whole cell current recordings on HEK293 cells transiently transfected with Nav1.2 alone (black traces) or co-transfected with Nav1.2 and Kidins220 (red traces). Currents were elicited by step depolarization of 20-ms duration from −60 to +70 mV in 10-mV increments, from a holding potential of −100 mV. Inset, superimposition of current recordings at −20 mV, normalized to the peak current amplitude. B, summary plot of the fast and slow time constants of Na+ current inactivation for HEK293 cells expressing Nav1.2 alone (gray symbols; n = 24) and for cells co-expressing Nav1.2 and Kidins220 (red symbols; n = 46). Time constants were determined by fitting the current decay at −20 mV (upon step depolarization for 150 ms) with a double-exponential function. Dashed lines indicate the mean ± 2 S.D. of the fast and slow time constants, respectively, for control cells expressing Nav1.2 alone (mean values shown as filled circle). The dotted circle encompasses those Kidins220 co-expressing cells showing slow inactivation kinetics (si-Kids). C, occurrence of si-Kids cells (see B) among all cells co-expressing Nav1.2 and Kidins220 plotted as a function of the Kidins220:Nav1.2 cDNA ratio used for HEK293 transfection. The absolute number of si-Kids cells and the total number of cells tested in each condition are indicated above each bar (si-Kids/total). D–G, the fast time constant of inactivation (D), the slow time constant of inactivation (E), the relative amplitudes of the two components of current decay (F), and the time to peak current (G) are plotted as a function of the membrane potential. In F, the relative amplitude of the fast time constant is indicated by circles (as in D), the relative amplitude of the slow time constant is indicated by squares (as in E). Data points represent mean ± S.E. of 24 control cells, 12 si-Kids, and 34 fi-Kids (Kidins220 co-expressing cells showing fast inactivation kinetics). The number symbol (#) in F indicates that si-Kids values were significantly different at all membrane potentials, with Student's t test significance levels ranging from * to ***. Values of fi-Kids cells in D–G were not significantly different from control cells (for reasons of clarity only shown for V = −20 mV).
TABLE 2.
Voltage dependence of Na+ current activation and fast inactivation in HEK293 cells expressing either Nav1.2 alone (Nav1.2) or Nav1.2 + Kidins220 (Kids)
Va, ka, Vi, and ki, are the half-activation voltages and the respective slope factors of the Boltzmann fits for Nav1.2 channel activation (a) and fast inactivation (i). See “Experimental Procedures” for details. Student's t test versus Nav1.2 values.
| Cells | Activation |
Inactivation |
|||
|---|---|---|---|---|---|
| Va | ka | Vi | ki | n | |
| mV | mV | ||||
| Nav1.2 | −23.3 ± 0.9 | 5.7 ± 0.2 | −57.2 ± 1.2 | 6.4 ± 0.2 | 24 |
| si-Kids | −12.2 ± 0.8a | 7.1 ± 0.4b | −47.8 ± 0.8a | 6.7 ± 0.2NSc | 12 |
| fi-Kids | −24.5 ± 1.2NS | 6.2 ± 0.2NS | −58.4 ± 1.0NS | 6.6 ± 0.1NS | 34 |
a p < 0.001.
b p < 0.01.
c Not significantly different from WT values (Student's t test).
The plot of the current-voltage relationships showed no significant difference in the peak current densities, yet it indicated that Na+ currents activated at more positive membrane potentials in si-Kids cells (Fig. 5A). Indeed, the normalized conductance curve for these cells was significantly shifted rightwards compared with control cells (Fig. 5B), suggesting that Kidins220 co-expression negatively affects the voltage dependence of Nav1.2 channel activation, i.e. channels in these cells activate with lower voltage sensitivity at potentials ∼11 mV more positive than in control cells (Table 2).
FIGURE 5.

Kidins220 co-expression alters the voltage-dependent activation and fast inactivation of Nav1.2-mediated Na+ currents in HEK293 cells. A, current-voltage relationships recorded in HEK293 cells transfected with Nav1.2 alone (control cells; n = 24; black symbols) or co-transfected with Nav1.2 and Kidins220 (si-Kids cells; n = 12; red symbols). Peak amplitudes were normalized to the cell capacitance to obtain current densities. B, voltage dependence of Nav channel activation derived from current-voltage relationships, as described under ”Experimental Procedures“. Symbols and n values are as described in A. Smooth lines represent Boltzmann functions using the mean values for Va and ka determined from fits of single experiments (Table 2). C, voltage dependence of fast inactivation assessed in response to 150-ms inactivating pre-pulses. Symbols and n values are as described in A. Smooth lines represent Boltzmann functions using the mean values for Vi and ki determined from fits of single experiments (Table 2). D, time-dependent recovery from fast inactivation at recovery test potentials of −140, −120, and −100 mV. Symbols as in A, n = 21–23 for control cells, n = 8–10 for si-Kids cells. Smooth lines represent fits to a monoexponential function. E, the time constant of recovery from fast inactivation, determined from data fits in D, is plotted as a function of the test potential during the recovery period. Symbols as in A, n values as in D. F and G, computational modeling of interneuronal excitability. In simulated Kidins220−/− neurons, the Nav channel activation and inactivation curves were shifted toward negative potentials by 10 mV (for WT: Va = −20 mV, Vi = −40 mV; for Kidins220−/−: Va = −30 mV, Vi = −50 mV). F, maximum rising slope of action potentials derived from the simulation (sim) and experimental data (exp; Fig. 2G1). G, plot of the instantaneous firing frequency (i-F) versus injected current amplitude in simulated WT (black line) and Kidins220−/− neurons (blue line). The dashed line corresponds to simulated Kidins220−/− neurons with the additional constraint of faster inactivation kinetics.
In addition to the strong effects on the kinetics of current decay (Fig. 4, A–F), Kidins220 co-expression also altered the voltage dependence of fast inactivation. The steady-state availability curve for si-Kids cells was shifted by about 10 mV toward more depolarized potentials compared with control cells, in this case without a significant change of the voltage sensitivity (Fig. 5C; Table 2). Not only Nav1.2 channels in si-Kids cells were more reluctant to enter the fast-inactivated state, but they also showed faster recovery: the time constant of recovery was significantly lower at the test potential of −100 mV, but tended to approach control values at more negative test potentials (Fig. 5, D and E).
We used a modeling approach to test whether the Kidins220-dependent alterations of Na+ currents in HEK293 cells are sufficient to explain the firing phenotype observed in Kidins220−/− GABAergic neurons. We employed a computational model of CA1/CA3 hippocampal interneurons (24) that allowed incorporation of the main biophysical features of Nav channels. To reproduce the Kidins220−/− condition in the model neuron, 10-mV leftwards shifts were introduced in both the activation and inactivation curves. Without any further changes to the model, action potentials in Kidins220−/− model neurons showed an increased maximum rising slope (Fig. 5F), in agreement with the experimental data. Likewise, the input-output relationship of Kidins220−/− neurons was shifted leftwards compared with wild-type neurons (Fig. 5G, compare with Fig. 2C1). It should be noted that additional modification of the Nav channel fast inactivation kinetics had no significant effect on the f-I curve (Fig. 5G, dashed line). In summary, a GABAergic neuron model containing the major Kidins220-dependent Nav channel alterations largely reproduced the changes in AP firing in Kidins220−/− inhibitory neurons.
Discussion
In the present study, we investigated the role of the scaffold protein Kidins220 in the regulation of neuronal excitability using embryonal hippocampal neurons isolated from the previously described Kidins220−/− full knock-out mice (16). Current-clamp recordings revealed increased excitability in GABAergic and, to a lower extent, in glutamatergic Kidins220−/− neurons. We observed higher action potential rising slopes and peak amplitudes in Kidins220−/− GABAergic neurons, pointing to an increased Na+ conductance, which lead us to deduce a misregulation of Nav channels in these cells. Accordingly, we conducted co-immunoprecipitation experiments on mouse cortical brain lysates and HEK293 cells transiently expressing Nav1.2, which supported the association between Kidins220 and α subunits of neuronal Nav channels. Importantly, whole cell patch clamp experiments showed that Kidins220 co-transfection in HEK293 cells caused complex changes in Nav1.2 channel properties, which were partly consistent with decreased excitability (positive shift of the activation curve, slower activation kinetics), partly with increased excitability (positive shift of the steady-state inactivation curve, slower inactivation kinetics, and faster recovery from inactivation). The modifications exerted by Kidins220 on Nav1.2 channels are new and substantial. They indicated that two separate processes of Nav channel function were affected: (i) gate opening as a result of the movement of the voltage-sensing transmembrane domains (channel activation) (29), and (ii) subsequent pore occlusion by an inactivating blocking particle through a “hinged-lid” mechanism (fast channel inactivation) (30).
Kidins220 association with brain Nav channels gains further importance in view of the well established connection between BDNF signaling and neuronal excitability. In fact, being a direct target of Trk neurotrophin receptors, the Kidins220 protein could be in a strategic intermediary position between TrkB receptor activation and downstream ion channel modulation. Notably, among the different examples present in the literature (31–34), some specifically concern Nav channels: Nav1.2 channels are subject to dynamic regulation by tyrosine phosphorylation/dephosphorylation events, with Fyn kinase acting to increase fast inactivation in response to TrkB activation (20, 35) and the tyrosine phosphatase RPTPβ having the opposite effect (36). Furthermore, BDNF (in complex with TrkB receptors) has been proposed to elicit the rapid activation of Nav1.9 channels, which appears to occur in a ligand-gated rather than in a voltage-gated manner (37). BDNF-dependent Nav1.9 channel activation lead to fast membrane depolarization and increased excitability in different neuronal cell types (38). The modulation of Nav1.2 channel properties in HEK293 cells reported here depended solely on Kidins220 co-expression. Kidins220 may convey extracellular signals to the channels, via phosphorylation of specific sites or by assembling a platform of adaptor/signaling proteins around the channels to initiate the appropriate intracellular response. Given the prominent role of Kidins220 as a mediator of neurotrophin signaling, it will be important to study whether the Kidins220-Nav channel interaction is modulated by the TrkB/BDNF signaling pathway.
Clearly, the effects of Kidins220 expression on neuronal excitability are not easily predictable from our co-expression data, principally because of the complexity of Nav1.2 channel modification and also because neurons express diverse isoforms of Nav α subunits (among which also Nav1.2) at different densities in distinct neuronal compartments. Kidins220 ablation apparently increased the Na+ conductance in GABAergic hippocampal neurons, which may be due to higher plasma membrane expression of Nav α subunits or to shifts in the voltage dependence of Nav channel activation or fast inactivation. Our data suggest that Kidins220 modulates neuronal excitability by acting, at least partly, on Nav channel properties, which is supported by simulation data showing that introducing the Kidins220-dependent Na+ current alterations in an in silico model of CA1/CA3 hippocampal interneurons was sufficient to recapitulate the main findings observed in Kidins220−/− GABAergic neurons. However, the involvement of alternative mechanisms cannot be excluded. The findings presented here raise a number of interesting questions concerning the α subunit specificity, the subcellular localization, and cell-type specificity of Kidins220 association, which will be a subject of future investigation.
Notably, increased excitability of Kidins220−/− neurons manifested itself principally in inhibitory neurons, similarly to what has been observed for synaptic plasticity paradigms (22). The reason for this is currently unclear, but is likely to be related to cell-specific differences in the expression and/or subcellular localization of Kidins220-interacting proteins, as Kidins220 localizes to soma and processes of both inhibitory and excitatory neurons (7, 22). In both cases, i.e. synaptic plasticity and intrinsic excitability of inhibitory neurons, Kidins220 ablation appeared to cause gain-of-function phenotypes: inhibitory post-synaptic currents showed faster recovery from synaptic depression in response to paired-pulse and prolonged train stimulation (22); here we showed that GABAergic neurons required less current injection to elicit AP firing and reached higher spiking frequencies. Interestingly, blockade of endogenous TrkB receptors in pyramidal neurons from rat visual cortex similarly reduced the threshold current and increased the instantaneous firing frequency (39). Both Kidins220−/− phenotypes would be expected to reinforce the weight of synaptic inhibition within the neuronal network, thereby reducing its overall activity. MEA recordings on hippocampal neurons fully confirmed this prediction, as they revealed a striking impairment of delayed spiking activity in Kidins220−/− cultures subjected to pulse stimulation.
The reduction of the threshold current in Kidins220−/− GABAergic neurons was likely due to specific membrane conductance changes in the subthreshold potential range, because resting membrane potential and input resistance were unaffected. Apart from Nav channels, Kidins220 ablation may also cause alterations of M-type K+ currents mediated by Kv7/KCNQ channels, known to be involved in the regulation of interneuronal excitability (40) and to be modulated by a variety of neurotransmitters and hormones (41). This hypothesis gains in weight by recent results showing a potentiation of M-type K+ currents in parvalbumin-positive hippocampal interneurons by BDNF (34).
Altogether, our results identify Kidins220 as a powerful new modulator of Nav channel function, indicating a potential role in the control of neuronal excitability, both at the single-cell level and the network level. Interestingly, Kidins220 action seems to be more evident in GABAergic neurons, suggesting that it may participate in the maintenance of the balance between excitation and inhibition in neural networks. These results deepen our understanding of the molecular mechanisms modulating neural excitability and network activity and may open new perspectives to target the increasing number of pathologies associated with a dysregulation of Nav channel function and altered network excitability.
Author Contributions
J. S. S., F. C., and F. B. designed the study. J. S. S. (patch clamp electrophysiology), E. F. (MEA electrophysiology), A. S. and F. C. (biochemistry) performed the experiments and analyzed the data. T. N. performed modeling work. J. S. S. and F. C. wrote the manuscript. All authors reviewed the results and approved the final version of the manuscript.
Acknowledgments
We thank Cristiana Picco, Anna Boccaccio (IBF-CNR, Genoa) and Fanny Jaudon (IIT, Genoa) for valuable advice, useful discussions and critical reading of the manuscript, Pietro Baldelli (University of Genoa) for support in early stages of the study, and Marina Nanni (IIT) for excellent technical assistance. We are grateful to G. P. Schiavo (London, UK) and W. A. Catterall (Seattle, Washington) for providing the Kidins220 and Nav1.2 constructs.
This work was supported by grants from the Compagnia di San Paolo (to F. C.), Istituto Italiano di Tecnologia (to F. B.), and European Union FP7 Integrating Project “Desire” Grant 602531 (to F. B. and F. C.). The authors declare that they have no conflict of interest with the contents of this article.
- Kidins220
- kinase D-interacting substrate of 220 kDa
- ARMS
- ankyrin repeat-rich membrane spanning
- Nav channel
- voltage-gated Na+ channel
- AP
- action potential
- Trk
- tropomyosin-related kinase
- MEA
- multielectrode array
- si-Kids
- Nav1.2/Kidins220-expressing cells showing slow inactivation kinetics
- fi-Kids
- Nav1.2/Kidins220-expressing cells showing fast inactivation kinetics.
References
- 1. Iglesias T., Cabrera-Poch N., Mitchell M. P., Naven T. J., Rozengurt E., Schiavo G. (2000) Identification and cloning of Kidins220, a novel neuronal substrate of protein kinase D. J. Biol. Chem. 275, 40048–40056 [DOI] [PubMed] [Google Scholar]
- 2. Kong H., Boulter J., Weber J. L., Lai C., Chao M. V. (2001) An evolutionarily conserved transmembrane protein that is a novel downstream target of neurotrophin and ephrin receptors. J. Neurosci. 21, 176–185 [DOI] [PMC free article] [PubMed] [Google Scholar]
- 3. Neubrand V. E., Cesca F., Benfenati F., Schiavo G. (2012) Kidins220/ARMS as a functional mediator of multiple receptor signalling pathways. J. Cell Sci. 125, 1845–1854 [DOI] [PubMed] [Google Scholar]
- 4. Cortés R. Y., Arévalo J. C., Magby J. P., Chao M. V., Plummer M. R. (2007) Developmental and activity-dependent regulation of ARMS/Kidins220 in cultured rat hippocampal neurons. Dev. Neurobiol. 67, 1687–1698 [DOI] [PubMed] [Google Scholar]
- 5. Arévalo J. C., Wu S. H., Takahashi T., Zhang H., Yu T., Yano H., Milner T. A., Tessarollo L., Ninan I., Arancio O., Chao M. V. (2010) The ARMS/Kidins220 scaffold protein modulates synaptic transmission. Mol. Cell. Neurosci. 45, 92–100 [DOI] [PMC free article] [PubMed] [Google Scholar]
- 6. Wu S. H., Arévalo J. C., Neubrand V. E., Zhang H., Arancio O., Chao M. V. (2010) The ankyrin repeat-rich membrane spanning (ARMS)/Kidins220 scaffold protein is regulated by activity-dependent calpain proteolysis and modulates synaptic plasticity. J. Biol. Chem. 285, 40472–40478 [DOI] [PMC free article] [PubMed] [Google Scholar]
- 7. Sutachan J. J., Chao M. V., Ninan I. (2010) Regulation of inhibitory neurotransmission by the scaffolding protein ankyrin repeat-rich membrane spanning/kinase D-interacting substrate of 220 kDa. J. Neurosci. Res. 88, 3447–3456 [DOI] [PubMed] [Google Scholar]
- 8. López-Menéndez C., Gascón S., Sobrado M., Vidaurre O. G., Higuero A. M., Rodríguez-Peña A., Iglesias T., Díaz-Guerra M. (2009) Kidins220/ARMS downregulation by excitotoxic activation of NMDARs reveals its involvement in neuronal survival and death pathways. J. Cell Sci. 122, 3554–3565 [DOI] [PubMed] [Google Scholar]
- 9. Shin H., Hsueh Y. P., Yang F. C., Kim E., Sheng M. (2000) An intramolecular interaction between Src homology 3 domain and guanylate kinase-like domain required for channel clustering by postsynaptic density-95/SAP90. J. Neurosci. 20, 3580–3587 [DOI] [PMC free article] [PubMed] [Google Scholar]
- 10. Hervé J. C., Derangeon M., Sarrouilhe D., Bourmeyster N. (2014) Influence of the scaffolding protein zonula occludens (ZOs) on membrane channels. Biochim. Biophys. Acta 1838, 595–604 [DOI] [PubMed] [Google Scholar]
- 11. Arévalo J. C., Yano H., Teng K. K., Chao M. V. (2004) A unique pathway for sustained neurotrophin signaling through an ankyrin-rich membrane-spanning protein. EMBO J. 23, 2358–2368 [DOI] [PMC free article] [PubMed] [Google Scholar]
- 12. Chang M. S., Arevalo J. C., Chao M. V. (2004) Ternary complex with Trk, p75, and an ankyrin-rich membrane spanning protein. J. Neurosci. Res. 78, 186–192 [DOI] [PubMed] [Google Scholar]
- 13. Poo M. M. (2001) Neurotrophins as synaptic modulators. Nat. Rev. Neurosci. 2, 24–32 [DOI] [PubMed] [Google Scholar]
- 14. Minichiello L. (2009) TrkB signalling pathways in LTP and learning. Nat. Rev. Neurosci. 10, 850–860 [DOI] [PubMed] [Google Scholar]
- 15. Levine E. S., Dreyfus C. F., Black I. B., Plummer M. R. (1995) Brain-derived neurotrophic factor rapidly enhances synaptic transmission in hippocampal neurons via postsynaptic tyrosine kinase receptors. Proc. Natl. Acad. Sci. U.S.A. 92, 8074–8077 [DOI] [PMC free article] [PubMed] [Google Scholar]
- 16. Cesca F., Yabe A., Spencer-Dene B., Scholz-Starke J., Medrihan L., Maden C. H., Gerhardt H., Orriss I. R., Baldelli P., Al-Qatari M., Koltzenburg M., Adams R. H., Benfenati F., Schiavo G. (2012) Kidins220/ARMS mediates the integration of the neurotrophin and VEGF pathways in the vascular and nervous systems. Cell Death Differ. 19, 194–208 [DOI] [PMC free article] [PubMed] [Google Scholar]
- 17. Lai H. C., Jan L. Y. (2006) The distribution and targeting of neuronal voltage-gated ion channels. Nat. Rev. Neurosci. 7, 548–562 [DOI] [PubMed] [Google Scholar]
- 18. Bouzidi M., Tricaud N., Giraud P., Kordeli E., Caillol G., Deleuze C., Couraud F., Alcaraz G. (2002) Interaction of the Nav1.2 α subunit of the voltage-dependent sodium channel with nodal ankyrinG: in vitro mapping of the interacting domains and association in synaptosomes. J. Biol. Chem. 277, 28996–29004 [DOI] [PubMed] [Google Scholar]
- 19. Li M., West J. W., Lai Y., Scheuer T., Catterall W. A. (1992) Functional modulation of brain sodium channels by cAMP-dependent phosphorylation. Neuron 8, 1151–1159 [DOI] [PubMed] [Google Scholar]
- 20. Ahn M., Beacham D., Westenbroek R. E., Scheuer T., Catterall W. A. (2007) Regulation of Nav1.2 channels by brain-derived neurotrophic factor, TrkB, and associated Fyn kinase. J. Neurosci. 27, 11533–11542 [DOI] [PMC free article] [PubMed] [Google Scholar]
- 21. Bekkers J. M., Stevens C. F. (1991) Excitatory and inhibitory autaptic currents in isolated hippocampal neurons maintained in cell culture. Proc. Natl. Acad. Sci. U.S.A. 88, 7834–7838 [DOI] [PMC free article] [PubMed] [Google Scholar]
- 22. Scholz-Starke J., Cesca F., Schiavo G., Benfenati F., Baldelli P. (2012) Kidins220/ARMS is a novel modulator of short-term synaptic plasticity in hippocampal GABAergic neurons. PLoS One 7, e35785. [DOI] [PMC free article] [PubMed] [Google Scholar]
- 23. Bologna L. L., Pasquale V., Garofalo M., Gandolfo M., Baljon P. L., Maccione A., Martinoia S., Chiappalone M. (2010) Investigating neuronal activity by SPYCODE multi-channel data analyzer. Neural Netw. 23, 685–697 [DOI] [PubMed] [Google Scholar]
- 24. Minneci F., Janahmadi M., Migliore M., Dragicevic N., Avossa D., Cherubini E. (2007) Signaling properties of stratum oriens interneurons in the hippocampus of transgenic mice expressing EGFP in a subset of somatostatin-containing cells. Hippocampus 17, 538–553 [DOI] [PubMed] [Google Scholar]
- 25. Bean B. P. (2007) The action potential in mammalian central neurons. Nat. Rev. Neurosci. 8, 451–465 [DOI] [PubMed] [Google Scholar]
- 26. Debanne D., Campanac E., Bialowas A., Carlier E., Alcaraz G. (2011) Axon physiology. Physiol. Rev. 91, 555–602 [DOI] [PubMed] [Google Scholar]
- 27. Mantegazza M., Catterall W. A. (2012) Voltage-gated Na+ channels: structure, function, and pathophysiology (Noebels J. L., Avoli M., Rogawski M. A., Olsen R. W., Delgado-Escueta A. V., eds) in Jasper's Basic Mechanisms of the Epilepsies (Internet), 4th Ed, National Center for Biotechnology Information, Bethesda, MD: [PubMed] [Google Scholar]
- 28. Li T., Tian C., Scalmani P., Frassoni C., Mantegazza M., Wang Y., Yang M., Wu S., Shu Y. (2014) Action potential initiation in neocortical inhibitory interneurons. PLoS Biol. 12, e1001944. [DOI] [PMC free article] [PubMed] [Google Scholar]
- 29. Catterall W. A. (2010) Ion channel voltage sensors: structure, function, and pathophysiology. Neuron 67, 915–928 [DOI] [PMC free article] [PubMed] [Google Scholar]
- 30. Goldin A. L. (2003) Mechanisms of sodium channel inactivation. Curr. Opin. Neurobiol. 13, 284–290 [DOI] [PubMed] [Google Scholar]
- 31. Li H. S., Xu X. Z., Montell C. (1999) Activation of a TRPC3-dependent cation current through the neurotrophin BDNF. Neuron 24, 261–273 [DOI] [PubMed] [Google Scholar]
- 32. Rogalski S. L., Appleyard S. M., Pattillo A., Terman G. W., Chavkin C. (2000) TrkB activation by brain-derived neurotrophic factor inhibits the G protein-gated inward rectifier Kir3 by tyrosine phosphorylation of the channel. J. Biol. Chem. 275, 25082–25088 [DOI] [PMC free article] [PubMed] [Google Scholar]
- 33. Tucker K., Fadool D. A. (2002) Neurotrophin modulation of voltage-gated potassium channels in rat through TrkB receptors is time and sensory experience dependent. J. Physiol. 542, 413–429 [DOI] [PMC free article] [PubMed] [Google Scholar]
- 34. Nieto-Gonzalez J. L., Jensen K. (2013) BDNF depresses excitability of parvalbumin-positive interneurons through an M-like current in rat dentate gyrus. PLoS One 8, e67318. [DOI] [PMC free article] [PubMed] [Google Scholar]
- 35. Beacham D., Ahn M., Catterall W. A., Scheuer T. (2007) Sites and molecular mechanisms of modulation of Nav1.2 channels by Fyn tyrosine kinase. J. Neurosci. 27, 11543–11551 [DOI] [PMC free article] [PubMed] [Google Scholar]
- 36. Ratcliffe C. F., Qu Y., McCormick K. A., Tibbs V. C., Dixon J. E., Scheuer T., Catterall W. A. (2000) A sodium channel signaling complex: modulation by associated receptor protein tyrosine phosphatase β. Nat. Neurosci. 3, 437–444 [DOI] [PubMed] [Google Scholar]
- 37. Blum R., Kafitz K. W., Konnerth A. (2002) Neurotrophin-evoked depolarization requires the sodium channel NaV1.9. Nature 419, 687–693 [DOI] [PubMed] [Google Scholar]
- 38. Kafitz K. W., Rose C. R., Thoenen H., Konnerth A. (1999) Neurotrophin-evoked rapid excitation through TrkB receptors. Nature 401, 918–921 [DOI] [PubMed] [Google Scholar]
- 39. Desai N. S., Rutherford L. C., Turrigiano G. G. (1999) BDNF regulates the intrinsic excitability of cortical neurons. Learn Mem. 6, 284–291 [PMC free article] [PubMed] [Google Scholar]
- 40. Lawrence J. J., Saraga F., Churchill J. F., Statland J. M., Travis K. E., Skinner F. K., McBain C. J. (2006) Somatodendritic Kv7/KCNQ/M channels control interspike interval in hippocampal interneurons. J. Neurosci. 26, 12325–12338 [DOI] [PMC free article] [PubMed] [Google Scholar]
- 41. Brown D. A., Passmore G. M. (2009) Neural KCNQ (Kv7) channels. Br. J. Pharmacol. 156, 1185–1195 [DOI] [PMC free article] [PubMed] [Google Scholar]