

Abstract
Rifampin, together with isoniazid, has been the backbone of the current first-line treatment of tuberculosis (TB). The ratio of the area under the concentration-time curve from 0 to 24 h (AUC0–24) to the MIC is the best predictive pharmacokinetic-pharmacodynamic parameter for determinations of efficacy. The objective of this study was to develop an optimal sampling procedure based on population pharmacokinetics to predict AUC0–24 values. Patients received rifampin orally once daily as part of their anti-TB treatment. A one-compartmental pharmacokinetic population model with first-order absorption and lag time was developed using observed rifampin plasma concentrations from 55 patients. The population pharmacokinetic model was developed using an iterative two-stage Bayesian procedure and was cross-validated. Optimal sampling strategies were calculated using Monte Carlo simulation (n = 1,000). The geometric mean AUC0–24 value was 41.5 (range, 13.5 to 117) mg · h/liter. The median time to maximum concentration of drug in serum (Tmax) was 2.2 h, ranging from 0.4 to 5.7 h. This wide range indicates that obtaining a concentration level at 2 h (C2) would not capture the peak concentration in a large proportion of the population. Optimal sampling using concentrations at 1, 3, and 8 h postdosing was considered clinically suitable with an r2 value of 0.96, a root mean squared error value of 13.2%, and a prediction bias value of −0.4%. This study showed that the rifampin AUC0–24 in TB patients can be predicted with acceptable accuracy and precision using the developed population pharmacokinetic model with optimal sampling at time points 1, 3, and 8 h.
INTRODUCTION
Tuberculosis (TB) is still one of the infectious diseases with the highest morbidity and mortality in the world. In 2013, an estimated 9.0 million people acquired TB and 1.5 million people died due to TB (1). First-line treatment of TB consists of administration of isoniazid, rifampin, pyrazinamide, and ethambutol during the first 2 months, continuing with isoniazid and rifampin for another 4 months (2, 3).
In general, the treatment success rate continues to be high among new TB cases globally (1). However, health care providers around the world are still confronted with treatment failure on a regular basis. Recently, it was shown that the risk of treatment failure was almost 9-fold higher in patients with low drug exposure than in patients with higher drug exposure (4). Earlier data already showed that pharmacokinetic variability is likely to be the driving force in the occurrence of development of drug resistance (5).
Studies in both hollow-fiber infection models and murine models showed that the area under the concentration-time curve over 24 h in the steady state divided by the MIC (AUC/MIC ratio) is the best predictive pharmacokinetic/pharmacodynamic parameter for determination of the efficacy of rifampin (6, 7). More importantly, these data were confirmed in TB patients, as poor long-term outcome was predicted by low AUC values (4). In addition, low peak plasma concentration (Cmax)/MIC ratios preceded the acquisition of drug resistance (4).
Drug exposure may be influenced by a number of variables, such as concomitant food intake, comorbidities, and intraindividual differences in pharmacokinetics (8–12). Therefore, it seems rational to monitor drug exposure in patients with suspected malabsorption, gastrointestinal disorders, drug-drug interactions, diabetes mellitus, or HIV coinfection (13). To optimize treatment outcome in patients with suspected low drug exposure, therapeutic drug monitoring (TDM) may be useful (13, 14). In the past, the drug concentration level at 2 h after administration (C2) has been used to approximate Cmax, and the level at 6 h (C6) has been used to distinguish between delayed absorption and overall poor intestinal absorption (13). Indeed, it has been recognized that the C2 level does not always capture the Cmax (15–17). Furthermore, it is unknown whether C2 and C6 levels do reflect AUC values or can be used to accurately predict the AUC values (18). Obtaining a full concentration-time curve to calculate the AUC values is a laborious and expensive procedure and is thus not feasible in clinical practice. Alternative strategies to easily evaluate drug exposure are urgently needed. An optimal sampling procedure based on a population pharmacokinetic model may help to overcome these problems. This method implies that a limited number of appropriately timed blood samples are needed to adequately predict the AUC as a measure for drug exposure (19–21). Therefore, the objective of this study was to develop and validate an optimal sampling procedure for determination of rifampin concentrations based on population pharmacokinetics, in order to predict the area under the concentration-time curve from 0 to 24 h (AUC0–24) for this pivotal anti-TB drug.
(Part of these data was presented as an oral presentation at the 6th International Workshop on Clinical Pharmacology of Tuberculosis Drugs, 9 September 2013, Denver, CO, and at the Dutch Medicines Days, FIGON, 1 October 2013, Ede, The Netherlands.)
MATERIALS AND METHODS
Study population.
The study population was constituted of two groups. Those in group 1 were patients aged at least 18 years who were eligible for inclusion if they had been treated with rifampin for drug-susceptible TB at the University Medical Center Groningen, Tuberculosis Centre Beatrixoord, Haren, The Netherlands, between 2009 and 2013. Patients whose body weight was below 50 kg were administered 450 mg of rifampin, and patients over 50 kg received 600 mg of rifampin. In general, to prevent or alleviate adverse gastrointestinal effects of rifampin administration, patients received a light breakfast before taking the medication. After at least 2 weeks of treatment, a pharmacokinetic curve consisting of a predose and three to nine time points randomly between 0.5 and 8 h postdose was obtained for TDM as part of routine patient care. The predose level was obtained just before dosing, and this level was defined as C24, the concentration level at 24 h. Samples were transported the same day to the laboratory, and plasma samples were separated and stored at −20°C until analysis, which was performed within 10 days. Under these circumstances, rifampin concentrations are stable, as evidenced by our previous assay (12, 22). Plasma samples were analyzed for rifampin by liquid chromatography-tandem mass spectrometry (LC-MS/MS), as previously described (23, 24). Plasma concentration values below the lower quantification limit were treated as zeros. Demographic and medical data, including age, sex, weight, height, serum creatinine level, diagnosis, localization of TB, ethnicity, presence of comorbidity and concomitant medication, and rifampin dose, were collected from the medical chart. This study was evaluated by the local ethics committee and found to be in accordance with the Dutch law due to its retrospective nature (ERB decision 2013-492).
To also include patients who had received rifampin in a fasted state, data from patients from an earlier study at our centers were included (21). These patients constituted group 2. Study subjects were TB patients admitted to the two Dutch TB referral centers, the above-mentioned Tuberculosis Centre Beatrixoord, Haren, and the Centre for Chronic Diseases Dekkerswald, Radboud University Medical Center, Nijmegen, The Netherlands (21). The patients who were included were at least 18 years of age, and they had to provide written informed consent. The study protocol was approved by the Ethical Review Board of Radboud University Medical Center Nijmegen, Nijmegen, The Netherlands (21). Patients whose body weight was below 50 kg were administered 450 mg of rifampin, and patients over 50 kg received 600 mg of rifampin. A full pharmacokinetic curve was recorded during the intensive phase of TB treatment after the steady state was reached (≥2 weeks). Patients refrained from food intake from 11:00 p.m. on the day preceding the pharmacokinetic assessment to 4 h after intake of the study medication. Serial venous blood samples were collected just prior to and at 1.0, 1.5, 2.0, 2.5, 3.0, 4.0, 6.0, 8.0, 12.0, and 24.0 h after witnessed intake of the study medication. Plasma samples were separated immediately, frozen at −80°C, and transported on dry ice for bioanalysis (21). Plasma samples were analyzed for rifampin levels by high-performance liquid chromatography (HPLC), as previously described (12, 25).
Population pharmacokinetic model.
The concentration-time curves were used to develop a one-compartmental population pharmacokinetic model using an iterative two-stage Bayesian (ITSB) procedure (KinPop module of MW\Pharm version 3.60; Mediware, Zuidhorn, The Netherlands) (5, 10, 11). This design was chosen despite rifampin's relatively complex and nonlinear pharmacokinetics, with distribution to a wide variety of tissues, conversion into its slightly active metabolite desacetyl-rifampin, and both hepatic and renal clearance (12, 26, 27). However, the one-compartmental model can be justified as rifampin diffuses easily to tissue (28–30) and it had been used earlier (10, 11, 31, 32). The final model was selected based on the Akaike information criterion (AIC), a measure for goodness of fit (33).
The bioavailability of rifampin could not be determined because it was administered orally only. Furthermore, its bioavailability is known to be almost complete and therefore, was assumed to be equivalent to a value of 1 (8) [Micromedex 2.0 (electronic version); Thomson Reuters (Healthcare), Greenwood Village, CO, USA]. On the basis of the pertinent literature, the rifampin clearance/creatinine clearance ratio (fr) was 0.14 (28, 29). Pharmacokinetic parameters were assumed to be log-normally distributed. Residual errors were assumed to be normally distributed, with standard deviation (SD) calculated as follows: SD = 0.1 + 0.10 × C, where C is the observed plasma concentration of rifampin.
To evaluate the ability of this population pharmacokinetic model to predict individual AUC values, cross-validation was performed. For this cross-validation, a number of submodels were developed, with each model leaving out five patients. The number of submodels was equal to the number of sets of five patients among the total number of patients. All subjects were excluded once, and the AUC of each “left-out” subject was estimated (AUC0–24, estimated) by fitting the concentration-time curve using the complementary submodel excluding this subject. This left-out model estimates how well the final model might perform to predict individual AUC0–24 values for future TB patients (20, 34). For all subjects, this AUC0–24, estimated value was compared to the calculated AUC0–24 value (AUC0–24, calculated). AUC0–24, calculated values and the values of the other individual pharmacokinetic parameters were calculated using MW\Pharm's KinFit module. AUC0–24, calculated values were determined by the log-linear trapezoidal rule. Cmax was defined as the highest observed plasma concentration, with the median time to maximum concentration of drug in serum (Tmax) as the corresponding time.
OSS.
A Monte Carlo simulation of 1,000 subjects randomly drawn from the population model was used to evaluate optimal sampling strategies (OSS) for prediction of AUC0–24. OSS with different combinations of one to three sampling time points ranging from 0 to 24 h with a time resolution of 1 h were evaluated using Bayesian fitting. All possible combinations within the groups of one to three time points were evaluated. OSS was considered acceptable when the root mean square error (RMSE), a measure of precision, was <15%. The mean prediction error, a measure of bias, was accepted when it was <5%. The best-performing OSS was subsequently evaluated by comparing the AUC0–24 predicted with OSS (AUC0–24, OSS) to the AUC0–24, calculated for all patients. Group 1 patients were sampled predose and randomly between 0.5 and 8 h. If the exact time point was unavailable, the nearest (preferably, earlier) time point (for instance, 7 instead of 8 h) was chosen for prediction of AUC0–24, OSS.
Statistics.
The influence of patient characteristics on population pharmacokinetic parameters was investigated with a Mann-Whitney U test, a chi-square test, or a Kruskal-Wallis test or by determination of the Spearman correlation coefficient. Correlation between different AUC values was studied using the Spearman correlation coefficient. Agreement between AUC0–24, calculated and AUC0–24, OSS was evaluated using a Bland-Altman analysis. Two-sided P values of ≤0.05 were considered statistically significant. All statistical measurements were either derived directly from MW\Pharm or computed using IBM SPSS Statistics 20 (IBM Corp., Armonk, NY, USA).
RESULTS
Study population.
This study included 55 patients: 22 from group 1, the patient care cohort of 2009 to 2013, and 33 patients from group 2, the earlier study. Patient characteristics are displayed in Table 1. Several characteristics, especially weight and those related to weight, were significantly different between the group of patients and the population of study participants. The median administered dose was 10.2 (range, 4.7 to 21.4) mg of rifampin/kg of body weight. Most patients (85%) received 600 mg rifampin. Dosage regimens of 450 mg and 900 mg were received by five (9%) and three (5%) patients, respectively. Gender, dose, age, body surface area (BSA), ethnicity, and presence of comorbidity or concomitant medication had no significant influence on the individual pharmacokinetic parameters (all P values > 0.05). Table 2 shows the calculated pharmacokinetic parameters of the concentration-time curves that were used for modeling (n = 55).
TABLE 1.
Patient demographics
| Patient parameter | Result(s)a |
Pb | ||
|---|---|---|---|---|
| Group 1 (n = 22) | Group 2 (n = 33) | All patients (n = 55) | ||
| Male/female, n (%) | 14/8 (64/36) | 29/4 (88/12) | 43/12 (78/22) | 0.035 |
| Age, yr, median (IQR) | 36 (24–43) | 44 (30–57) | 39 (29–51) | 0.052 |
| Wt, kg | 56.5 (16.6) | 65.9 (15.6) | 62.2 (16.5) | 0.011 |
| Lean body mass, kg | 52.2 (10.6) | 61.8 (8.8) | 58.0 (10.6) | 0.001 |
| Ht, m | 1.70 (0.09) | 1.73 (0.08) | 1.72 (0.08) | 0.115 |
| Body mass index, kg/m2 | 19.7 (5.8) | 22.0 (5.0) | 21.1 (5.4) | 0.037 |
| Body surface area, m2 | 1.63 (0.22) | 1.80 (0.21) | 1.74 (0.23) | 0.012 |
| Dose, mg | 614 (130) | 595 (26.1) | 602 (84.1) | 0.844 |
| Dose/wt, mg/kg | 11.4 (3.2) | 9.40 (1.8) | 10.2 (2.6) | 0.008 |
| Ethnicity, n (%) | 0.081c | |||
| Black | 11 (50) | 10 (30) | 21 (38) | |
| Caucasian | 4 (18) | 14 (42) | 18 (33) | |
| Asian | 1 (5) | 5 (15) | 6 (11) | |
| Other | 6 (27) | 4 (12) | 10 (18) | |
| Type of tuberculosis, n (%): | 0.089c | |||
| Pulmonary | 12 (55) | 27 (82) | 39 (71) | |
| Extrapulmonary | 6 (27) | 4 (12) | 10 (18) | |
| Both | 4 (18) | 2 (6) | 6 (11) | |
| Comorbidity, present n (%) | 4 (18) | 13 (39) | 17 (31) | 0.095c |
| Comedication, present n (%) | 7 (32) | 26 (79) | 33 (60) | 0.000c |
| Samples/patient, n (%) | 6.5 (1.3) | 10.3 (0.9) | 8.8 (2.2) | 0.000 |
| Sampling schedule | Predose and random times between 0.5 and 8 h postdose | Predose and 1.0, 1.5, 2.0, 2.5, 3.0, 4.0, 6.0, 8.0, 12.0, and 24.0 h postdose | ||
Data are presented as means (SD), unless stated otherwise. IQR, interquartile range.
Continuous data from comparisons of groups 1 and 2 were tested using the Mann-Whitney U test.
Chi-square test.
TABLE 2.
Noncompartmental pharmacokinetic parameters of rifampina
| Pharmacokinetic parameter | Valuesa |
Pb | ||
|---|---|---|---|---|
| Group 1 (n = 22) | Group 2 (n = 33) | All patients (n = 55) | ||
| AUC0–24 (mg · h/liter) | 35.2 (23.9–109) | 46.3 (13.5–117) | 41.5 (13.5–117) | 0.007 |
| Cmax (mg/liter) | 6.8 (3.5–15.6) | 9.3 (2.4–24.1) | 8.2 (2.4–24.1) | 0.002 |
| Tmax (h) | 2.6 (0.5–4.5) | 2.0 (0.4–5.7) | 2.2 (0.4–5.7) | 0.069 |
| CL/F (liter/h) | 17.5 (10.0–31.5) | 13.0 (4.9–51.3) | 14.7 (4.9–51.3) | 0.013 |
| V/F (liter) | 51.9 (25.5–103) | 41.5 (12.8–182) | 45.4 (12.8–182) | 0.054 |
| t1/2 (h) | 1.9 (0.7–2.4) | 2.2 (1.6–6.6) | 2.1 (0.7–6.6) | 0.559 |
Data are presented as geometric mean (range), except for the Tmax data, which are displayed as median (range). AUC0–24, area under the concentration-time curve from 0 to 24 h in milligrams × hour per liter; Cmax, maximum concentration in mg per liter; Tmax, time to maximum concentration in hours; CL/F, apparent clearance in liters per hour; V/F, apparent volume of distribution in liters; t1/2, elimination half-life in hours. F, bioavailability.
Data from comparisons of groups 1 and 2 were tested using the Mann-Whitney U test.
Population pharmacokinetic model.
The final one-compartmental model was selected based on the Akaike information criterion (33). Geometric mean pharmacokinetic parameters of the final population model (n = 55) are shown in Table 3. Pharmacokinetic parameters of the two patient groups are shown in Table 4. The mean values from the 11 submodels developed for cross-validation were close to those from the final model.
TABLE 3.
Final population pharmacokinetic model parametersa
| Pharmacokinetic parameter | Values for all patients (n = 55) |
|---|---|
| CLm/F (liters/h/1.85 m2) | 15.5 (8.0) |
| fr | 0.14 (fixed) |
| V/F (liters/kg LBM) | 0.713 (0.282) |
| ka (1/h) | 1.14 (1.03) |
| Tlag (h) | 0.887 (0.571) |
| F | 1 (fixed) |
Data are presented as population mean (SD). Bioavailability (F) was fixed at a value of 1, and the rifampin clearance/creatinine clearance ratio (fr) was fixed at a value of 0.14. CLm/F, apparent metabolic clearance in liters per hour normalized to a body surface area of 1.85 m2; V/F, apparent volume of distribution in liters per kilogram of lean body mass (LBM); ka, absorption rate constant in 1/h; Tlag, lag time in the absorption phase in hours.
TABLE 4.
Pharmacokinetic parameters of group 1 and group 2a
| Pharmacokinetic parameter | Values |
Pb | |
|---|---|---|---|
| Group 1 (n = 22) | Group 2 (n = 33) | ||
| CLm/F (liters/h/1.85 m2) | 17.9 (9.1–32.9) | 13.8 (5.4–54.3) | 0.035 |
| V/F (liters/kg LBM) | 0.844 (0.545–1.514) | 0.637 (0.325–1.162) | 0.002 |
| ka (1/h) | 0.90 (0.22–3.24) | 1.33 (0.26–5.37) | 0.078 |
| Tlag (h) | 1.11 (0.46–2.92) | 0.77 (0.30–2.12) | 0.017 |
Data are presented as geometric mean (range). CLm/F, apparent metabolic clearance in liters per hour normalized to a body surface area of 1.85 m2; V/F, apparent volume of distribution in liters per kg of lean body mass; ka, absorption constant in 1/h; Tlag, lag time in the absorption phase in hours.
Data from comparisons of groups 1 and 2 were tested using the Mann-Whitney U test.
Compared to the AUC0–24, calculated values, the AUC0–24, estimated values were underestimated by a median difference of 5.9% (range, −39.8% to 13.5%). A highly positive correlation between the two AUC calculations was shown by the Spearman correlation coefficient, r = 0.96 (P < 0.01). In Fig. 1, the correlation between AUC0–24, calculated and AUC0–24, estimated values is shown. For one subject, fitting the concentration-time curve using its complementary submodel as a Bayesian prior resulted in a large difference between AUC0–24, estimated and AUC0–24, calculated (65.7 and 109 mg · h/liter, respectively; underestimation, 39.8%). With this estimation considered an outlier (>3 · SD difference), the median underestimation decreases to 4.9% (range, −21.8% to 13.5%), indicating limited influence of the outlier.
FIG 1.

Correlation of AUC0–24, calculated (mg · h/liter) and AUC0–24 estimated (mg · h/liter) in the cross-validation. AUC0–24, estimated was determined by fitting the individual concentration-time curve using the complementary submodel excluding this subject.
Optimal sampling strategy.
Of all the OSS possibilities, the five best-performing OSS values for one, two, and three time points are shown in Table 5. RMSE values of all OSS with either one or two time points were >15%. The values for RMSE and bias of the five best-performing OSS with three samples were <15% and <5%, respectively. Based on clinical suitability, an OSS with time points of sampling at 1, 3, and 8 h (OSS 1–3–8) was considered the best option.
TABLE 5.
Best-performing optimal sampling strategies for one, two, and three time points
| First sampling time point (h) | Second sampling time point (h) | Third sampling time point (h) | Correlation coefficient (r) | Mean predictive error (% bias) | % RMSEa |
|---|---|---|---|---|---|
| 7 | 0.83 | 3.8 | 27.4 | ||
| 6 | 0.83 | 0.5 | 27.6 | ||
| 8 | 0.83 | 5.7 | 27.9 | ||
| 5 | 0.81 | −4.2 | 29.0 | ||
| 9 | 0.81 | 6.9 | 29.1 | ||
| 3 | 10 | 0.93 | −3.2 | 18.3 | |
| 2 | 8 | 0.92 | 0.3 | 18.7 | |
| 3 | 9 | 0.93 | −4.4 | 18.8 | |
| 2 | 7 | 0.92 | −2.8 | 18.8 | |
| 3 | 8 | 0.93 | −5.2 | 19.0 | |
| 1 | 3 | 8 | 0.96 | −0.4 | 13.2 |
| 2 | 4 | 10 | 0.96 | −2.7 | 14.0 |
| 2 | 4 | 9 | 0.96 | −3.6 | 14.0 |
| 1 | 3 | 9 | 0.96 | −0.6 | 14.2 |
| 2 | 5 | 14 | 0.96 | −2.3 | 14.3 |
RMSE, root mean square error.
AUC0–24, OSS 1–3–8 correlated to AUC0–24, calculated with a Spearman correlation coefficient of 0.95 (P < 0.01) and was underestimated by a median difference of 1.0% (range, −24.9% to 10.0%). Agreement between AUC0–24, calculated and the estimated AUC0–24, OSS 1–3–8 is shown in the Bland-Altman plot (Fig. 2). In the Bland-Altman plot, data from four patients can be observed that are below the lower line of agreement. High AUC0–24, calculated values (90 to 110 mg · h/liter) were seen with all four patients, and the values were underestimated by 17.9% to 24.9%. The estimated AUC0–24, OSS 1–3–8 values ranged from 72 to 90 mg · h/liter and were thus all still reasonably high.
FIG 2.
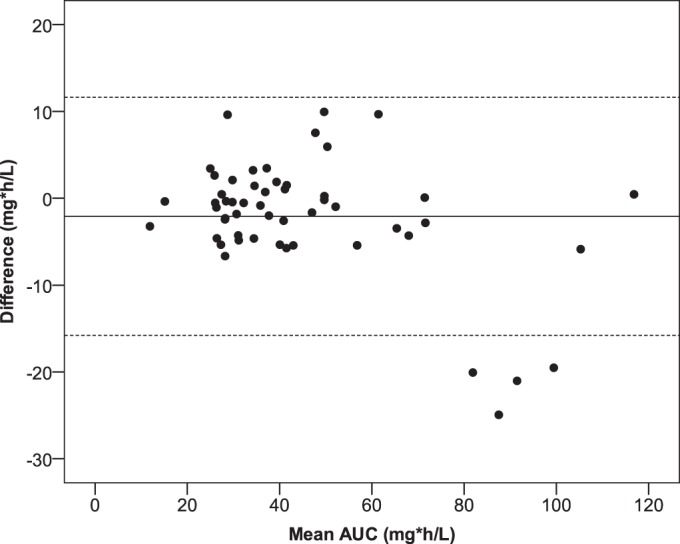
Bland-Altman plot of mean AUC0–24 (mg · h/liter) versus the difference between AUC0–24, calculated and AUC0–24, OSS 1–3–8 (mg · h/liter). The solid line represents the mean difference. The corresponding limits of agreement (mean difference ± 2 SD difference) are depicted as dashed lines.
DISCUSSION
Here we developed a population pharmacokinetic model and an OSS using time points 1, 3, and 8 h. Using these combined approaches, we were able to predict rifampin AUC0–24 values with sufficient accuracy and precision.
Comparing the two groups of patients, it can be observed that the AUC0–24 and Cmax values were higher in group 2. The differences in these parameters may have been caused by the differences in food intake or fasting around the time that the medication was ingested in the two groups. However, the magnitude of this factor is unclear. A meta-analysis of the impact of concomitant food intake has shown that there is no difference in rifampin AUC values after food or fasting (35). A recent study showed a 26% decrease in AUC0–10 values under fed conditions compared with fasted conditions (36). As a consequence of the lower AUC values in group 1 patients, clearance was higher in this group than in group 2.
A limitation of this study is that only patients admitted to a TB referral center, not regular outpatients, were included, which may have introduced selection bias. However, in our experience, these patients in particular are typically selected for TDM, as TDM in patients with drug-susceptible TB is mainly performed if problems emerge with therapy.
TDM of rifampin is mostly driven by the need to prevent subtherapeutic levels rather than by concerns regarding toxicity, as the drug is well tolerated at higher concentrations (12, 37). Due to the correlation between the bactericidal effect of rifampin and the AUC (4, 6, 7), the validation of the population model focused on its ability to predict AUC0–24 values. The model was able to predict the AUC0–24 values with acceptable accuracy and precision. Moreover, discarding of the outlier identified during cross-validation did not result in a large difference, suggesting sufficient robustness of the model.
The precision of the AUC prediction with the best OSS, defined as an RMSE of 13.2%, might still be regarded to be relatively high. However, dose adjustments are generally performed using matching tablets or capsules (i.e., 150 mg or 300 mg), resulting in adjustments of 33% or more. These dose adjustments result in an even higher increase of AUC values (12). We therefore do not consider the possible deviation of the AUC0–24, estimated from the calculated AUC due to imprecision to be clinically relevant. A reason for the high RMSE could be the diverse population used for the development of the population model. Regarded from a contrasting point of view, this implies that implementation of the model and the OSS in TDM might be applicable for various types of patients around the world.
Given that data related to outcome have become available only recently, we aimed at an AUC/MIC ratio of 270 (7). As we studied patients with drug-susceptible TB, actual MICs of the isolates for rifampin were not determined. If the mean MIC for rifampin were defined as 0.2 mg/liter (37), this would imply an adequate or target AUC0–24 value of 54 mg · h/liter or higher. This AUC was obtained in only 13 (24%) of the 55 patients studied. In the event that the observed MIC was lower, this might still result in a favorable AUC/MIC ratio (38). Furthermore, on the basis of the lower AUC0–24 value of 13 mg · h/liter for rifampin in the presence of a pyrazinamide AUC value over 363 mg · h/liter recently proposed by Pasipanodya et al. (4), all our patients obtained sufficient exposure. At this time, a lack of data on drug exposure and MIC values makes it difficult to interpret the drug exposure of a single drug in a four-drug regimen with a possible range of MIC values. Well-designed prospective studies are needed to elucidate the pharmacokinetic/pharmacodynamic targets of the first-line regimen.
The median Tmax value was 2.2 h, ranging from 0.4 to 5.7 h (Fig. 3). The wide range indicates that obtaining only a C2 level would fail to capture the peak concentration in a large proportion of the population. One might argue that this was a consequence of the fact that our group 1 patients receiving standard care were not fasting, due to the institution's regulations. However, this variation in the Tmax value was due only partly to delayed absorption, as the range of Tmax values for the fasted group 2 patients (i.e., 0.4 to 5.7 h) was larger than the range of Tmax values for the patients in group 1 who were allowed to eat (0.5 to 4.5 h).
FIG 3.

Histogram of time of maximum concentration in hours.
Comparing our OSS with the data recently published by Magis-Escurra et al. (21), there are three differences. First, their OSS was deliberately limited to time points of up to 6 h postdose, and ours was not. Obviously, their proposed OSS of 1, 4, and 6 h for rifampin administration times is more feasible in daily practice than ours. In our OSS, these time points were not selected as the best-performing OSS; thus, they result in a less accurate and precise prediction of the AUC values (21). The second difference is that the model presented here was developed using a larger and more heterogeneous population. The population consisted of both fasted and fed patients, making our model more widely applicable for daily practice. Third, Magis-Escurra et al. used multiple linear regression analysis to derive their OSS, whereas we used a Bayesian approach in the current analysis. Both strategies have advantages and disadvantages. The distinct advantage of our Bayesian approach is that it is more flexible, allowing for deviations from the exact sampling times at 1, 3, and 8 h (39). But this requires use of our model and software, whereas multiple linear regression analysis yields a straightforward equation to fill in.
Recently, Medellín-Garibay et al. published an OSS for analysis of rifampin levels at 2, 4, and 12 h postdose (16). This is less practical than the one presented here. The choice of those time points may have been a consequence of their low elimination rate constant and long half-life of 5.1 h, which are quite different from those in the literature (6, 13).
Conclusions.
A one-compartmental population pharmacokinetic rifampin model was developed in order to estimate the effective pharmacokinetic/pharmacodynamic parameters of rifampin AUC values in tuberculosis patients. With an optimal sampling strategy with sampling points at 1, 3, and 8 h, the model is able to predict AUC0–24 values with acceptable accuracy and precision.
ACKNOWLEDGMENT
We thank A. Yahoo for his initial work on the rifampin model.
REFERENCES
- 1.WHO. 2014. Global tuberculosis report. WHO, Geneva, Switzerland. [Google Scholar]
- 2.World Health Organization. 2010. Treatment of tuberculosis guidelines, 4th edition WHO, Geneva, Switzerland. [PubMed] [Google Scholar]
- 3.Blumberg HM, Burman WJ, Chaisson RE, Daley CL, Etkind SC, Friedman LN, Fujiwara P, Grzemska M, Hopewell PC, Iseman MD, Jasmer RM, Koppaka V, Menzies RI, O'Brien RJ, Reves RR, Reichman LB, Simone PM, Starke JR, Vernon AA. 2003. American Thoracic Society/Centers for Disease Control and Prevention/Infectious Diseases Society of America: treatment of tuberculosis. Am J Respir Crit Care Med 167:603–662. doi: 10.1164/rccm.167.4.603. [DOI] [PubMed] [Google Scholar]
- 4.Pasipanodya JG, McIlleron H, Burger A, Wash PA, Smith P, Gumbo T. 2013. Serum drug concentrations predictive of pulmonary tuberculosis outcomes. J Infect Dis 208:1464–1473. doi: 10.1093/infdis/jit352. [DOI] [PMC free article] [PubMed] [Google Scholar]
- 5.Srivastava S, Pasipanodya JG, Meek C, Leff R, Gumbo T. 2011. Multidrug-resistant tuberculosis not due to noncompliance but to between-patient pharmacokinetic variability. J Infect Dis 204:1951–1959. doi: 10.1093/infdis/jir658. [DOI] [PMC free article] [PubMed] [Google Scholar]
- 6.Gumbo T, Louie A, Deziel MR, Liu W, Parsons LM, Salfinger M, Drusano GL. 2007. Concentration-dependent Mycobacterium tuberculosis killing and prevention of resistance by rifampin. Antimicrob Agents Chemother 51:3781–3788. doi: 10.1128/AAC.01533-06. [DOI] [PMC free article] [PubMed] [Google Scholar]
- 7.Jayaram R, Gaonkar S, Kaur P, Suresh BL, Mahesh BN, Jayashree R, Nandi V, Bharat S, Shandil RK, Kantharaj E, Balasubramanian V. 2003. Pharmacokinetics-pharmacodynamics of rifampin in an aerosol infection model of tuberculosis. Antimicrob Agents Chemother 47:2118–2124. doi: 10.1128/AAC.47.7.2118-2124.2003. [DOI] [PMC free article] [PubMed] [Google Scholar]
- 8.Becker C, Dressman JB, Junginger HE, Kopp S, Midha KK, Shah VP, Stavchansky S, Barends DM. 2009. Biowaiver monographs for immediate release solid oral dosage forms: rifampicin. J Pharm Sci 98:2252–2267. doi: 10.1002/jps.21624. [DOI] [PubMed] [Google Scholar]
- 9.Smythe W, Khandelwal A, Merle C, Rustomjee R, Gninafon M, Lo MB, Sow OB, Olliaro PL, Lienhardt C, Horton J, Smith P, McIlleron H, Simonsson US. 2012. A semimechanistic pharmacokinetic-enzyme turnover model for rifampin autoinduction in adult tuberculosis patients. Antimicrob Agents Chemother 56:2091–2098. doi: 10.1128/AAC.05792-11. [DOI] [PMC free article] [PubMed] [Google Scholar]
- 10.Wilkins JJ, Savic RM, Karlsson MO, Langdon G, McIlleron H, Pillai G, Smith PJ, Simonsson US. 2008. Population pharmacokinetics of rifampin in pulmonary tuberculosis patients, including a semimechanistic model to describe variable absorption. Antimicrob Agents Chemother 52:2138–2148. doi: 10.1128/AAC.00461-07. [DOI] [PMC free article] [PubMed] [Google Scholar]
- 11.Peloquin CA, Jaresko GS, Yong CL, Keung AC, Bulpitt AE, Jelliffe RW. 1997. Population pharmacokinetic modeling of isoniazid, rifampin, and pyrazinamide. Antimicrob Agents Chemother 41:2670–2679. [DOI] [PMC free article] [PubMed] [Google Scholar]
- 12.Ruslami R, Nijland HM, Alisjahbana B, Parwati I, van Crevel R, Aarnoutse RE. 2007. Pharmacokinetics and tolerability of a higher rifampin dose versus the standard dose in pulmonary tuberculosis patients. Antimicrob Agents Chemother 51:2546–2551. doi: 10.1128/AAC.01550-06. [DOI] [PMC free article] [PubMed] [Google Scholar]
- 13.Peloquin CA. 2002. Therapeutic drug monitoring in the treatment of tuberculosis. Drugs 62:2169–2183. doi: 10.2165/00003495-200262150-00001. [DOI] [PubMed] [Google Scholar]
- 14.Ray J, Gardiner I, Marriott D. 2003. Managing antituberculosis drug therapy by therapeutic drug monitoring of rifampicin and isoniazid. Intern Med J 33:229–234. doi: 10.1046/j.1445-5994.2003.00390.x. [DOI] [PubMed] [Google Scholar]
- 15.Magis-Escurra C, van den Boogaard J, IJdema D, Boeree M, Aarnoutse R. 2012. Therapeutic drug monitoring in the treatment of tuberculosis patients. Pulm Pharmacol Ther 25:83–86. doi: 10.1016/j.pupt.2011.12.001. [DOI] [PubMed] [Google Scholar]
- 16.Medellín-Garibay SE, Correa-López T, Romero-Méndez C, Milán-Segovia RC, Romano-Moreno S. 2014. Limited sampling strategies to predict the area under the concentration-time curve for rifampicin. Ther Drug Monit 36:746–751. doi: 10.1097/FTD.0000000000000093. [DOI] [PubMed] [Google Scholar]
- 17.Prahl JB, Johansen IS, Cohen AS, Frimodt-Moller N, Andersen AB. 2014. Clinical significance of 2 h plasma concentrations of first-line anti-tuberculosis drugs: a prospective observational study. J Antimicrob Chemother 69:2841–2847. doi: 10.1093/jac/dku210. [DOI] [PubMed] [Google Scholar]
- 18.Sturkenboom MG, Akkerman OW, Bolhuis MS, de Lange WC, van der Werf TS, Alffenaar JW. 2015. Adequate design of pharmacokinetic-pharmacodynamic studies will help optimize tuberculosis treatment for the future. Antimicrob Agents Chemother 59:2474. doi: 10.1128/AAC.05173-14. [DOI] [PMC free article] [PubMed] [Google Scholar]
- 19.Alffenaar JW, Kosterink JG, van Altena R, van der Werf TS, Uges DR, Proost JH. 2010. Limited sampling strategies for therapeutic drug monitoring of linezolid in patients with multidrug-resistant tuberculosis. Ther Drug Monit 32:97–101. doi: 10.1097/FTD.0b013e3181cc6d6f. [DOI] [PubMed] [Google Scholar]
- 20.Pranger AD, Kosterink JG, van Altena R, Aarnoutse RE, van der Werf TS, Uges DR, Alffenaar JW. 2011. Limited-sampling strategies for therapeutic drug monitoring of moxifloxacin in patients with tuberculosis. Ther Drug Monit 33:350–354. doi: 10.1097/FTD.0b013e31821b793c. [DOI] [PubMed] [Google Scholar]
- 21.Magis-Escurra C, Later-Nijland HM, Alffenaar JW, Broeders J, Burger DM, van Crevel R, Boeree MJ, Donders AR, van Altena R, van der Werf TS, Aarnoutse RE. 2014. Population pharmacokinetics and limited sampling strategy for first-line tuberculosis drugs and moxifloxacin. Int J Antimicrob Agents 44:229–234. doi: 10.1016/j.ijantimicag.2014.04.019. [DOI] [PubMed] [Google Scholar]
- 22.Aarnoutse RE, Sturkenboom MG, Robijns K, Harteveld AR, Greijdanus B, Uges DR, Touw DJ, Alffenaar JW. 16 April 2015, posting date An interlaboratory quality control programme for the measurement of tuberculosis drugs. Eur Respir J doi: 10.1183/09031936.00177014. [DOI] [PubMed] [Google Scholar]
- 23.de Velde F, Alffenaar JW, Wessels AM, Greijdanus B, Uges DR. 2009. Simultaneous determination of clarithromycin, rifampicin and their main metabolites in human plasma by liquid chromatography-tandem mass spectrometry. J Chromatogr B Analyt Technol Biomed Life Sci 877:1771–1777. doi: 10.1016/j.jchromb.2009.04.038. [DOI] [PubMed] [Google Scholar]
- 24.Vu DH, Koster RA, Wessels AM, Greijdanus B, Alffenaar JW, Uges DR. 2013. Troubleshooting carry-over of LC-MS/MS method for rifampicin, clarithromycin and metabolites in human plasma. J Chromatogr B Analyt Technol Biomed Life Sci 917–918:1–4. doi: 10.1016/j.jchromb.2012.12.023. [DOI] [PubMed] [Google Scholar]
- 25.Nijland HM, Ruslami R, Suroto AJ, Burger DM, Alisjahbana B, van Crevel R, Aarnoutse RE. 2007. Rifampicin reduces plasma concentrations of moxifloxacin in patients with tuberculosis. Clin Infect Dis 45:1001–1007. doi: 10.1086/521894. [DOI] [PubMed] [Google Scholar]
- 26.Acocella G. 1983. Pharmacokinetics and metabolism of rifampin in humans. Rev Infect Dis 5(Suppl 3):S428–S432. doi: 10.1093/clinids/5.Supplement_3.S428. [DOI] [PubMed] [Google Scholar]
- 27.Acocella G, Mattiussi R, Segre G. 1978. Multicompartmental analysis of serum, urine and bile concentrations of rifampicin and desacetyl-rifampicin in subjects treated for one week. Pharmacol Res Commun 10:271–288. doi: 10.1016/S0031-6989(78)80021-6. [DOI] [PubMed] [Google Scholar]
- 28.Launay-Vacher V, Izzedine H, Deray G. 2005. Pharmacokinetic considerations in the treatment of tuberculosis in patients with renal failure. Clin Pharmacokinet 44:221–235. doi: 10.2165/00003088-200544030-00001. [DOI] [PubMed] [Google Scholar]
- 29.Ellard GA, Fourie PB. 1999. Rifampicin bioavailability: a review of its pharmacology and the chemotherapeutic necessity for ensuring optimal absorption. Int J Tuberc Lung Dis 3:S301–S308; discussion S317–S321. [PubMed] [Google Scholar]
- 30.Aventis Pharma Limited. 2013. Summary of product characteristics—Rifadin. Aventis Pharma Limited, Guildford, Surrey, United Kingdom. [Google Scholar]
- 31.Pähkla R, Lambert J, Ansko P, Winstanley P, Davies PD, Kiivet RA. 1999. Comparative bioavailability of three different preparations of rifampicin. J Clin Pharm Ther 24:219–225. doi: 10.1046/j.1365-2710.1999.00223.x. [DOI] [PubMed] [Google Scholar]
- 32.Milán Segovia RC, Domínguez Ramírez AM, Jung Cook H, Magaña Aquino M, Vigna Pérez M, Brundage RC, Romano Moreno S. 2013. Population pharmacokinetics of rifampicin in Mexican patients with tuberculosis. J Clin Pharm Ther 38:56–61. doi: 10.1111/jcpt.12016. [DOI] [PubMed] [Google Scholar]
- 33.Proost JH, Eleveld DJ. 2006. Performance of an iterative two-stage Bayesian technique for population pharmacokinetic analysis of rich data sets. Pharm Res 23:2748–2759. doi: 10.1007/s11095-006-9116-0. [DOI] [PubMed] [Google Scholar]
- 34.Altman DG, Royston P. 2000. What do we mean by validating a prognostic model? Stat Med 19:453–473. doi:. [DOI] [PubMed] [Google Scholar]
- 35.Lin MY, Lin SJ, Chan LC, Lu YC. 2010. Impact of food and antacids on the pharmacokinetics of anti-tuberculosis drugs: systematic review and meta-analysis. Int J Tuberc Lung Dis 14:806–818. [PubMed] [Google Scholar]
- 36.Lin HC, Yu MC, Liu HJ, Bai KJ. 2014. Impact of food intake on the pharmacokinetics of first-line antituberculosis drugs in Taiwanese tuberculosis patients. J Formos Med Assoc 113:291–297. doi: 10.1016/j.jfma.2014.01.015. [DOI] [PubMed] [Google Scholar]
- 37.van Ingen J, Aarnoutse RE, Donald PR, Diacon AH, Dawson R, Plemper van Balen G, Gillespie SH, Boeree MJ. 2011. Why do we use 600 mg of rifampicin in tuberculosis treatment? Clin Infect Dis 52:e194–9. doi: 10.1093/cid/cir184. [DOI] [PubMed] [Google Scholar]
- 38.Daskapan A, de Lange WC, Akkerman OW, Kosterink JGW, van der Werf TS, Stienstra Y, Alffenaar JW. 2015. The role of therapeutic drug monitoring in individualised drug dosage and exposure measurement in tuberculosis and HIV co-infection. Eur Respir J 45:569–571. doi: 10.1183/09031936.00142614. [DOI] [PubMed] [Google Scholar]
- 39.Ting LSL, Villeneuve E, Ensom MHH. 2006. Beyond cyclosporine: a systematic review of limited sampling strategies for other immunosuppressants. Ther Drug Monit 28:419–430. doi: 10.1097/01.ftd.0000211810.19935.44. [DOI] [PubMed] [Google Scholar]