Abstract
We evaluated the inhibitory effect of Pueraria lobata root ethanol extract (PLREE) on lipid accumulation during 3T3-L1 differentiation to adipocytes by measuring the intracellular expression of adipogenic, lipogenic, and lipolytic markers and lipid accumulation. The total polyphenol and flavonoid content of PLREE were 47 and 29 mg/g, respectively. The electron donating capacity of PLREE at 1,000 μg/mL was 48.8%. Treatment of 3T3-L1 preadipocytes with 100, 250, or 500 μg/mL PLREE for 8 days dose-dependently promoted the differentiation of 3T3-L1 cells. In contrast, the lipid content of PLREE-treated cells was significantly reduced by 7.8% (p < 0.05), 35.6% (p < 0.001), and 42.2% (p < 0.001) following treatment with 100, 250, and 500 μg/mL PLREE, respectively, as compared to differentiated control cells. PLREE upregulated peroxisome proliferator-activated receptor γ mRNA and protein, and sterol regulator element-binding protein-1c mRNA levels, but did not affect CCAAT/enhancer binding-protein β and α mRNA levels. PLREE also downregulated acetyl-CoA carboxylase mRNA and protein, fatty acid synthase (FAS) protein, and leptin mRNA levels, but did not affect FAS mRNA expression. PLREE upregulated adipose triglyceride lipase mRNA and protein expression, and hormone-sensitive lipase (HSL) protein expression, but did not affect HSL mRNA expression. In conclusion, we found that PLREE enhanced adipogenesis, but reduced lipogenesis, resulting in decreased lipid accumulation in 3T3-L1 cells.
Keywords: Adipogenesis, Lipid accumulation, Lipogenesis, 3T3-L1 preadipocytes, Pueraria lobata root ethanol extract
INTRODUCTION
UV radiation decreases the synthesis of free fatty acids (FFAs) and triglycerides (TGs) in the epidermis of human skin, contributing to the occurrence of skin photoaging (1). Sun exposure can also lead to subcutaneous (SC) fat loss through the inhibition of preadipocyte differentiation into mature adipocytes and stimulation of lipolysis in mature adipocytes (2). Thus, SC fat may have an important role in the maintenance of good health (3).
The transcriptional control of adipogenesis is largely influenced by the activation of several families of transcription factors. During adipogenesis, these transcription factors are coordinately expressed in a network in which CCAAT/enhancer-binding protein β (C/EBPβ) and C/EBPδ are detected first, followed by peroxisome proliferator-activated receptor γ (PPARγ). PPARγ in turn activates C/EBPα, which exerts positive feedback on PPARγ to maintain the differentiated state. Sterol regulatory element binding protein-1 (SREBP-1) can activate PPARγ by inducing its expression and promoting the production of endogenous PPARγ ligands. Combined, these factors contribute to the expression of genes that characterize terminally differentiated adipocytes (4). Thus, the differentiation process is controlled by these key adipogenic transcriptional factors (5).
Adipogenesis is a multi-faceted process that includes preadipocyte proliferation, differentiation, and intracellular lipid accumulation, as well as changes in the expression level of various genes in the adipogenic pathway (6). One of the most well established and frequently applied systems for studying adipocyte differentiation is the 3T3-L1 cell line, derived from mouse embryonic fibroblast preadipocytes (7). In previous studies, isoflavones, such as puerarin, daidzein, and genistein, from Kudzu root (Pueraria lobata), were shown to have both adipogenic (8-10) and anti-adipogenic activity (7,11,12). Lipid accumulation reflects the process of differentiation, which is regulated by the increased expression of various transcription factors and adipogenesis-related genes (13). Thus, we analyzed the expression of these genes using semi-quantitative RT-PCR and western blotting to investigate the molecular mechanisms underlying P. lobata root ethanol extract (PLREE)-induced 3T3-L1 cell differentiation.
MATERIALS AND METHODS
Reagents and apparatus. Dimethyl sulfoxide (DMSO), 1,1-diphenyl-2-picryl hydrazyl (DPPH), tannic acid, ascorbic acid, Folin-Ciocalteu’s phenol reagent, 3-(4,5-dimethylthiazol-2-yl)-2,5-diphenyl-tetrazolium bromide (MTT), 3-isobutyl-1-methylxanthine (IBMX), insulin, dexamethasone, and Oil red O were purchased from Sigma-Aldrich (St. Louis, MO, USA). Dulbecco’s modified Eagle’s medium (DMEM), fetal bovine serum (FBS), and penicillin/streptomycin (P/S) were purchased from Lonza Company (Cascade, MD, USA). PPARγ (catalogue #2435), acetyl-CoA carboxylase (ACC, catalogue #3662), fatty acid synthase (FAS, catalogue #3180), adipose triglyceride lipase (ATGL, catalogue #2138), and hormone-sensitive lipase (HSL, catalogue #4107) antibodies were purchased from Cell Signaling Technology (Danvers, MA, USA) and β-actin (catalogue sc-47778) antibody was purchased from Santa Cruz Biotechnology (Santa Cruz, CA, USA). Daidzein (> 95%) and genistein (> 95%) were purchased from Extrasynthese (Lyon, France), and puerarin (> 95%) was purchased from the Ministry of Food and Drug Safety (Cheongju, Korea). All reagents used in this study were of analytical grade. An inverted microscope (CKX41, Olympus, Tokyo, Japan) was used to observe cell growth. A CO2 incubator (MCO-17AC, SANYO Electric, Osaka, Japan) was used for cell culture.
Preparation of P. lobata root ethanol extract (PLREE). P. lobata root (Kim-Cheon product, Taechang Pharmaceutical Co., Ltd., Seoul, Korea) was purchased from Yakryeong market (Daegu, Korea). Pulverized samples (100 g) were put in a flask and extracted in 1,000 mL 80% ethanol 3 times for 24 hr each at 25℃. The extract was filtered with filter paper and concentrated using a rotary vacuum evaporator followed by lyophilization (yield 27.5%).
Ultra-performance liquid chromatography (UPLC) measurements. Measurements were carried out on a Waters UPLC (Acquity UPLC®, Waters, MA, USA) equipped with a Waters BEH C18 column (1.7 μm, 2.1 mm × 100 mm) and a guard column at the Research Center for Biomedical Resources of Korean Medicine of Daegu Hanny University (Daegu, Korea). Lyophilized PLREE (0.2 g) and 100% methanol (10 mL) were put in a Falcon tube and sonicated for 1 hr using an ultrasonic cleaner (Power Sonic 405, Hwashin Technology Co., Daegu, Korea), followed by filtration with a membrane syringe filter (PTFE, 13 mm, 0.2 μm, Dong-il Shimadzu Spechrom, Korea). The temperature was set at 35℃, the injection volume was 2 μL, and the detection wave length of the photodiode array (PDA) detector was set to 254 nm. Binary elution at a flow rate of 0.3 mL/min was employed using an aqueous phase of 0.1% formic acid in deionized water as solvent A and 0.1% formic acid in acetonitrile as solvent B, as follows: 10% B at 0~5 min, 10~30% at 5~8 min, 30~40% at 8~10 min, 40~50% at 10~12 min, 50~10% at 12~14 min, and 10% at 14~16 min. The chromatograms were documented by Waters Empower 2 Chromatography Data Software (Waters).
Antioxidant activity. The Folin-Denis assay (14) was performed to determine the total polyphenol content of PLREE. PLREE (1 mL) and Folin reagent (1 mL) were placed in a test tube and allowed to stand for 3 min, before adding 10% Na2CO3 (1 mL) and shaking vigorously. The tubes were incubated for 1 hr at room temperature before measuring the absorbance at 725 nm. A standard curve was prepared using tannic acid. The total flavonoid content of PLREE was determined by a modified Davies method (15). PLREE (100 μL) was placed in a test tube before adding 1 mL diethylene glycol reagent and 100 μL 1 N NaOH. The mixture was shaken vigorously and incubated at 37℃ for 1 hr before measuring the absorbance at 420 nm. A standard curve was prepared using rutin. The electron donating ability was evaluated as previously described (16). PLREE (1 mL) dissolved in distilled water at concentrations of 250, 500, or 1,000 μg/mL was placed in a test tube before adding 0.4 mM DPPH (4 mL). The mixture was shaken vigorously and incubated for 10 sec at 60℃ before measuring the absorbance at 525 nm. Ascorbic acid was used as a positive control. The DPPH radical scavenging activity of each solution was calculated as the percent inhibition with the following equation:
% donating ability = [1 − (Asample/Acontrol)] × 00
where Acontrol is the absorbance of the control (reagents without test compounds).
Cell culture and sample treatment. 3T3-L1 preadipocytes, which were obtained from Professor Byeong Churl Jang (Keimyung University, Daegu, Korea), were cultured and differentiated as described by Fasshauer et al. (17). Briefly, the cells were cultured at 37℃ in a humidified 5% CO2 atmosphere and grown in DMEM with 10% bovine calf serum (BCS) and 5% P/S (BCS/DMEM) medium. After inducing confluence for 2 days, preadipocytes were cultured in DMEM with 10% FBS and 5% P/S (FBS/DMEM) medium, supplemented with 0.5 mM IBMX, 1 μM DEX (MDI), and 10 μg/mL insulin for 2 days. The cell culture medium was replaced with DMEM containing 10 μg/mL insulin, and incubation was continued for another 3 days. The cells were then maintained in DMEM with medium changes every 2 days. To examine the effect of PLREE on adipocyte differentiation, 3T3-L1 preadipocytes were cultured with MDI in the presence or absence of PLREE at the indicated concentrations. Differentiation, as measured by the expression of adipogenic markers and the appearance of lipid droplets, was completed on day 8.
Cell viability assay. The effect of PLREE on 3T3-L1 preadipocyte viability was assessed by the MTT assay to determine the maximum permissible level (MPL). 3T3-L1 preadipocytes were seeded in a 96-well plate (1.5 × 10⁴ cells/well) and incubated in a humidified 5% CO2 atmosphere at 37℃ for 24 hr. PLREE (200 μL) diluted with DMEM to concentrations of 0~1,000 μg/mL was added to the wells, and the plate was incubated for an additional 48 hr. MTT (0.5 μg/mL) reagent was then added to each well, and the cells were further incubated for 3 hr. After centrifugation at 180 × g for 10 min, the medium was removed, and 200 μL DMSO was added for 15 min with shaking to resuspend the cells. Cell viability was assessed by absorbance at 540 nm using an ELISA reader (680, Bio-Rad, Tokyo, Japan).
Oil red O staining. On day 8, 3T3-L1 cells were washed twice with PBS and fixed with 10% (v/v) fresh formalin for 2 hr. Cells were stained with Oil red O working solution for 1 hr. After the staining solution was removed, stained lipid droplets in 3T3-L1 cells were washed four times with distilled water. For the quantification of Oil red O uptake, cells were incubated with 1 mL isopropanol per well for 10 min. After incubation, the soluble reactant was transferred to a 96-well plate, and absorbance was measured at 490 nm using a multi-well plate reader (Model 680, Biorad, Hercules, CA, USA).
Reverse transcription-polymerase chain reaction (RT-PCR). Total RNA was extracted from 3T3-L1 cells treated with PLREE for 8 days using TRIzol reagent (Life Technologies, Carlsbad, CA, USA) according to the manufacturer’s instructions. Equal amounts of total RNA (5 μg) were reverse transcribed in a 40 μL reaction mixture containing 8 μL Molony murine leukemia virus reverse transcriptase (MMLV RT) 5 × buffer, 10 mM dNTPs (3 μL), 40 U/μL RNase inhibitor (0.45 μL), 200 U/μL M-MLV RT (0.3 μL, Promega, Madison, WI, USA), and 20 μM oligo dT (3.75 μL, Bioneer, Daejeon, Korea). Single-stranded cDNA was then used as a template for PCR amplification reactions containing 4 μL of 5 × green Go Taq Flexi buffer, 10 mM dNTPs (0.4 μL), 5 U/μL Taq polymerase (0.1 μL), 25 mM MgCl2 (1.2 μL, Promega), and 0.4 μL each primer (20 μM). The primer sequences and PCR conditions are shown in Tables 1 and 2, respectively. PCR products were visualized after ethidium bromide staining on a 1.2% agarose gel. The DNA band density was semi-quantitatively analyzed using the KODAK Gel Logic 100 image analysis system (Eastman Kodak Co., Rochester, NY, USA). The relative mRNA expression level of target genes was calculated by normalization with that of GAPDH as an internal control.
Table 1. Primer sequences for target genes used in 3T3-L1 cells for PCR.
| Genes | Primers | Expected size (bp)1) |
|---|---|---|
|
| ||
| SREBP-1c | Forward (5'→3') GCG CTA CCG GTC TTC TAT CA | 234 |
| Reverse (5'→3') TGC TGC CAA AAG ACA AGG G | ||
| C/EBPβ | Forward (5'→3') GAC TAC GCA ACA CAC GTG TAA CT | 488 |
| Reverse (5' →3') CAA AAC CAA AAA CAT CAA CAA CCC | ||
| PPARγ | Forward (5'→3') GGT GAA ACT CTG GGA GAT TC | 268 |
| Reverse (5' →3') CAA CCA TTG GGT CAG CTC TC | ||
| C/EBPα | Forward (5'→3') TTA CAA CAG GCC AGG TTT CC | 232 |
| Reverse (5'→3') CTC TGG GAT GGA TCG ATT GT | ||
| ACC | Forward (5'→3') TGA CCG TGG GCA CAA AGT T | 351 |
| Reverse (5'→3') AGG AGG AAC CGC ATT TAT CGA | ||
| FAS | Forward (5'→3') GGT TCG GAA TGC TAT CCA GG | 301 |
| Reverse (5'→3') CTG CGG AAA CTT CAG GAA AT | ||
| Leptin | Forward (5'→3') CCA AAA CCC TCA TCA AGA CC | 352 |
| Reverse (5'→3') CTC AAA GCC ACC ACC TCT GT | ||
| ATGL | Forward (5'→3') TTC ACC ATC CGC TTG TTG | 155 |
| Reverse (5'→3') AGT TCC ACC TGC TCA GAC | ||
| HSL | Forward (5'→3') GTC GCC TTT CTC CTG ATG AC | 410 |
| Reverse (5'→3') CTT GCT GCT TCT CTT GGC TC | ||
| GAPDH | Forward (5'→3') GTA TGA CTC CAC TCA CGG CAA A | 248 |
| Reverse (5'→3') GGT CTC GCT CCT GGA AGA TG | ||
1)bp: basepair.
Table 2. PCR conditions for target genes in 3T3-L1 cells.
| Genes | Items | Temperature | Time | Cycles |
|---|---|---|---|---|
|
| ||||
| SREBP-1c | Predenaturation | 95℃ | 10 min | 1 |
| Denaturation | 95℃ | 1 min | 30 | |
| Annealing | 54℃ | 1 min | ||
| Extension | 72℃ | 1 min | ||
| Post extension | 72℃ | 10 min | 1 | |
| C/EBPβ | Predenaturation | 95℃ | 10 min | 1 |
| Denaturation | 94℃ | 30 sec | 30 | |
| Annealing | 53℃ | 30 sec | ||
| Extension | 72℃ | 30 sec | ||
| Post extension | 72℃ | 7 min | 1 | |
| PPARγ | Predenaturation | 95℃ | 10 min | 1 |
| Denaturation | 94℃ | 30 sec | 30 | |
| Annealing | 53℃ | 30 sec | ||
| Extension | 72℃ | 30 sec | ||
| Post extension | 72℃ | 7 min | 1 | |
| C/EBPα | Predenaturation | 94℃ | 10 min | 1 |
| Denaturation | 94℃ | 30 sec | 30 | |
| Annealing | 62℃ | 30 sec | ||
| Extension | 72℃ | 30 sec | ||
| Post extension | 72℃ | 7 min | 1 | |
| ACC FAS | Predenaturation | 94℃ | 5 min | 1 |
| Denaturation | 94℃ | 30 sec | 30 | |
| Annealing | 56℃ | 1 min | ||
| Extension | 72℃ | 1 min | ||
| Post extension | 72℃ | 5 min | 1 | |
| Leptin | Predenaturation | 94℃ | 1 min | 1 |
| Denaturation | 94℃ | 1 min | 33 | |
| Annealing | 57℃ | 1 min | ||
| Extension | 72℃ | 2 min | ||
| Post extension | 72℃ | 7 min | 1 | |
| ATGL HSL | Predenaturation | 94℃ | 5 min | 1 |
| Denaturation | 94℃ | 45 sec | 29 | |
| Annealing | 53℃ | 45 sec | ||
| Extension | 72℃ | 90 sec | ||
| Post extension | 72℃ | 5 min | 1 | |
Western blot analysis. 3T3-L1 cells treated with PLREE for 8 days in 60-mm cell culture dishes were washed with cold PBS, harvested using a cell scraper, lysed with lysis buffer containing 1 × RIPA (Sigma-Aldrich), 2 mM phenylmethylsulfonyl fluoride (PMSF), 1 mM Na3VO4, 1 mM NaF, 1 mM glycerol 2-phosphate disodium salt hydrate (G), and 1 × protease inhibitor (PI), followed by incubation on ice for 10 min. Cell lysates were centrifuged at 18,000 × g for 20 min at 4℃, and protein content in the resultant supernatants was measured using the BSA Protein Assay Reagent Kit (Biorad). Equal amounts of protein (30 μg) were separated by electrophoresis in a 10% polyacrylamide gel, transferred onto nitrocellulose membrane, and incubated with specific antibodies against PPARγ (1:1,000), ACC (1:1,000), FAS (1:1,000), ATGL (1:1,000), or HSL (1:1,000). The membrane was then incubated with anti-rabbit IgG (1:1,000). Immunoreactive bands were detected using ECL western blotting detection reagents (Biorad). Band intensity was semi-quantified using the Image J program (NIH, Bethesda, MD, USA) and β-actin was used as an internal control.
Statistical analysis. Data are presented as the mean ± SD. Significance was analyzed by Student’s t-test, using SPSS 21.0 for Windows (IBM, Armonk, NY, USA). Differences between experimental groups were considered to be significant when p < 0.05.
RESULTS
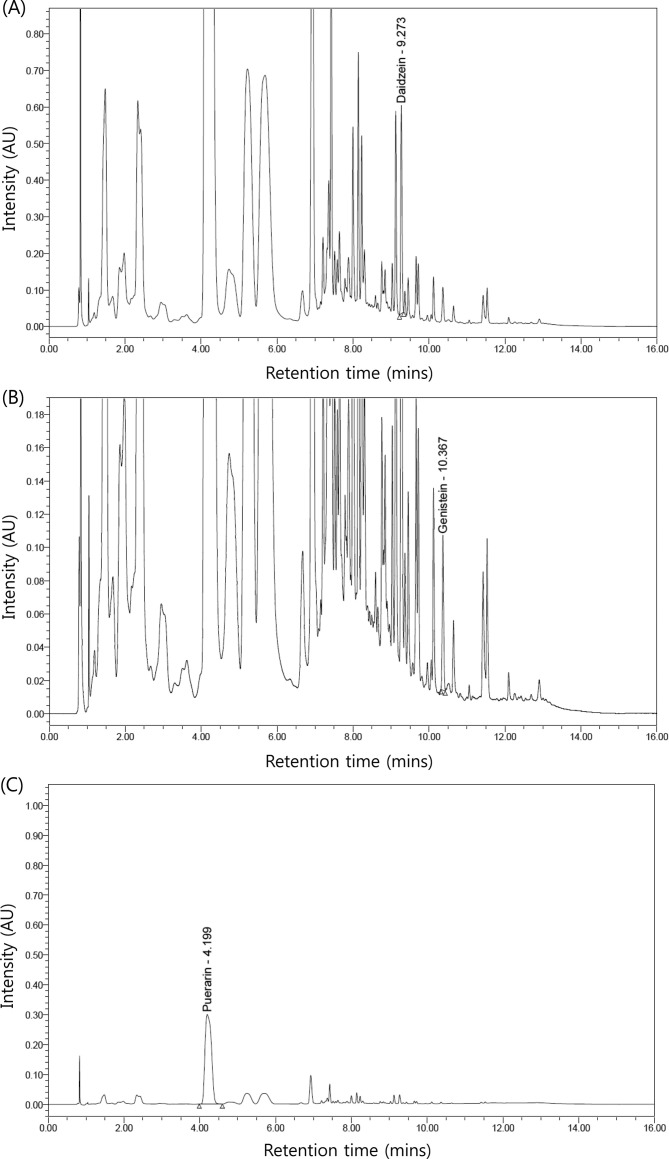
Daidzein, genistein and puerarin content of PLREE. PLREE contained 1.77 mg/g daidzein, 0.26 mg/g genistein, and 148.44 mg/g puerarin (Fig. 1).
Fig. 1. UPLC chromatograms of Pueraria lobata root ethanol extract (PLREE). (A) daidzein, (B) genistein, (C) puerarin.
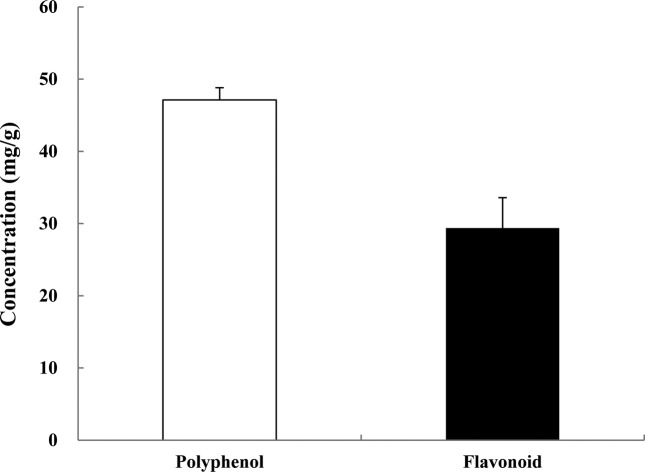
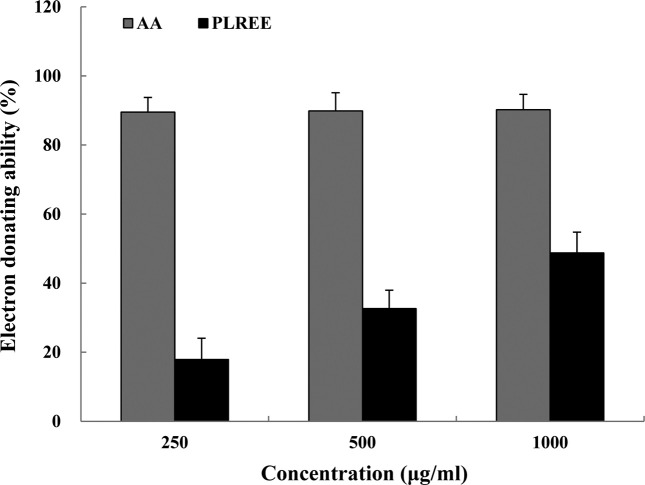
Antioxidant activity of PLREE. The total polyphenol content of PLREE was 47 mg/g, as determined using the tannic acid standard curve (Fig. 2). The total flavonoid content of PLREE was 29 mg/g, as determined by the rutin standard curve (Fig. 2). The electron donating ability of ascorbic acid and PLREE at 1,000 μg/mL was 90.2% and 48.8%, respectively (Fig. 3). The electron donating ability of PLREE was relatively lower than ascorbic acid.
Fig. 2. Total polyphenol and flavonoid content of PLREE. Values represent the mean ± SD of three independent measurements.
Fig. 3. Electron donating ability of PLREE and ascorbic acid. Each substance was evaluated on its ability to provide electrons to the free radical DPPH. Values represent the mean ± SD of three independent measurements. AA: ascorbic acid.
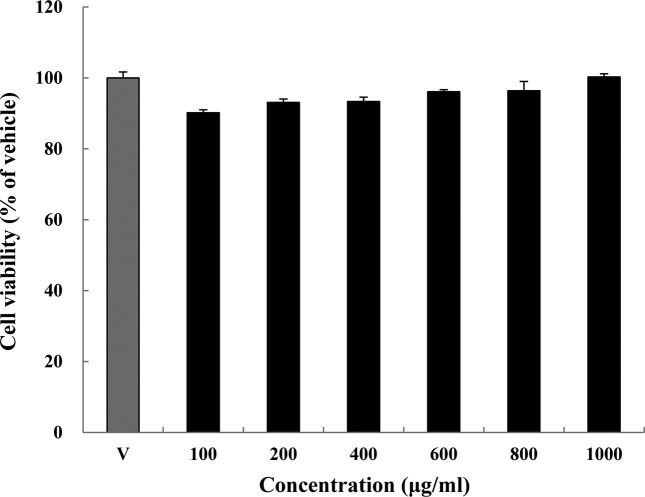
Effect of PLREE on 3T3-L1 preadipocyte viability. To examine PLREE-induced cytotoxicity, 3T3-L1 preadipocyte viability after exposure to 100~1,000 μg/mL PLREE for 48 hr was evaluated by MTT assay. Cells were still viable at all PLREE concentrations tested, as compared to vehicle-treated cells (Fig. 4). The maximum permissible level (MPL) of PLREE was over 1,000 μg/mL. Morphological observation of 3T3-L1 cells treated with 200~1,000 μg/mL PLREE using an inverted microscope did not show any morphological changes, as compared to vehicle-treated cells (figures not shown).
Fig. 4. Effect of PLREE on viability of 3T3-L1 preadipocytes. Viability of 3T3-L1 preadipocytes treated with PLREE (100~1,000 μg/mL) for 48 hr was analyzed by MTT assay. Values represent the mean ± SD of three independent measurements. V: vehicle.
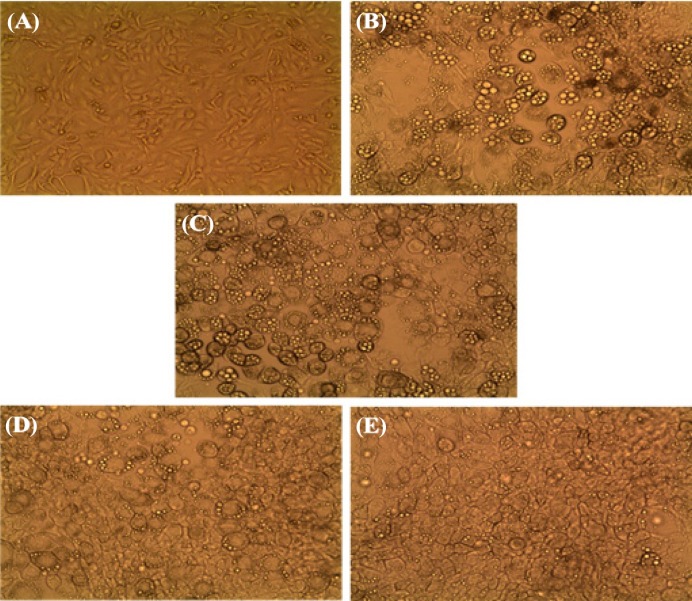
Effect of PLREE on lipid accumulation. To determine the potential effect of PLREE on adipogenesis, 3T3-L1 preadipocytes were grown to confluence, and differentiation was induced, with or without standard MDI hormonal inducers, in the absence or presence of PLREE (100, 250, or 500 μg/mL). On day 8, the degree of adipocyte differentiation was evaluated by microscopic observation (Fig. 5). Undifferentiated cells had spindle-like shapes and few lipid droplets, whereas differentiated control cells had a round shape and many lipid droplets. The PLREE-treated cells had fewer lipid droplets, as compared to differentiated control cells.
Fig. 5. Effect of PLREE on the differentiation of 3T3-L1 preadipocytes into adipocytes. 3T3-L1 preadipocytes were induced to differentiate in the presence of PLREE at 100 μg/mL (C), 250 μg/mL (D), and 500 μg/mL (E) for 8 days, and then microscopic images of the conditioned cells on day 8 were compared to undifferentiated normal cells (A) and differentiated control cells (B). 200× magnification.
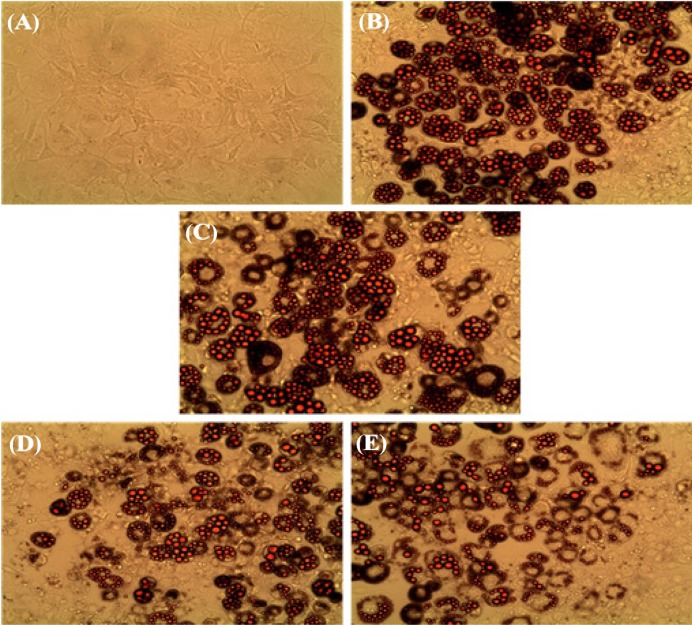
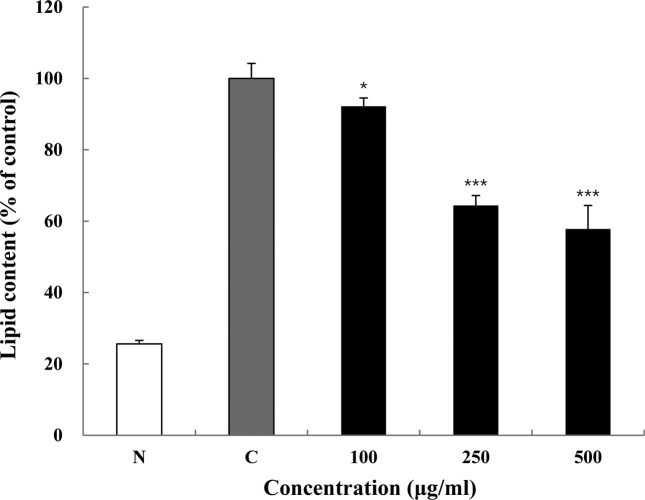
On day 8, the degree of lipid accumulation was assessed by Oil red O staining and imaging (Fig. 6). Undifferentiated cells displayed little lipid accumulation, whereas differentiated control cells were observed with many lipid droplets. However, PLREE-treatment dose-dependently reduced lipid droplets, as compared to differentiated control cells. Quantitative analysis revealed that the lipid content of PLREE-treated cells was significantly and dosedependently reduced at 100, 250, and 500 μg/mL by 7.8% (p < 0.05), 35.6% (p < 0.001), and 42.2% (p < 0.001), respectively (Fig. 7).
Fig. 6. Effect of PLREE on lipid accumulation during the differentiation of 3T3-L1 preadipocytes into adipocytes. 3T3-L1 preadipocytes were treated with PLREE at 100 μg/mL (C), 250 μg/mL (D), and 500 μg/mL (E) for 8 days, and microscopic images of Oil red O-stained 3T3-L1 cells (day 8) were compared to undifferentiated normal cells (A) and differentiated control cells (B). 200× magnification.
Fig. 7. Effect of PLREE on lipid conversion during the differentiation of 3T3-L1 preadipocytes into adipocytes. 3T3-L1 preadipocytes were treated with PLREE for 8 days, and lipid content was quantified by extracting Oil red O dye in the cells by isopropanol and measuring OD at 490 nm. Values represent the mean ± SD of three independent measurements. *p<0.05, ***p < 0.001 compared to differentiated control cells. N: undifferentiated normal cells, C: differentiated control cells.
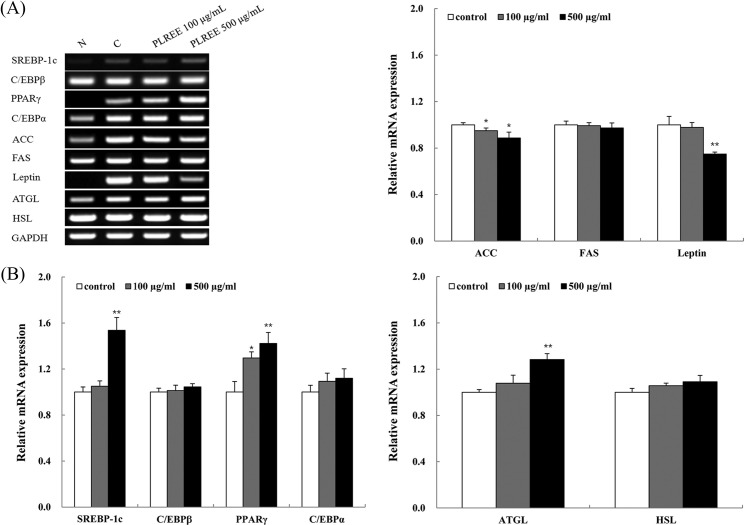
Effect of PLREE on mRNA expression of adipogenic, lipogenic, and lipolytic genes. Among adipogenic genes, PLREE remarkably upregulated SREBP-1c and PPARγ mRNA expression as compared to control cells, but did not affect C/EBPβ and C/EBPα at transcriptional levels. Among lipogenic genes, PLREE downregulated ACC and leptin mRNA expression, but had no effect on FAS mRNA expression. Among lipolytic genes, PLREE upregulated ATGL mRNA expression, but did not affect HSL mRNA expression (Fig. 8).
Fig. 8. Effect of PLREE on mRNA expression of adipogenic, lipogenic, and lipolytic genes during the differentiation of 3T3-L1 preadipocytes into adipocytes. (A) 3T3-L1 preadipocytes were treated with PLREE for 8 days, and mRNA levels of adipogenic, lipogenic, and lipolytic genes in 3T3-L1 cells (day 8) were analyzed by semi-quantitative RT-PCR. Expression was normalized to GAPDH levels. (B) Quantification of mRNA levels of adipogenic, lipogenic, and lipolytic genes. Values represent the mean ± SD of three independent measurements. *p < 0.05, **p < 0.01 compared to differentiated control cells. N: undifferentiated normal cells, C: differentiated control cells.
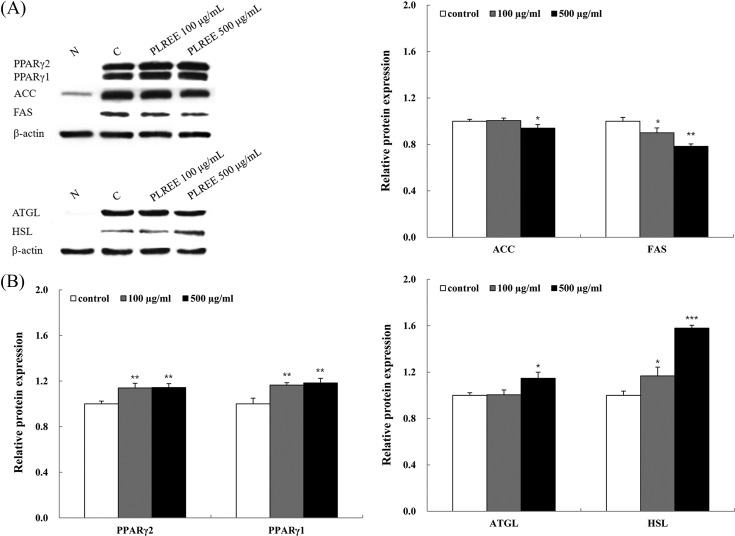
Effect of PLREE on PPARγ, ACC, FAS, ATGL, and HSL protein expression. Compared to control cells, PLREE upregulated PPARγ, ATGL, and HSL protein expression, whereas PLREE downregulated ACC and FAS protein expression (Fig. 9).
Fig. 9. Effect of PLREE on PPARγ, ACC, FAS, ATGL, and HSL protein expression during the differentiation of 3T3-L1 preadipocytes into adipocytes. (A) 3T3-L1 preadipocytes were treated with PLREE for 8 days, and protein levels of PPARγ, ACC, FAS, ATGL, and HSL in 3T3-L1 cells (day 8) were measured by western blotting. Expression was normalized to β-actin levels. (B) Quantification of protein levels of PPARγ, ACC, FAS, ATGL, and HSL genes. Values represent the mean ± SD of three independent measurements. *p<0.05, **p < 0.01, ***p< 0.001 compared to differentiated control cells. N: undifferentiated normal cells, C: differentiated control cells.
DISCUSSION
In the current study, PLREE upregulated the mRNA and protein expression of a key adipogenic transcription factor, PPARγ, during the differentiation of 3T3-L1 preadipocytes to adipocytes. In contrast, SREBP-1c, another adipogenic transcription factor, was only weakly upregulated by PLREE. Interestingly, C/EBPα mRNA expression was not affected by PLREE. In addition, no changes in C/EBPβ mRNA expression levels were observed in response to PLREE. Because C/EBPβ is an early adipogenic marker, this finding may be explained by the use of fully differentiated cells for mRNA expression analysis (18).
Adipogenic transcription factors coordinately regulate the expression of adipocyte-specific genes, including fatty acid synthase (FAS) and acetyl-CoA carboxylase (ACC) (5). ACC, a rate-limiting enzyme for fatty acid synthesis, catalyzes the first reaction step in fatty acid synthesis, promoting synthesis of long-chain fatty acids and reducing fatty acid oxidation (19). Moreover, inhibition of ACC has been shown to prevent the differentiation of 3T3-L1 cells (20). FAS catalyzes the synthesis of saturated fatty acids, predominately palmitate, from acetyl-CoA and malonyl-CoA precursors. This enzyme is highly expressed in the liver, adipose tissue, and lactating mammary glands (21). Malonyl-CoA generated by ACC1 is utilized by FAS for the synthesis of fatty acids in the cytosol, and ACC, FAS, and stearoyl-CoA desaturase 1 (SCD 1) play important roles in the development of hepatic steatosis and insulin resistance (22). In the current study, PLREE downregulated ACC mRNA and protein expression during the differentiation of 3T3-L1 cells. PLREE also downregulated FAS protein expression, but did not affect FAS mRNA expression. Thus, these results confirmed that PLREE enhanced adipogenesis but reduced lipogenesis in 3T3-L1 cells.
Lipolysis is the chemical decomposition and release of fat from adipose tissue. Lipolysis predominates over lipogenesis when additional energy is required (23). HSL and ATGL are two important rate-limiting enzymes for fat decomposition reactions (24,25). ATGL, the main lipase involved in the initial step of TG hydrolysis, functions to generate diglyceride (DG) and FFAs, after which HSL hydrolyzes DG (26). Recent studies have shown that ATGL and HSL act sequentially to catalyze the first two steps of adipose lipolysis in response to β-adrenergic stimulation (27). Moreover, lipolysis can be enhanced by increasing ATGL and HSL expression (28). In the current study, PLREE weakly upregulated ATGL mRNA and protein expression during the differentiation of 3T3-L1 preadipocytes into adipocytes. PLREE, however, did not affect HSL mRNA expression. Rather, it upregulated HSL protein expression. These finding may be explained by the observation that ATGL precedes HSL in adipose lipolysis (18). The final step of the lipolytic process is efflux of fatty acids and glycerol from adipocytes (29).
Relic et al. (8) reported that, as compared with cultures treated with genistein and rosiglitazone alone, the numbers of Oil red O-stained droplets in combined cultures are markedly increased, suggesting that genistein and rosiglitazone act synergistically on synovial adipogenesis through the PPARγ pathway. In this study, we examined the effects of PLREE on lipid accumulation using Oil red O staining and lipid quantification. From these analyses, we found that PLREE markedly reduced lipid accumulation during the differentiation of 3T3-L1 cells. Therefore, our results suggest that downregulation of ACC and/or FAS, and upregulation of ATGL and/or HSL ultimately resulted in the suppression of lipid accumulation in 3T3-L1 cells. Taxvig et al. (7) reported that genistein inhibits lipid accumulation in 3T3-L1 cells. However, they also found that a mixture of isoflavonoid parent compounds or a mixture of isoflavonoid metabolites could activate PPARγ. Because the activation of PPARγ is generally related to stimulation of adipocyte differentiation, they suggested that the inhibitory effect of genistein on lipid accumulation in 3T3-L1 cells is only partly dependent on PPARγ, and that other mechanisms may be involved. One possibility is that the effect of genistein could be mediated through the estrogen receptor (7). In the current study, we also found that PLREE reduced lipid accumulation during the differentiation of 3T3-L1 cells, but upregulated PPARγ. In previous studies, puerarin has been reported to enhance the differentiation of 3T3-L1 preadipocytes (10). Interestingly, genistein and daidzein have been reported to have both adipogenic and anti-adipogenic activities (7-9,11,12). In the current study, PLREE contained high amount of puerarin and some daidzein and zenistein.
In conclusion, the present study demonstrated that PLREE enhanced adipogenesis, but reduced lipogenesis, resulting in decreased lipid accumulation in 3T3-L1 cells. The potential adipogenic and anti-lipogenic activities of PLREE might be isoflavones including puerarin, daidzein, and genistein; however, which components act on stimulation of adipocyte differentiation and inhibition of lipid accumulation during the differentiation of 3T3-L1 preadipocytes into adipocytes need to be further investigated deeply.
References
- 1.Kim E.J., Jin X.J., Kim Y.K., Oh I.K., Kim J.E., Park C.H., Chung J.H. UV decreases the synthesis of free fatty acids and triglycerides in the epidermis of human skin in vivo, contributing to development of skin photoaging. J. Dermatol. Sci. (2010);57:19–26. doi: 10.1016/j.jdermsci.2009.10.008. [DOI] [PubMed] [Google Scholar]
- 2.Li W.H., Pappas A., Zhang L., Ruvolo E., Cavender D. IL-11, IL-1α, IL-6, and TNF-α are induced by solar radiation in vitro and may be involved in facial subcutaneous fat loss in vivo. J. Dermatol. Sci. (2013);71:58–66. doi: 10.1016/j.jdermsci.2013.03.009. [DOI] [PubMed] [Google Scholar]
- 3.Kim E.J., Kim Y.K., Kim J.E., Kim S., Kim M.K., Park C.H., Chung J.H. UV modulation of subcutaneous fat metabolism. J. Invest. Dermatol. (2011);131:1720–1726. doi: 10.1038/jid.2011.106. [DOI] [PubMed] [Google Scholar]
- 4.Rosen E.D., Walkey C.J., Puigserver P., Spiegelman B.M. Transcriptional regulation of adipogenesis. Genes Dev. (2000);14:1293–1307. [PubMed] [Google Scholar]
- 5.Kim M.B., Song Y., Kim C., Hwang J.K. Kirenol inhibits adipogenesis through activation of the Wnt/β-catenin signaling pathway in 3T3-L1 adipocytes. Biochem. Biophys. Res. Commun. (2014);445:433–438. doi: 10.1016/j.bbrc.2014.02.017. [DOI] [PubMed] [Google Scholar]
- 6.Lee H., Bae S., Yoon Y. The anti-adipogenic effects of (−) epigallocatechin gallate are dependent on the WNT/β-catenin pathway. J. Nutr. Biochem. (2013);24:1232–1240. doi: 10.1016/j.jnutbio.2012.09.007. [DOI] [PubMed] [Google Scholar]
- 7.Taxvig C., Specht I.O., Boberg J., Vinggaard A.M., Nellemann C. Dietary relevant mixtures of phytoestrogens inhibit adipocyte differentiation in vitro. Food Chem. Toxicol. (2013);55:265–271. doi: 10.1016/j.fct.2012.12.060. [DOI] [PubMed] [Google Scholar]
- 8.Relic B., Zeddou M., Desoroux A., Beguin Y., de Seny D., Malaise M.G. Genistein induces adipogenesis but inhibits leptin induction in human synovial fibroblasts. Lab. Invest. (2009);89:811–822. doi: 10.1038/labinvest.2009.41. [DOI] [PubMed] [Google Scholar]
- 9.Cho K.W., Lee O.H., Banz W.J., Moustaid-Moussa N., Shay N.F., Kim Y.C. Daidzein and the daidzein metabolite, equol, enhance adipocyte differentiation and PPAR gamma transcriptional activity. J. Nutr. Biochem. (2010);21:841–847. doi: 10.1016/j.jnutbio.2009.06.012. [DOI] [PubMed] [Google Scholar]
- 10.Lee O.H., Seo D.H., Park C.S., Kim Y.C. Puerarin enhances adipocyte differentiation, adiponectin expression, and antioxidant response in 3T3-L1 cells. Biofactors. (2010);36:459–467. doi: 10.1002/biof.119. [DOI] [PubMed] [Google Scholar]
- 11.Harmon A.W., Patel Y.M., Harp J.B. Genistein inhibits CCAAT/enhancer-binding protein beta (C/EBP beta) activity and 3T3-L1 adipogenesis by increasing C/EBP homologous protein expression. Biochem. J. (2002);367:203–208. doi: 10.1042/BJ20020300. [DOI] [PMC free article] [PubMed] [Google Scholar]
- 12.Park H.J., Della-Fera M.A., Hausman D.B., Rayalam S., Ambati S., Baile C.A. Genistein inhibits differentiation of primary human adipocytes. J. Nutr. Biochem. (2009);20:140–148. doi: 10.1016/j.jnutbio.2008.01.006. [DOI] [PubMed] [Google Scholar]
- 13.Rosen E.D., Spiegelman B.M. Adipocytes as regulators of energy balance and glucose homeostasis. Nature. (2006);444:847–853. doi: 10.1038/nature05483. [DOI] [PMC free article] [PubMed] [Google Scholar]
- 14.Folin O., Denis W. On phosphotungstic-phosphomolybdic compounds as color reagents. J. Biol. Chem. (1912);12:239–243. [Google Scholar]
- 15.Davies R., Massey R.C., McWeeny D.J. The catalysis of the N-nitrosation of secondary amines by nitrosophenols. Food Chem. (1980);6:115–122. doi: 10.1016/0308-8146(80)90027-8. [DOI] [Google Scholar]
- 16.Blois M.S. Antioxidant determinations by the use of a stable free radical. Nature. (1958);181:1199–1200. doi: 10.1038/1811199a0. [DOI] [Google Scholar]
- 17.Fasshauer M., Klein J., Neumann S., Eszlinger M., Paschke R. Isoproterenol inhibits resistin gene expression through a G(S)-protein-coupled pathway in 3T3-L1 adipocytes. FEBS Lett. (2001);500:60–63. doi: 10.1016/S0014-5793(01)02588-1. [DOI] [PubMed] [Google Scholar]
- 18.Rayalam S., Della-Fera M.A., Yang J.Y., Park H.J., Ambati S., Baile C.A. Resveratrol potentiates genistein’s antiadipogenic and proapoptotic effects in 3T3-L1 adipocytes. J. Nutr. (2007);137:2668–2673. doi: 10.1093/jn/137.12.2668. [DOI] [PubMed] [Google Scholar]
- 19.Barber M.C., Price N.T., Travers M.T. Structure and regulation of acetyl-CoA carboxylase genes of metazoa. Biochim. Biophys. Acta. (2005);1733:1–28. doi: 10.1016/j.bbalip.2004.12.001. [DOI] [PubMed] [Google Scholar]
- 20.Levert K.L., Waldrop G.L., Stephens J.M. A biotin analog inhibits acetyl-CoA carboxylase activity and adipogenesis. J. Biol. Chem. (2002);277:16347–16350. doi: 10.1074/jbc.C200113200. [DOI] [PubMed] [Google Scholar]
- 21.Schmida B., Rippmann J.F., Tadayyon M., Hamilton B.S. Inhibition of fatty acid synthase prevents preadipocyte differentiation. Biochem. Biophys. Res. Commun. (2005);328:1073–1082. doi: 10.1016/j.bbrc.2005.01.067. [DOI] [PubMed] [Google Scholar]
- 22.Wakil S.J., Abu-Elheiga L.A. Fatty acid metabolism: target for metabolic syndrome. J. Lipid Res. (2009);50:138–143. doi: 10.1194/jlr.R800079-JLR200. [DOI] [PMC free article] [PubMed] [Google Scholar]
- 23.Li Y.C., Zheng X.L., Liu B.T., Yang G.S. Regulation of ATGL expression mediated by leptin in vitro in porcine adipocyte lipolysis. Mol. Cell. Biochem. (2010);333:121–128. doi: 10.1007/s11010-009-0212-4. [DOI] [PubMed] [Google Scholar]
- 24.Zimmermann R., Strauss J.G., Haemmerle G., Schoiswohl G., Birner-Gruenberger R., Riederer M., Lass A., Neuberger G., Eisenhaber F., Hermetter A., Zechner R. Fat mobilization in adipose tissue is promoted by adipose triglyceride lipase. Science. (2004);306:1383–1386. doi: 10.1126/science.1100747. [DOI] [PubMed] [Google Scholar]
- 25.Shen W.J., Patel S., Miyoshi H., Greenberg A.S., Kraemer F.B. Functional interaction of hormone sensitive lipase and perilipin in lipolysis. J. Lipid Res. (2009);50:2306–2313. doi: 10.1194/jlr.M900176-JLR200. [DOI] [PMC free article] [PubMed] [Google Scholar]
- 26.Villena J.A., Roy S., Sarkadi-Nagy E., Kim K.H., Sul H.S. Desnutrin, an adipocyte gene encoding a novel patatin domain-containing protein, is induced by fasting and glucocorticoids: ectopic expression of desnutrin increases triglyceride hydrolysis. J. Biol. Chem. (2004);279:47066–47075. doi: 10.1074/jbc.M403855200. [DOI] [PubMed] [Google Scholar]
- 27.Yang X., Zhang X., Heckmann B.L., Lu X., Liu J. Relative contribution of adipose triglyceride lipase and hormone-sensitive lipase to tumor necrosis factor-α (TNF-α)-induced lipolysis in adipocytes. J. Biol. Chem. (2011);286:40477–40485. doi: 10.1074/jbc.M111.257923. [DOI] [PMC free article] [PubMed] [Google Scholar]
- 28.Li L., Yang Y., Yang G., Lu C., Yang M., Liu H., Zong H. The role of JAZF1 on lipid metabolism and related genes in vitro. Metabolism. (2011);60:523–530. doi: 10.1016/j.metabol.2010.04.021. [DOI] [PubMed] [Google Scholar]
- 29.Kowalska K., Olejnik A., Rychlik J., Grajek W. Cranberries (Oxycoccus quadripetalus) inhibit adipogenesis and lipogenesis in 3T3-L1 cells. Food Chem. (2014);148:246–252. doi: 10.1016/j.foodchem.2013.10.032. [DOI] [PubMed] [Google Scholar]


