Abstract
Understanding tumor vascular dynamics through parameters such as blood flow and oxygenation can yield insight into tumor biology and therapeutic response. Hyperspectral microscopy enables optical detection of hemoglobin saturation or blood velocity by either acquiring multiple images that are spectrally distinct or by rapid acquisition at a single wavelength over time. However, the serial acquisition of spectral images over time prevents the ability to monitor rapid changes in vascular dynamics and cannot monitor concurrent changes in oxygenation and flow rate. Here, we introduce snap shot-multispectral imaging (SS-MSI) for use in imaging the microvasculature in mouse dorsal window chambers. By spatially multiplexing spectral information into a single image capture, simultaneous acquisition of dynamic hemoglobin saturation and blood flow over time is achieved down to the capillary level and provides an improved optical tool for monitoring rapid in vivo vascular dynamics.
The study of tissue dynamics is critical for understanding the processes leading to tumor growth and development. The aberrant vasculature of tumors often leads to the development of a hypoxic microenvironment that may enable protective and proliferative effects [1]. Hypoxia acts as an upstream control for a number of molecular factors, such as hypoxia inducible factor-1 [2] and programmed death ligand-1 [3], that induce tumor resistance to radiation and chemotherapy. However, the interactions of hypoxia with the mechanistic pathways governing tumor therapeutic response are complex and require further study in order to develop more effective clinical treatment of a variety of cancers.
Optical techniques for observing and measuring tumor hemodynamics have enabled the study of hypoxia in an in vivo setting without the need for invasive probes. Photoacoustic tomography [4] and visible-light optical coherence tomography [5] have been used to detect the oxygen saturation levels in vivo by using differences in the optical absorption properties of oxygenated and deoxygenated hemoglobin. Hyperspectral imaging has been developed with spatial scanning setups [6] or a wavelength-tunable filter [7] and has been used to detect vascular oxygen levels in vivo. These methods suffer from slow acquisition speeds and are affected by blood flow or respiratory motion. Snap shot imaging of hyperspectral data using dispersion has been used to obtain vascular oxygen levels in the retina [8, 9], however, complex optical hardware and processing was required along with a large number of wavelengths.
Blood flow properties may also provide additional insight into tumor growth and transport characteristics of the vasculature. Laser Doppler imaging measures blood perfusion over large areas, but does not resolve individual vessels [10]. Optical coherence tomography has demonstrated the ability to image three-dimensional vascular structure and flow, but requires complex system design and long acquisition times [11]. An automated post-processing method for measuring flow velocity from standard brightfield video microscopy images was previously developed [12] but was unable to directly correlate oxygenation information with flow.
Here, we demonstrate an improved method termed snap shot-multispectral imaging (SS-MSI) that only requires 4 simultaneously acquired wavelengths to enable computation of hemoglobin saturation maps from a single image. Additionally, concurrent acquisition of blood flow velocity allows for multi-functional hemodynamic data. Furthermore, the optical setup uses simple design principles that interface with standard microscopes allowing for potential widespread use.
Achieving snap shot acquisition of hemoglobin saturation requires simultaneous capture of sufficient spectral information to determine the amount of optical absorption of blood in the vasculature. The dominant absorbers are oxy- and deoxyhemoglobin, and calculation of their relative concentrations can be computed from multispectral images as previously detailed [13]. The absorption, A, is computed as
| (1) |
in which λ is the wavelength of light, Ical is the transmitted intensity of a calibration image of the source, and Itissue is the transmitted intensity of the sample. A(λ) depends upon the concentration of absorbers as
| (2) |
where bo is a constant term accounting for overall changes caused by the source intensity, b1 is a parameter modulating the effective attenuation coefficient, μeff, as determined from diffusion theory, ε gives the attenuation coefficient of the ith absorber, and Ci is the concentration of the absorber modulated by the optical path length. A least squares fit determines the values of bo, b1, and Ci. Using oxyhemoglobin (HbO2) and deoxyhemoglobin (HbR) as the primary absorbers requires the selection of at least 4 wavelengths over which to perform the fit and thus determines the minimum number of wavelengths needed to form a multispectral dataset. Calculating the ratio CHbO2 to CHbO2 + CHbR yields the fraction of oxyhemoglobin contained in the blood.
Additionally, velocity maps of vascular flow can be computed with SS-MSI by using a previously developed correlation mapping algorithm using images at a single wavelength [12]. Briefly, moving scatterers in the blood cause intensity fluctuations in an image over time that are temporally correlated among neighboring pixels. Performing a pixel-by-pixel analysis and finding the time point that maximizes this correlation allows for computation of the distance traveled over time for a particular scatterer as well as its direction of motion. To further enhance this processing method, images were first normalized according to a spatial Fourier Transform low-pass filter of each image to remove bulk intensity variations. A moving temporal average with a 2 second window about each individual frame was calculated and subtracted to enhance differences in the images due to moving absorbers or scatterers. A Gabor filter was applied to the original images to create a mask of the vessel regions [14], which was then applied to the processed images to restrict analysis to vascular regions. These additional steps resulted in improved flow visualization in certain vessels and allowed SS-MSI to obtain simultaneous hemoglobin saturation and velocity information from the vasculature.
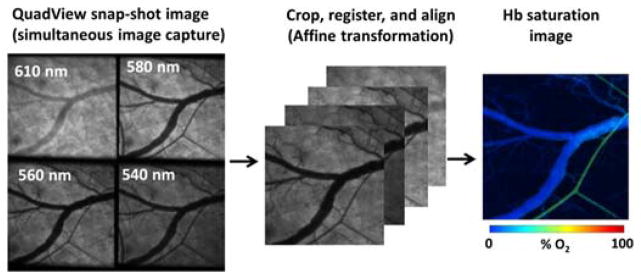
Parallel detection of different wavelengths in SS-MSI was performed by optically splitting and filtering the light that was transmitted through a sample. A sequence of beamsplitters mapped the field of view onto different quadrants of the detector. Optical bandpass filters were used to isolate different spectral components in each quadrant, thus allowing a single camera frame to contain a 4-wavelength multispectral dataset, as shown in Fig. 1. In post-processing, each camera frame was sub-divided into its component wavelength images, which were then registered to one another via an affine transformation to ensure appropriate spatial alignment of each image. Performing the registration step on a single frame yielded the appropriate transform parameters for all other frames acquired, independent of sample motion. A reference image of the source distribution was acquired by using a neutral density filter in place of the sample and acquiring an image of the source output. Normalizing each individual wavelength to its corresponding reference image compensated for variations in the distribution of the light throughout the image as well as differences in optical loss between each channel. A non-negative least squares fit of the multispectral images acquired at each time point was then computed to determine the composition of oxyhemoglobin and deoxyhemoglobin present in the field of view. Acquiring images over time gave the ability to detect dynamic changes in oxygenation, the temporal resolution of which was limited only by the exposure time of the detector.
Fig. 1.

Spectral data acquisition and oxygen saturation processing using SS-MSI.
SS-MSI was performed on a Zeiss Axio Observer inverted microscope. A halogen lamp provided the white light source for imaging. A QV2 multichannel imager (Photometrics) was attached via a side documentation port and was used to separate sample scattered light into 4 quadrants on a Hamamatsu Orca Flash4 CMOS camera by passing the light through a sequence of beamsplitters (30/70, 40/60, 50/50). Light directed towards each camera quadrant was filtered at 540, 560, 580, and 610 nm, respectively, each with Δλ = 10 nm. The wavelengths were chosen at the local minima and maxima of the absorption spectra of hemoglobin (540, 560, and 580 nm). Additionally, 610 nm was chosen as a wavelength with a significant absorption difference between oxy/deoxyhemoglobin. Images acquired in the 580 nm channel were used for flow velocity calculations.
Validation of the ability of SS-MSI to detect varying levels of oxygenation was carried out using blood extracted from mice via cardiac puncture. Blood samples were placed in heparinized phosphate buffered saline (PBS, pH=7.2) with 20 units of heparin per mL of PBS. Blood samples were washed 3 times with PBS and then placed into a 48-well plate and incubated at 37°C in varying levels of pO2 in a hypoxia chamber. The pO2 level within the blood solution was measured using a fiber probe oxygen sensor (OxyLite). Sample plates were sealed with parafilm before being removed from the hypoxia chamber and transferred to the microscope for imaging. The samples were then returned to the hypoxia chamber for further incubation at different oxygen levels.
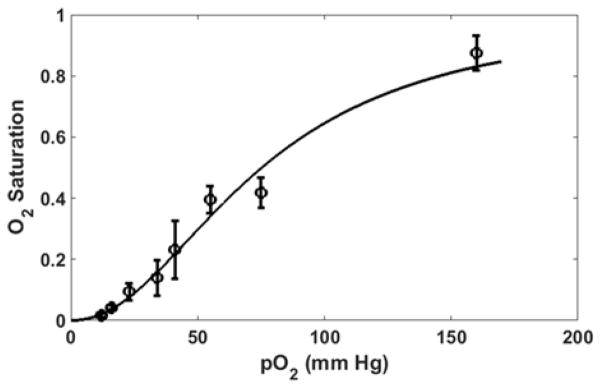
Images of the blood samples were acquired with SS-MSI using an exposure time of 200 ms for all data points. The individual wavelength images were aligned to the 580 nm image as a reference. The least squares fit was computed with the ratio of oxyhemoglobin to the total hemoglobin content mapped onto each image pixel. The relative amount of oxyhemoglobin over the entire image was averaged and plotted as a function of the pO2 level measured via the oxygen sensing probe in the hypoxia chamber as shown in Fig. 2. Errors were calculated as the standard deviation over each image. The results were fit to the Hill equation [15] and show a characteristic sigmoid shape for the sO2 level as measured via SS-MSI and are comparable with published results for the mouse hemoglobin saturation curve [16].
Fig. 2.

Measured sO2 values for mouse blood smears versus pO2 in solution using SS-MSI.
For in vivo demonstration of SS-MSI, window chamber surgeries were performed on C57BL/6 mice and adhered to Institutional Animal Care and Use Committee guidelines. Some animals were injected with ~100,000 Lewis Lung carcinoma cells at the time of surgery. Tumors were allowed to grow for 1 week before imaging. Mice were anesthetized during imaging sessions using 1.5% isoflurane mixed with 21% O2 and balanced with N2 administered via a nose cone. Body temperature was maintained via a heating pad set to 37°C.
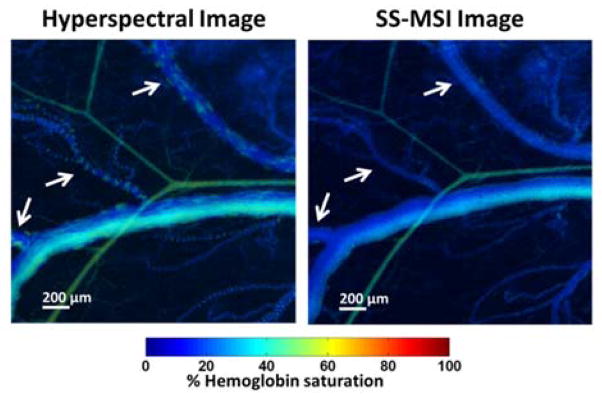
A mouse dorsal window chamber with no tumor was imaged using both SS-MSI and hyperspectral imaging using a tunable filter as shown in Fig. 3. A vein and artery pair within the window region is shown. The oxygen saturation in the arteries was higher than that of the veins, although anesthesia effects may have caused overall lower than normal oxygen levels. Using hyperspectral imaging, images were acquired sequentially for different wavelengths using an integration time of 100–300 ms per wavelength. Differences in integration times compensated for signal loss caused by the spectral output of the source, tissue optical properties, and optical losses due to the tunable filter. Due to the movement of blood in the vessels during image acquisition, artifacts were created in calculating the hemoglobin saturation throughout the vasculature. In contrast, the SS-MSI image, acquired in 500 ms, is free of these artifacts due to the simultaneous acquisition of each wavelength, which causes any motion from blood flow or respiration during image acquisition to be equally averaged among each channel. Such images can still be successfully mapped together via the affine transform parameters originally obtained. The sO2 values between the hyperspectral and SS-MSI images can be seen to have good correlation throughout the image, though slight differences are apparent in the main vein in the middle of the image. These differences may be caused by the motion artifacts in the hyperspectral dataset.
Fig. 3.

Comparison of data acquired using a tunable filter and using SS-MSI. White arrows indicate motion artifacts due to blood flow in the standard hyperspectral image. SS-MSI image is free of motion artifacts.
Imaging a second mouse with a tumor demonstrated the ability of SS-MSI to detect changes in the vasculature over time as shown in Fig. 4. Anesthesia was given as previously described. Fig. 4(a) shows an image of the window chamber region under normoxic conditions. Images were continuously acquired with an exposure time of 200 ms. Nearly 20 seconds after imaging began, the O2 level was reduced to 12% to induce hypoxia. Images were continuously recorded for an additional 50 seconds. After imaging, the mouse continued to breathe hypoxic air for an additional 3 minutes. At that point, a second set of images was acquired as shown in Fig. 4(b), with the O2 level adjusted back to normoxia after 17 seconds of imaging.
Fig. 4.
SS-MSI images of oxygen saturation in a mouse dorsal window chamber under (a) normoxic and (b) hypoxic conditions. (c) Plot of dynamic sO2 changes over time, averaged over the regions indicated by the blue and red boxes in (a) and (b). Black line indicates time at which air was changed from either normoxia to hypoxia or vice versa.
The oxygen saturation level of a vein-artery pair was tracked over time and plotted in Fig. 4(c). It can be observed that noticeable changes in vascular sO2 occur nearly 10 seconds after environmental O2 levels change. The sO2 level in the artery also began to change before observable changes in the vein.
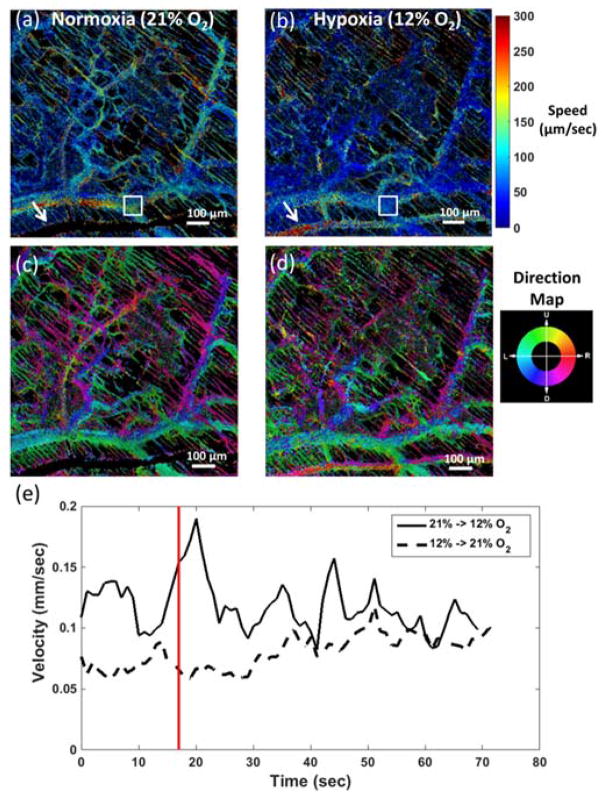
The same dataset used in Fig. 4 was used to compute the flow velocity. Temporal correlation mapping was performed on images acquired at 580 nm. Fig. 5(a–d) shows the temporally averaged speed and direction maps of the vascular flow over time while the mouse was breathing normoxic or hypoxic air. Blood flow under hypoxia was observed to slow throughout the window chamber region compared to normoxic flow. An artery at the bottom of Fig. 5(a) had a velocity too high to measure under normoxic conditions, but the flow slows under hypoxic conditions to allow velocity detection in Fig. 5(b). Performing a short-time Fourier transform along the temporal dimension of the flow images on sequences of 30 frames allowed computation of the instantaneous velocity over time as shown in Fig. 5(e). The average velocity in the vein slows under hypoxia and shows a gradual increase as the air returns to normoxic conditions. The reduced blood flow could occur as part of the overall response to a lack of oxygen as blood is diverted to more critical regions of the body.
Fig. 5.
Maps of (a, b) speed and (c, d) direction of blood flow in a mouse dorsal window chamber. Flow in the capillaries was detected and appears as the thin, diagonal streaks throughout the image. White arrow indicates an artery with a velocity too high to detect under normoxia but that slows under hypoxia. (e) Plot of average velocity from the region indicated by the white box in (a) and (b) over time as the O2 level is varied. Red line indicates time when oxygen level was altered. Data was computed using the same dataset in Fig. 4 at 580 nm.
In conclusion, we demonstrate a snap shot multi-spectral method that allows simultaneous acquisition of vascular oxygen supply and blood flow images in the mouse window chamber. SS-MSI only requires 4 wavelengths and uses relatively simply hardware and software methods compared to other similar techniques. The ability to image different parameters of in vivo vascular function at the capillary level may provide a more comprehensive analysis of therapeutic effects on tumor development and angiogenesis.
Acknowledgments
This work was supported by the North Carolina Biotechnology Center grant No. 2013-MRG-1111 and the National Institute of Health grant No. NIH 5-R01-CA167250-02.
Full References
- 1.Vaupel P, Mayer A. Hypoxia in cancer: significance and impact on clinical outcome. Cancer Metastasis Rev. 2007;26:225–239. doi: 10.1007/s10555-007-9055-1. [DOI] [PubMed] [Google Scholar]
- 2.Moeller BJ, Richardson RA, Dewhirst MW. Hypoxia and radiotherapy: opportunities for improved outcomes in cancer treatment. Cancer Metastasis Rev. 2007;26:241–248. doi: 10.1007/s10555-007-9056-0. [DOI] [PubMed] [Google Scholar]
- 3.Noman MZ, Desantis G, Janji B, Hasmim M, Karray S, Dessen P, Bronte V, Chouaib S. PD-L1 is a novel direct target of HIF-1α, and its blockade under hypoxia enhanced MDSC-mediated T cell activation. The Journal of Experimental Medicine. 2014;211:781–790. doi: 10.1084/jem.20131916. [DOI] [PMC free article] [PubMed] [Google Scholar]
- 4.Wang L, Maslov K, Wang LV. Single-cell label-free photoacoustic flowoxigraphy in vivo. Proceedings of the National Academy of Sciences of the United States of America. 2013;110:5759–5764. doi: 10.1073/pnas.1215578110. [DOI] [PMC free article] [PubMed] [Google Scholar]
- 5.Yi J, Chen S, Backman V, Zhang HF. In vivo functional microangiography by visible-light optical coherence tomography. Biomedical optics express. 2014;5:3603–3612. doi: 10.1364/BOE.5.003603. [DOI] [PMC free article] [PubMed] [Google Scholar]
- 6.Khoobehi B, Beach JM, Kawano H. Hyperspectral imaging for measurement of oxygen saturation in the optic nerve head. Investigative ophthalmology & visual science. 2004;45:1464–1472. doi: 10.1167/iovs.03-1069. [DOI] [PubMed] [Google Scholar]
- 7.Sorg BS, Moeller BJ, Donovan O, Cao Y, Dewhirst MW. Hyperspectral imaging of hemoglobin saturation in tumor microvasculature and tumor hypoxia development. BIOMEDO. 2005;10:044004–044011. doi: 10.1117/1.2003369. [DOI] [PubMed] [Google Scholar]
- 8.Gao L, Smith RT, Tkaczyk TS. Snapshot hyperspectral retinal camera with the Image Mapping Spectrometer (IMS) Biomedical optics express. 2012;3:48–54. doi: 10.1364/BOE.3.000048. [DOI] [PMC free article] [PubMed] [Google Scholar]
- 9.Kashani AH, Kirkman E, Martin G, Humayun MS. Hyperspectral Computed Tomographic Imaging Spectroscopy of Vascular Oxygen Gradients in the Rabbit Retina In Vivo. PLoS ONE. 2011;6:e24482. doi: 10.1371/journal.pone.0024482. [DOI] [PMC free article] [PubMed] [Google Scholar]
- 10.Leutenegger M, Martin-Williams E, Harbi P, Thacher T, Raffoul W, André M, Lopez A, Lasser P, Lasser T. Real-time full field laser Doppler imaging. Biomedical optics express. 2011;2:1470–1477. doi: 10.1364/BOE.2.001470. [DOI] [PMC free article] [PubMed] [Google Scholar]
- 11.Skala MC, Fontanella A, Hendargo H, Dewhirst MW, Izatt JA. Combined hyperspectral and spectral domain optical coherence tomography microscope for noninvasive hemodynamic imaging. Optics letters. 2009;34:289–291. doi: 10.1364/ol.34.000289. [DOI] [PMC free article] [PubMed] [Google Scholar]
- 12.Fontanella AN, Schroeder T, Hochman DW, Chen RE, Hanna G, Haglund MM, Secomb TW, Palmer GM, Dewhirst MW. Quantitative mapping of hemodynamics in the lung, brain, and dorsal window chamber-grown tumors using a novel, automated algorithm. Microcirculation (New York, NY: 1994) 2013;20:724–735. doi: 10.1111/micc.12072. [DOI] [PMC free article] [PubMed] [Google Scholar]
- 13.Palmer GM, Fontanella AN, Shan S, Hanna G, Zhang G, Fraser CL, Dewhirst MW. In vivo optical molecular imaging and analysis in mice using dorsal window chamber models applied to hypoxia, vasculature and fluorescent reporters. Nat Protocols. 2011;6:1355–1366. doi: 10.1038/nprot.2011.349. [DOI] [PMC free article] [PubMed] [Google Scholar]
- 14.Estrada R, Tomasi C, Cabrera MT, Wallace DK, Freedman SF, Farsiu S. Enhanced video indirect ophthalmoscopy (VIO) via robust mosaicing. Biomedical optics express. 2011;2:2871–2887. doi: 10.1364/BOE.2.002871. [DOI] [PMC free article] [PubMed] [Google Scholar]
- 15.Goutelle S, Maurin M, Rougier F, Barbaut X, Bourguignon L, Ducher M, Maire P. The Hill equation: a review of its capabilities in pharmacological modelling. Fundamental & clinical pharmacology. 2008;22:633–648. doi: 10.1111/j.1472-8206.2008.00633.x. [DOI] [PubMed] [Google Scholar]
- 16.Gray LH, Steadman JM. Determination of the oxyhaemoglobin dissociation curves for mouse and rat blood. The Journal of physiology. 1964;175:161–171. doi: 10.1113/jphysiol.1964.sp007509. [DOI] [PMC free article] [PubMed] [Google Scholar]


