

Background: Channelrhodopsins (ChRs) are light-gated cation channels widely used in optogenetics.
Results: Time-resolved absorption spectroscopy of the high efficiency PsChR2 throughout the visible spectrum from 100 ns to 3 s was used to resolve spectra and kinetics of all photointermediates.
Conclusion: The photochemical reactions are described by the superposition of two parallel photocycles.
Significance: The parallel-cycle model opens new perspectives in understanding the mechanism of channelrhodopsins.
Keywords: optogenetics, photoreceptor, protein dynamic, rhodopsin, ultraviolet-visible spectroscopy (UV-Vis spectroscopy), channelrhodopsin, time-resolved spectroscopy, photocycle, phototaxis, optogenetics
Abstract
The photocycle kinetics of Platymonas subcordiformis channelrhodopsin-2 (PsChR2), among the most highly efficient light-gated cation channels and the most blue-shifted channelrhodopsin, was studied by time-resolved absorption spectroscopy in the 340–650-nm range and in the 100-ns to 3-s time window. Global exponential fitting of the time dependence of spectral changes revealed six lifetimes: 0.60 μs, 5.3 μs, 170 μs, 1.4 ms, 6.7 ms, and 1.4 s. The sequential intermediates derived for a single unidirectional cycle scheme based on these lifetimes were found to contain mixtures of K, L, M, O, and P molecular states, named in analogy to photointermediates in the bacteriorhodopsin photocycle. The photochemistry is described by the superposition of two independent parallel photocycles. The analysis revealed that 30% of the photoexcited receptor molecules followed Cycle 1 through the K, M, O, and P states, whereas 70% followed Cycle 2 through the K, L, M, and O states. The recovered state, R, is spectrally close, but not identical, to the dark state on the seconds time scale. The two-cycle model of this high efficiency channelrhodopsin-2 (ChR) opens new perspectives in understanding the mechanism of channelrhodopsin function.
Introduction
Channelrhodopsins (ChRs)3 are membrane-depolarizing phototaxis receptors in algae (1) that function as light-gated cation channels when expressed heterologously (2, 3). The relatively efficient channelrhodopsin-2 from Chlamydomonas reinhardtii (CrChR2 (1, 3)) was found sufficiently active to induce neuron firing (4), which has rapidly resulted in its worldwide use for neural photocontrol in the incisive technology called optogenetics (5, 6). Despite the extensive use of CrChR2 and its derivatives as optogenetic tools, the mechanism of ChR function is not well understood. Following light absorption, ChRs, like other microbial rhodopsins, undergo a cyclic sequence of structural transitions called a photochemical reaction cycle or “photocycle” (7, 8). Spectral changes in the photocycle result from the influence of chemical events and structural changes on the photoactive site. To elucidate the mechanism of ChRs, it is essential to establish the nature and kinetics of the spectrally shifted photocycle intermediates. The photocycle mechanism then provides the foundation for interpretation of molecular spectroscopic, electrophysiological, and crystallographic information.
Several spectroscopic studies conducted by different groups to define the photocycle of CrChR2 have consistently produced data of greater complexity than that of other microbial rhodopsins (9, 10). The complexities are challenging to resolve. For example, the number of exponential terms needed to describe the CrChR2 flash photolysis exceeds the number of spectrally distinct intermediates, making a comprehensive solution difficult (9–13). Furthermore, the data acquisition, which entails repetitive flashing of samples to acquire transients with adequate signal-to-noise ratio, is complicated for slow cycling sensory rhodopsins such as ChRs because it is difficult to avoid data distortion from secondary photoexcitation of long-lived photointermediates. The single photocycle model, based on the unidirectional scheme, obtained in absorption studies (11, 12) reproduces reasonably well the channel opening and closing kinetics in laser experiments. However, it falls short in predicting the transient channel current produced by long light pulses. The latter is better explained by a hypothetical model based on two interconnected cycles (9, 10). A two-cycle model has also been suggested recently to describe the light-dark adaptation during secondary photoreactions of the channelrhodopsin C128T mutant (14). The support for multiple cycles from photochemical studies is still missing, and the link between the photocurrents and photochemical intermediates remains uncertain (10).
Here we report a comprehensive analysis of the photocycle of the Platymonas subcordiformis channelrhodopsin-2 (PsChR2) (formerly PsChR).4 PsChR2, found by homology cloning (15), is especially well suited for structure/function study because of its favorable properties over CrChR2, specifically its ∼3-fold greater unitary conductance, faster recovery from excitation, and higher sodium selectivity. Using time-resolved absorption spectroscopy, in combination with algebraic kinetic analysis, we show that two parallel photocycles are needed to describe the photoreactions of PsChR2 on the molecular level.
Experimental Procedures
Expression and Purification of PsChR2 in Pichia pastoris
Procedures were modifications of those described previously (15, 16). The seven-transmembrane domain of PsChR2, with a tobacco etch virus protease site at the N terminus and a nine-His tag at the C terminus, was subcloned into the pPIC9K vector (Life Technologies) via its EcoRI and AvrII sites. P. pastoris strain SMD1168 (his4, pep4) (Life Technologies) was transformed by electroporation using the linearized resultant plasmid pPIC9K-PsChR-His9. A P. pastoris clone that grows on 4 mg/ml Geneticin was selected according to the manufacturer's instructions. Protein expression and purification were carried out as described earlier for Chlamydomonas augustae channelrhodopsin 1 (16). When A600 of cells grown in buffered glycerol-complex medium reached 2–6, the cells were spun down and transferred to buffered minimal methanol yeast medium supplemented with 5 μm all-trans-retinal and 0.5% methanol with A600 at 1. After 24–30 h, the cells were harvested by low speed centrifugation and disrupted in a bead beater (BioSpec Products, Bartlesville, OK) in 20 mm sodium phosphate (pH 7.4), 100 mm NaCl, 2 mm EDTA, 1 mm PMSF, and 5% (v/v) glycerol. The membranes were collected by ultracentrifugation at 40,000 rpm and solubilized in 1.5% (w/v) dodecyl maltoside for 1 h at 4 °C. Non-solubilized material was removed by ultracentrifugation at 45,000 rpm, and protein was purified from the supernatant using a nickel-nitrilotriacetic acid column (Qiagen) and eluted in 20 mm HEPES (pH 7.4), 100 mm NaCl, 0.05% dodecyl maltoside, and 300 mm imidazole. The protein samples were concentrated in 100 mm NaCl, 0.05% dodecyl maltoside, 20 mm HEPES (pH 7.4) and kept at 4 °C.
Time-resolved Optical Absorption Measurements
The photoreactions of PsChR2 following a 355 nm pulse from a Q-switched DCR-11 Nd:YAG laser (∼7-ns full width at half-maximum, 0.5 mJ/mm2 pulse energy) were monitored by time-resolved optical absorption spectroscopy using a CCD detector (Andor Technology, Belfast City, Ireland). The spectral changes were probed with a pulsed xenon flash lamp. Difference spectra, post-excitation minus pre-excitation, were collected in the 340–650-nm spectral range and at 24 delay times between 100 ns and 3 s, spaced logarithmically. Each difference spectrum is the average of 70 absorption traces taken in a 10-μl flow cell with a ∼10-min sample recycling time to avoid secondary photoreactions of long-lived intermediates. This ensured that each measurement was made on dark-adapted pigment. The measurements were carried out at 24 °C.
The time-resolved optical absorption difference spectra were analyzed by singular value decomposition and global exponential fitting using MATLAB (MathWorks), which provided the apparent rates and the associated spectral changes, called the b-spectra. The spectra of proposed intermediates were extracted from the b-spectra as described previously (17).
Results
Spectral Forms, Intermediates, and Molecular States
Kinetics of multistep reactions are frequently derived from optical absorption measurements for which absorption changes are interpreted as an accumulation and decay of distinct intermediates. In strict chemical terms, an intermediate is a molecule or molecular state with limited lifetime having unique molecular characteristics. In quantitative kinetic analysis, the term “intermediate” refers to a member of a presumed kinetic scheme. Intermediates of presumed kinetic schemes, however, may turn out to be mixtures of molecules or states, and the term “intermediate” no longer represents a molecular property. In our description of spectra, we use the term spectral “form” if no kinetic scheme is assumed, and apply the term ”intermediate” to members of all kinetic schemes without any restriction. When the spectrum of a form or intermediate meets the requirements set for a single state, we use the term “molecular state” or simply add “state” to the description.
Global Exponential Fitting of Time-resolved Spectral Data
Time-resolved absorption difference spectra, post-photoexcitation minus pre-photoexcitation, were recorded in the 340–650-nm wavelength range at 24 delay times equally spaced on a logarithmic time scale from 100 ns to 3 s (Fig. 1). A photoproduct with absorption red-shifted from that of the unphotolyzed (dark) pigment is observed at 100 ns and partially converts to a blue-absorbing form on the early microsecond time scale (Fig. 1a). These early products decay into a new red-absorbing form in the late microsecond to early millisecond time window (Fig. 1b). Most of the red-absorbing form decays in milliseconds (Fig. 1c) to a final form. However, a portion of it, showing a somewhat less red-shifted absorption, decays within 1–2 s (Fig. 1d). The nonzero final absorption difference spectrum indicates that the last member of the photocycle on our time scale has an absorption maximum different from that of the dark form. We call the final product the “recovered” form for this reason. Many of the spectral transitions described above resemble those of the bacteriorhodopsin (BR) photocycle, where they are associated with conversions between the K, M, and O intermediate states.
FIGURE 1.
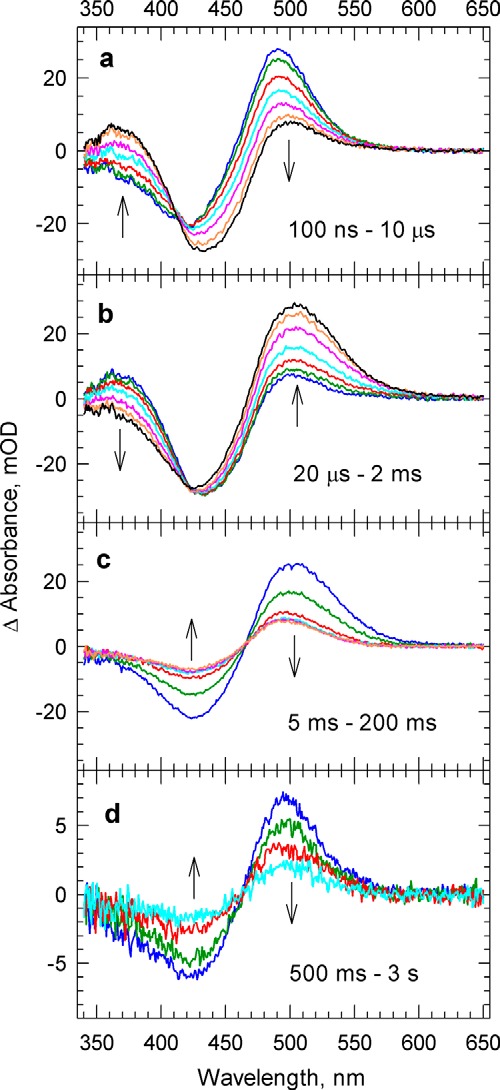
Post-photoexcitation minus pre-photoexcitation difference spectra recorded at time delays from 100 ns to 3 s following laser excitation. Arrows indicate the direction of spectral change as delay time increases. mOD, mean optical density.
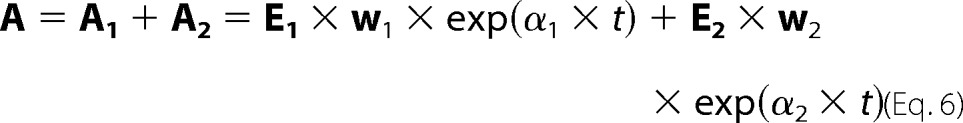
We based our kinetic analysis on the assumption that each step in the photochemical reaction cycle (photocycle) follows first order kinetics, and the concentration changes of the intermediates in time can be described by a set of first order linear differential equations. The solution to such a set, regardless of the complexity of the kinetic scheme they represent, is always a sum of time-dependent exponential functions. The absorption data matrix recorded in the experiment is the product of the spectra and the concentrations of the intermediates, and therefore can be fitted to a sum of exponential functions
where ri are the apparent rates; bi (λ) are called the b-spectra; D is the matrix of the residuals of the fit, which contains no information but experimental noise; and λ and t denote wavelength and time, respectively. Note that the global exponential fitting of the absorption data, as shown here, is carried out without the assumption of a reaction scheme, and the results of the fit are not derived from any assumed mechanism. Only after a scheme is assumed do the b-spectra and apparent rates acquire physical meaning and can be interpreted in terms of spectral changes in, and rates of, the presumed reaction steps.
The global exponential fitting of the data depicted in Fig. 1 was accomplished after performing singular value decomposition on the data matrix.
The singular value decomposition separates the spectral information, U(λ,t), from the time-dependent information, VT(t,t). Both the U and V matrices contain orthogonal vectors, and because there are a limited number of intermediates, only a small number of vectors in these matrices carry information; the rest can be regarded simply as experimental noise. The magnitude of the U and V vector pair contributions to the data matrix is contained in the S matrix. Fitting only a limited number of V vectors greatly simplifies the exponential fit. For the data shown in Fig. 1, the time dependence of the five most significant V vectors, with significance values of 1.08, 0.365, 0.120, 0.003, and 0.002, was adequately fitted with six exponentials, yielding six apparent rates corresponding to lifetimes of 0.60, 5.3, and 170 μs, 1.4 and 6.7 ms, and 1.4 s. Fig. 2a shows the experimental V vectors (from 1 to 5) (circles) and their fit using five and six exponentials (black and red lines, respectively). In Fig. 2b, the residuals, Vexperimental − Vreproduced, are shown for the 5- and 6-exponential fits together with five insignificant V vectors (from 7 to 11) representing the noise level. It is clear that the residuals of the 6-exponential fit are at the level of experimental noise and that no additional exponential terms are warranted in the fit. The b-spectra obtained in the fit are shown in Fig. 3a. The b-spectra represent the pre-exponential factors, or amplitudes of the exponential functions at each of the wavelengths. These spectra are not difference spectra of intermediates because no scheme is assumed at this stage of the analysis. Rather, these are spectral shapes that are present at zero time and disappear as the exponential functions decay in time. One of the apparent rates is always zero, and the corresponding b-spectrum, b0, displays the spectrum that would be recorded at infinite time (extrapolated to infinite time). Kinetic results are most often discussed in terms of unidirectional sequential schemes. The main features of PsChR2 kinetics are thus initially presented here following that tradition. We regard the unidirectional sequential mechanism used here as an analysis tool only, and not as the mechanism of the PsChR2 photocycle. Indeed, as will be shown below, a simple unbranched unidirectional sequential scheme is not adequate to describe the PsChR2 kinetics on the molecular level.
FIGURE 2.
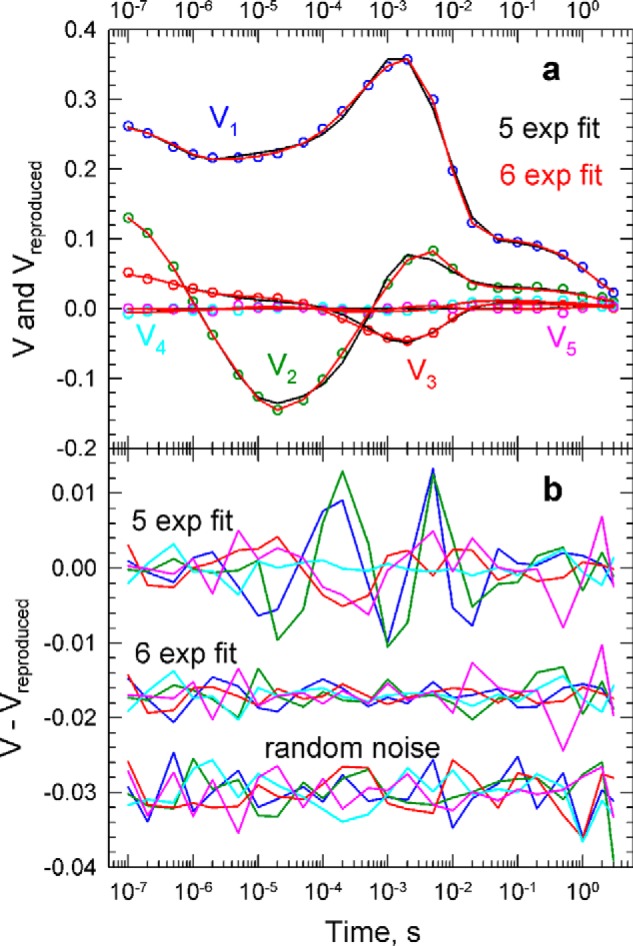
a, V vectors (time courses) of the spectral changes shown in circles with fits to the time points for a 5-exponential fit (5 exp fit, black) and a 6-exponential fit (6 exp fit, red). b, residuals (data minus fits) for a 5-exponential fit and a 6-exponential fit. Also shown is the level of random noise, showing that a 6-exponential fit, but not a 5-exponential fit, reproduces the data within the noise level.
FIGURE 3.
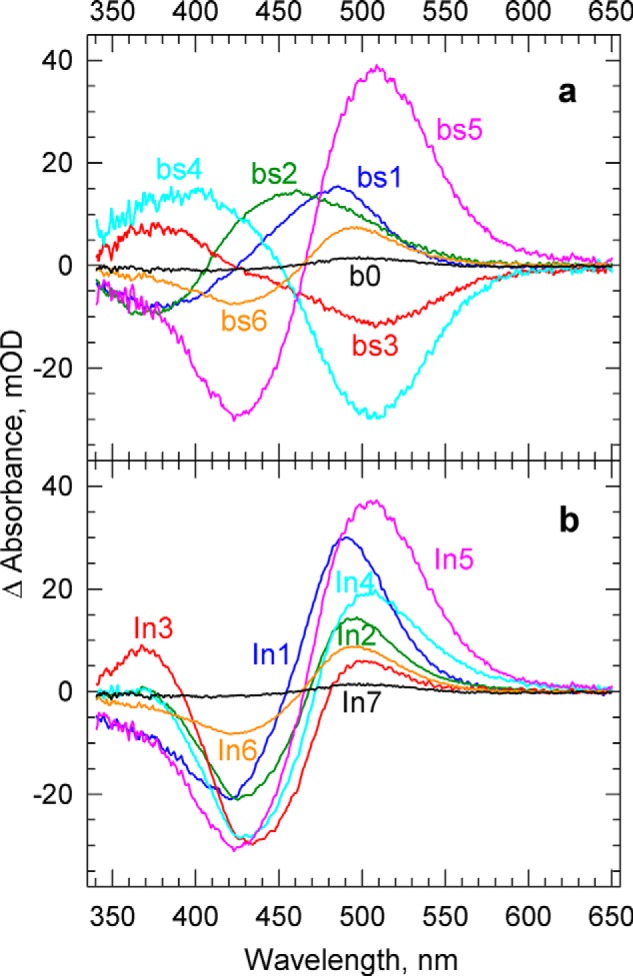
a, The b-spectra (amplitude spectra), bs1 to bs6, corresponding to the lifetimes of 0. 60, 5.3, and 170 μs, 1.4 and 6.7 ms, and 1.4 s found in the global exponential fit. The b0 is the spectrum of the final state in the experimental time window. b, spectra of the intermediates of the unidirectional sequential scheme calculated using the experimental lifetimes and b-spectra. mOD, milli-optical density.
Analysis of Sequential Scheme Intermediates
Identification of the Absorption Spectra of the Molecular States in the Sequential Intermediates
For a unidirectional sequential scheme, the apparent rates obtained in the exponential fitting become the rate constants of the reaction steps (microscopic rates), and the b-spectra are easily converted into the spectra of the sequential intermediates (17). The sequential intermediate spectra obtained from the experimental b-spectra are presented in Fig. 3b. Because the spectrum of the unphotolyzed form (the bleach) appears as a large negative component in the difference spectra of the sequential intermediates, it is difficult to see how they are constituted in terms of individual molecular states. Adding back the bleach to produce the absolute spectra, however, is not a trivial procedure because the amount of the bleached dark form is not known.
To circumvent this missing information, we made use of a general rule observed in connection with the shapes of the intermediate spectra of proteins having the same type of chromophore with many degrees of vibrational freedom. We call it the rule of similar spectral shapes, and have applied it successfully not only to retinal proteins (18) but also to heme proteins (19). The observation is that spectra of molecular states having absorption maxima at different wavelengths have different widths when viewed on a wavelength scale, but they become very similar in shape when plotted on an energy (wavenumber) scale. Therefore, spectra of the different molecular states, plotted on the energy scale, can be overlaid by simply shifting one of them. Usually, the dark forms undergoing phototransitions are considered molecular states, and their spectra serve as reference for the other states. The rule might be the reflection of the very limited and localized changes in the chromophore vibronic spectra between the different intermediate states, as reported by resonance Raman and IR spectra of BR and bovine rhodopsin.
We applied this rule to Intermediate1 (In1) and In5 of the sequential scheme, which exhibit well defined, and relatively narrow, positive and negative lobes in their difference spectra (Fig. 3b) and are likely to represent individual molecular states, specifically the K and O states (following BR nomenclature). To find the amount of required bleach, different amounts of the unphotolyzed (dark) spectrum were added to the difference spectra of these intermediates, and the resulting absolute spectra were compared on the energy scale. Fig. 4a displays the spectra on the more familiar wavelength scale and shows that 0.27 fraction of the dark spectrum is a plausible choice for the bleach. The spectrum of In1 was shifted on the energy scale to overlay with the spectrum of In5, and its amplitude was normalized (reduced) for easier comparison. Note that the absorption in the main band in the visible part of the spectrum and that in the near UV between 350 and 400 nm belong to different transitions and that the ratio of their amplitudes is somewhat different for the K and O states. This leads to small differences between the two spectra in the blue region after amplitude normalization in the visible part of the spectrum. Adding back the same amount of dark spectrum to each of the sequential intermediate difference spectra, shown in Fig. 3b, resulted in the absolute spectra shown in Fig. 4b. The spectra of In1 and In5 have the same spectral features as the ground form, and thus are acceptable for the K and O states.
FIGURE 4.
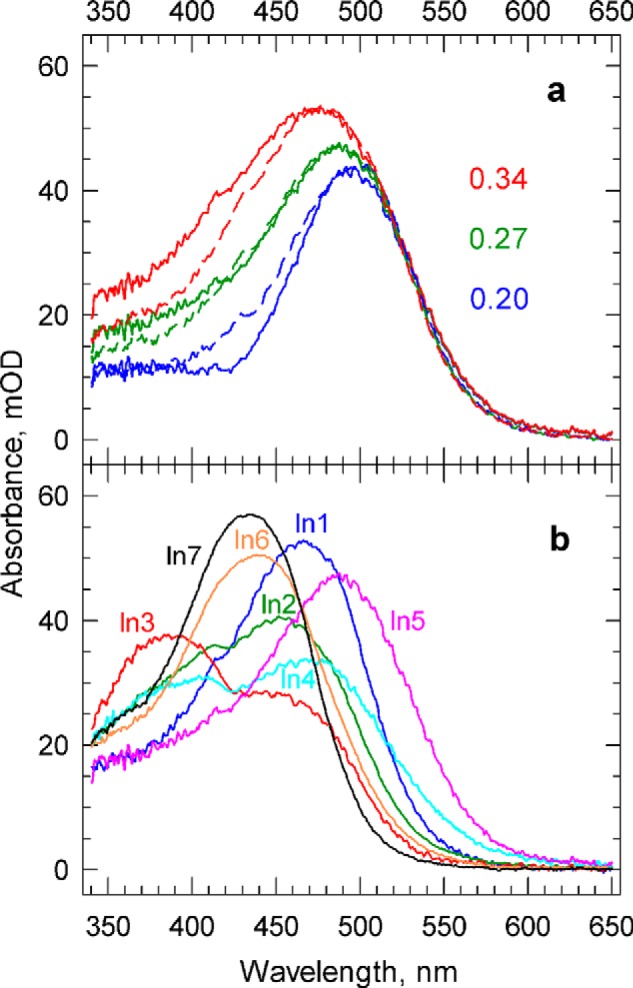
a, determining the fraction of the photobleached PsChR2. Comparison of In5 (solid lines) and In1 (broken lines) spectra after adding back the 0.2, 0.27, and 0.34 fractions of the unphotolyzed PsChR2 spectrum is shown. The In1 spectra are shifted on the energy scale and normalized to match the position and amplitude of the In5 spectra. Based on the similarity of the spectral widths, the 0.27 fraction of the unphotolyzed PsChR2 spectrum is selected as the bleach spectrum. b, absolute spectra of the intermediates of the unidirectional sequential scheme calculated by adding back the 0.27 fraction of the unphotolyzed PsChR2 spectrum. mOD, mean optical density.
The absolute spectrum of the sixth sequential intermediate, In6, seemingly represents a single state. However, a closer examination of its shape reveals that this spectrum lacks the “symmetry” seen in the other molecular spectra. Although the lobe on the blue side follows the slope of the neighboring In1 and In7, the lobe on the red side shows an unusual broadening of the spectrum, suggesting the presence of two spectral forms in In6. Judging from its position and shape, the dominant contributor is most likely the added dark spectrum, which would indicate that in In6 a large fraction of the photolyzed PsChR2 has already recovered. Superimposed on the dark spectrum is a red-shifted spectrum of smaller amplitude. To obtain the latter spectrum, we followed the rule of similar spectral shapes mentioned above. Different fractions of the dark spectrum were added to the difference spectrum of In6, and the resulting absolute spectra were compared with the energy-shifted and normalized spectrum of the K state as shown in Fig. 5a. It is seen that a good agreement between the two intermediate spectra is reached for the 0.3 fraction. A lower fraction, 0.2, leads to a narrower spectrum, and a higher fraction, 0.4, produces a broader spectrum when compared with the K spectrum. Because this intermediate follows the O state, we call it the P state.
FIGURE 5.
a, determining the unrecovered fraction of the photolyzed PsChR2 present in In6. Comparison of the absolute spectra of In6 (solid lines) created by adding 0.2, 0.3, and 0.4 fractions of the bleach with the corresponding energy-shifted absolute spectrum of In1 (broken lines) shows 30% unrecovered material and 70% recovered PsChR2 in In6. b–d, decomposition of the absolute sequential intermediates In2, In3, and In4 into the spectra of the molecular states K, L, M, and O. Broken lines show the sum of the components in the respective intermediate spectra. mOD, milli-optical density.
It is quite clear that In2 and In3 do not represent individual molecular states. Rather, they are composite spectra of K and M, and a third state, which, in accordance with the BR nomenclature, we call the L state. The spectrum of In4 is even more complex, and it is likely to contain the O state in addition to the spectra of the three states mentioned. The absolute spectra of In2, In3, and In4 were decomposed into the sum of the K, L, M, and O spectral states, as shown in Fig. 5, yielding the fraction values listed in the corresponding columns of the composition matrix (Table 1). For the decomposition, the K and O spectra are taken directly from the corresponding intermediates, and the overall shape of the M spectrum is chosen to be analogous to the ones seen in the BR and bovine bleached difference spectra. The amplitude of the M spectrum and the unknown L spectrum is an average obtained from decomposing In2, In3, and In4 spectra (subtracting K, M, and O) while maintaining a composition balance, avoiding negative absorbances and forcing the shape of L to be similar to the shape of the protein's dark spectrum. Small wiggles outside the main band of the L spectrum were also removed.
TABLE 1.
Composition of the sequential intermediate spectra in terms of molecular states
| In1 | In2 | In3 | In4 | In5 | In6 | |
|---|---|---|---|---|---|---|
| K | 1.00 | 0.56 | 0.36 | 0.18 | ||
| L | 0.24 | 0.19 | 0.17 | |||
| M | 0.20 | 0.45 | 0.23 | |||
| O | 0.42 | 1.00 | ||||
| P | 0.30 | |||||
| R | 0.70 |
The absolute spectra of the five molecular states named K, L, M, O, and P derived above, together with the recovered PsChR2 spectrum, R, and the bleach are shown in Fig. 6a. Although these molecular spectra obey the “rule of similar spectral shapes” approximately, their shapes are not identical.
FIGURE 6.
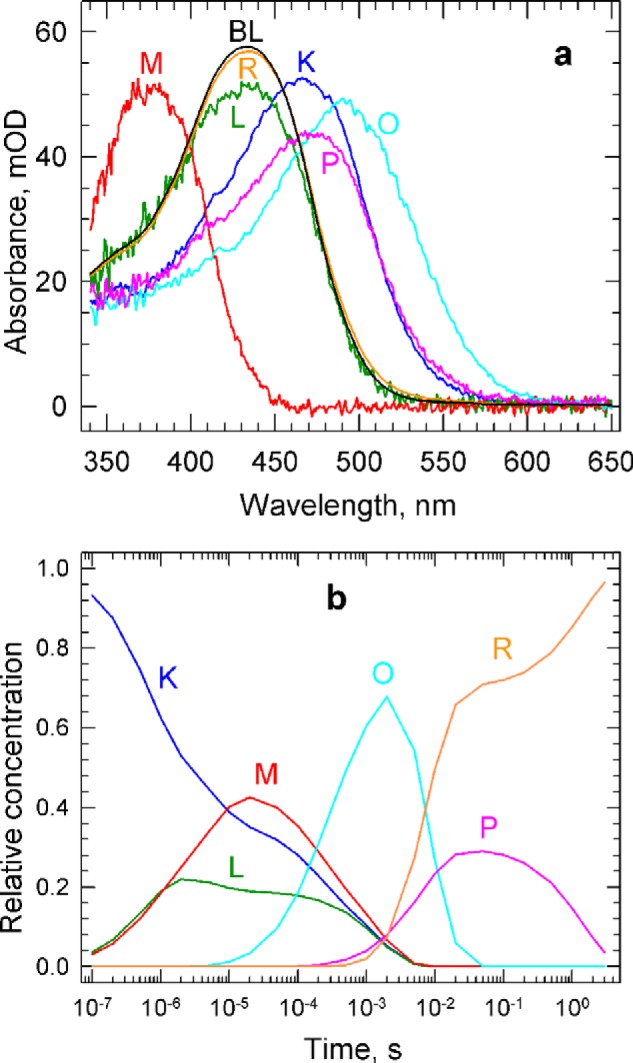
a, the spectra of the K, L, M, O, and P molecular states obtained by decomposing the absolute spectra of the sequential intermediates, and the spectra of the recovered PsChR2 and the bleach. mOD, mean optical density. b, the time dependence of the relative concentrations of the molecular states. The concentration profiles were calculated based on the composition matrix of the sequential intermediates and the apparent rates in the sequential scheme.
Note that the amount of the added dark spectrum has no influence on the fraction values of the molecular states present in each of the sequential intermediates. It does, however, contribute to the shapes of their absolute spectra. Using the absolute spectra in the spectral decomposition was merely a convenience to recognize the possible spectral components in the sequential intermediates; the same fractional values are obtained from decomposing the difference spectra of the sequential intermediates. The fraction of P in In6, however, depends on the amount of added dark spectrum.
Kinetics of Molecular States in the Photocycle
Based on the composition matrix, the time evolution of the molecular states during the reaction can be calculated in the following way. The absorption data matrix is the sum of the contributions by the n intermediates
where the In(λ,n) matrix contains the absorption spectra and the cin(n,t) matrix contains the concentrations of the sequential intermediates. The spectra of sequential intermediates are combinations of the spectra of the molecular states
where E(λ,m) is the matrix containing the spectra of the m molecular states and Q(m,n) is the composition matrix. Note that the number of sequential intermediates may be different from the number of molecular states. Multiplying the composition matrix with the matrix of intermediate concentrations gives the time-dependent concentrations, cm(m,t), of the m molecular states.
The time dependence of the concentrations of the K, L, M, O, and P states, together with the recovered PsChR2, R, are depicted in Fig. 6b. This figure shows the establishment of an equilibrium between the K, L, and M states at the beginning of the photocycle and the way this equilibrium transforms into a different one on the microsecond time scale before converting into the O form. It shows also a complex, two-step recovery of the bleached PsChR2. A fraction of the O state converts into the P state before recovering, whereas a larger fraction of the O state recovers directly into R.
Discussion
One Cycle Is Not Sufficient to Describe the Kinetics of PsChR2 Photoreactions
Some of the intermediate spectra of the unidirectional sequential scheme apparently contain the spectra of several molecular states. The intermediates in this scheme cannot be regarded as single molecular states interconnecting in a sequential manner. Rather, the intermediates of the scheme are artificial products created by the kinetic analysis. Therefore, this scheme is not adequate to describe the photoreaction kinetics of PsChR2 on the molecular level. Whether the scheme can be improved sufficiently by introducing reversible steps, and/or branches, needs to be examined. Our approach in searching for potential schemes is based on interpreting each one of the b-spectra as a fragment of the kinetic scheme (17). The scheme is constructed by fusing these fragments into a single reaction chain, or into parallel ones, if a single chain cannot accommodate all the fragments. The presence of branching, reversible steps or side equilibria, off-pathway steps and slow-fast step combinations in a kinetic mechanism leaves behind characteristic signatures or patterns in the b-spectra. These patterns are easily recognized in the b-spectra belonging to well separated lifetimes (17), as in this study, and thus many of the possible schemes can be deduced by examining the b-spectra. Concomitantly, the schemes that are inconsistent with the pattern seen in the b-spectra can be rejected.
In sorting out the kinetics, we rely on both the sequential intermediates and the b-spectra. The interpretation of the b-spectra corresponding to transitions in a sequential scheme is relatively simple; everything that decays in the transition contributes to the spectrum with positive sign, and the components that form in the transition contribute with negative signs. The sum of the fractional values of all contributions is zero. Because of this, the analysis is independent of the amplitude of the dark pigment spectrum added to create the absolute spectra of the molecular states considered in analyzing the b-spectra. The presence of the K, L, and M states in In2 and In3 shows that the three states are connected via reversible steps and that the equilibria are established in less than 10 μs, with the 0.60- and 5.3-μs lifetimes. A comparison between bs1 and bs2 suggests that the K state converts into a mixture of L and M states with the 0.60-μs process, and mostly into the M state in the 5.3-μs transition. Both bs3 and bs4 show the formation of the O state, and thus the conversion is partial in the faster 170-μs process and becomes full after the 1.4-ms process is completed and In5 becomes a pure O state. The two-component rise of O is not easily reconciled with a single O state. Moreover, the faster transition seen in bs3 suggests that a mixture of the K and M states converts to the O state with a lifetime of 170 μs, whereas bs4 shows the decay of a K, L, and M mixture into the O state later with a 1.4-ms lifetime. The decay of two different equilibrated mixtures, formed in less than 10 μs, into the O state(s) suggests two reaction pathways. If there were only a single reaction chain, the same equilibrated mixture should decay in all processes that follow the establishment of that equilibrium. The shapes of bs3 and bs4 thus argue for a molecular mechanism that has two chains of reactions. Because of this, the reaction mechanism cannot be solved by turning the unidirectional sequential scheme into a more complex single chain scheme. In addition to the b-spectra, the concentration time dependence of the molecular states in Fig. 6b provides the clue to setting up a two-cycle reaction mechanism. Because only 30% of the photolyzed PsChR2 goes through the P state, the single chain contained in the straight sequential scheme should be split into 0.3 and 0.7 fractions at some point in the reaction sequence. Because the O spectral state builds up in two steps, and in these steps it comes from two different mixtures of the K, M, and L states, the splitting occurs most likely at the K state or even earlier, in the unphotolyzed form. Interestingly, the all-trans and 13-cis chromophore content of the unphotolyzed PsChR2 is around 75 and 25%, respectively (15), which is very similar to the fractions mentioned. Moreover, the ratio of retinal isomers is the same in dark and light, and thus PsChR2, similarly to CrChR2 (10), does not show any significant light-dark adaptation, and both isomers are likely to be photoexcited simultaneously.
Modeling Strategy
The kinetic analysis is carried out on a set of time-dependent absorption spectra, which themselves are the product of two unknown quantities: the spectra and the concentrations of the true intermediates. To do the analysis, one of the two unknowns must be obtained from some other source, or at least constrained within certain limits. We have far more information regarding what kind of spectra are acceptable for intermediate molecular states than judging what reaction rates are unacceptable in protein kinetics. Indeed, the spectra of the K, L, M, O, and P states discussed above were derived in accordance with the spectral information available on retinal proteins, and thus they constitute the fixed part of our modeling. The sequential intermediates discussed above may belong to only one or both of the, yet unknown, photocycles, yet they were adequately reconstituted with a single set of molecular spectra. This strongly suggests that the molecular states in the two photocycles have the same or very similar spectra.
Based on the time-dependent concentration profiles of the molecular states in Fig. 6b, we can assume, as a starting point, similar mechanistic schemes for the two photocycles. The schemes start with fast equilibrations between the K, L, and M states on the microsecond time scale, which is followed by conversion of the equilibrated mixtures into the O state with different lifetimes in the two cycles. Finally, the O state converts directly into the recovered state in one cycle and indirectly via the P state in the other cycle.
The Algebraic Method of Kinetic Modeling
There are different approaches in kinetic modeling of time-dependent absorption data. The algebraic method of kinetic analysis (17), combined with the singular value decomposition-based global exponential fitting discussed above, dissects the kinetics and reveals the connections between the microscopic rates and the transitions seen in the exponential fitting. The analysis starts with designing the scheme and setting up the kinetic matrix of the microscopic rates based on the apparent rates found in the global exponential fitting of the experimental data. The eigenvalues of the kinetic matrix are expected to match the experimental apparent rates. The eigenvectors show how the intermediates of the proposed scheme contribute spectrally to the absorption changes seen in each transition and how that can be compared with the corresponding experimental b-spectra. Thus the advantage of this approach is that the proposed scheme can be evaluated at every step and modified without performing a large number of trial fitting procedures.
Both photocycles in our model contribute to the total absorption. Each contribution can be calculated based on the spectra, E(λ,m), of the m molecular states involved in the cycle, combined with the eigenvalues, α(m,1), and the eigenvector matrix, w(m,m), of the corresponding kinetic matrix, K(m,m). The eigenvalues and eigenvectors are obtained solving the well known equation: (K − I × α)w = 0, where I is the identity matrix. The dimensions of the matrices involved are shown in parentheses. The sum of the contributions by Cycle 1 and Cycle 2 can be written as follows.
 |
Comparing this expression for the time dependence of the total absorption by the two cycles with the one for the global exponential fitting of the experimental data shown earlier, it is evident that E1 × w1 and E2 × w2 are the individual contributions by each of the cycles to the b-spectra. When summing up the contributions by the two cycles, we take into account that the number of b-spectra, n, and the number of molecular states involved in any one of the cycles, m1 and m2, could be different, and the cycles may contribute jointly or individually to the observed experimental transition or b-spectra. The two-cycle model can be considered a valid one if it reproduces the six apparent rates and seven experimental b-spectra obtained in the global exponential fit of the experimental data. Obviously, all other quantities, including the data, the sequential intermediate spectra, and the time-dependent concentrations of the molecular states depicted in Figs. 1, 3 and 6, respectively, will be simultaneously reproduced. For the spectra of the molecular states in the model, we use the spectra of the K, L, M, O, and P states, as well as the spectrum of the recovered PsChR2, R, established above.
The Two-cycle Model
One of the cycles is set up to describe the conversion of the 0.3 fraction of the first sequential intermediate, K, to a mixture of K, L, and M in two steps having lifetimes of 0.60 and 5.3 μs, followed by the conversion of the final mixture into the O state with 170 μs, and then converting to the P state with 6.7 ms, and finally recovering with a lifetime of 1.4 s. In the other cycle, the remaining 0.7 fraction of K converts to a mixture of K, L, and M states with the two shortest lifetimes mentioned. Then the final mixture decays into the O state with a lifetime of 1.4 ms. This finally recovers with a 6.7-ms lifetime without a P state at the end of the cycle.
Fitting a model to experimental data is always driven by the errors of the fit. In this case, this includes the errors in reproducing the experimental lifetimes through the eigenvalues, the experimental b-spectra through the product of the eigenvectors of the kinetic matrix and the spectra of the molecular states. In the case of a complex model, such as the two-cycle model discussed here, the total number of eigenvalues and eigenvectors produced by the model may exceed the number of apparent rates and b-spectra obtained in the exponential fit. The exponential fit has its own practical limitations due to the experimental noise present in the data. It can easily occur that similar spectral changes with somewhat different rates, coming from the underlying complex mechanism, may not be resolved as separate transitions; rather they will be reported as a single spectral change with an average lifetime. The slight misfit it may leave behind in the residual matrix of the exponential fit will be hard to distinguish from the experimental noise. Considering these limitations in the fitting process, we selectively weighted the errors in reproducing the lifetimes by the eigenvalues, allowing a range of values close to the experimental apparent lifetime when both cycles contributed to the same b-spectrum, while putting a tighter restriction on reproducing the shape of the experimental b-spectra.
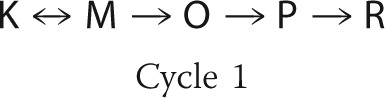
Because of the reversibility of the steps involved, the conversion between intermediates K, L, and M in the model can be arranged in more than one way. The first b-spectrum in Fig. 3a shows that the L and M states form simultaneously from the K state. Although a slow-fast step combination with a reversible second step between L and M is consistent with the shape of bs1 (17), we will not pursue this interpretation further because it requires an unusually fast deprotonation of the Schiff base, which is physically unlikely, and bs2 can only be explained by invoking additional intermediates. The simplest interpretation of this b-spectrum is a branched, reversible decay of K to L and M in the first step with L on the side of the reaction chain. The final equilibrium between these three states is reached in the second step. Based on the first two b-spectra alone, it is difficult to make any conclusion regarding the decay path of the K state in the individual cycles. The shape of the third b-spectrum is far more informative in this respect because it displays the decay of the K and M states to the O state with little or no L involvement. This 170-μs transition was assigned to the first cycle and, indeed, this cycle did not produce the L state in any significant amount in the preliminary fits. Therefore, the first cycle was simplified by omitting the L side equilibrium from its scheme. Thus the L state is produced entirely in the second cycle. When a fast equilibrium, between the K, L, and M states in our case, is followed by a significantly slower irreversible step, the 170-μs and 1.4-ms transitions in this study, a number of alternative schemes are mathematically feasible with the experimental data. The irreversible step can be connected to any one of the intermediates in the equilibrium. Following the BR intermediate order, we originate the O state from the M state. The final mechanistic schemes used in the two-cycle model are shown as Cycle 1 and Cycle 2.
 |
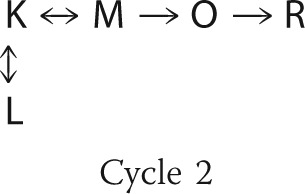 |
In each step of the fitting process, first the kinetic matrices for each of the cycles, K1 and K2, are constructed based on the microscopic rate constants involved, and then the eigenvalues, α1 and α2, and eigenvectors, w1 and w2, of the kinetic matrices are calculated using the formula shown above. The b-spectra produced by Cycle 1, bs1, and by Cycle 2, bs2, are obtained by multiplying the matrix of the molecular state spectra with the eigenvector matrices of the individual cycles. The quality of the fit is then judged by comparing the eigenvalues with the corresponding experimental apparent rates and comparing the b-spectra contributions with the experimental b-spectra. The microscopic reaction rates obtained for the two cycles are included in Table 2. The individual b-spectra produced by Cycle 1 and Cycle 2 are shown in Fig. 7, a and b, respectively. The first experimental apparent rate and b-spectrum, corresponding to the 0.60-μs lifetime, is the product of Cycle 2 alone with an actual lifetime of 0.68 μs; Cycle 1 does not contribute to it. It shows simultaneous decay of the K state into the L and M states in two branched reversible steps in Cycle 2 (Fig. 7b, blue curve). Note that the microscopic rates in the reversible steps have similar values, and in situations like this, the classical rule that the apparent rate equals the sum of the forward and backward rates no longer applies. Neither is the apparent rate the sum of the rates in the branching steps. Note also that in a reversible step, only a fraction of the total number of molecules is actually converted; therefore the amplitude of bs21 is smaller than it would have been in an irreversible transition. Both cycles are involved in the second experimental transition (Fig. 7, a and b, green curves). It appears that none of the cycles, however, match the experimental apparent lifetime of 5.3 μs. Cycle 1 has a somewhat longer lifetime, 7.7 μs, and Cycle 2 has a shorter lifetime, 2.4 μs. Cycle 1 shows the reversible K to M transition, the first step in the chain, without the involvement of the L form. Because this reversible step in Cycle 1 is followed by a slower irreversible one, the sum of the rates in the reversible step is a close match to the value of the apparent rate. Cycle 2 shows only a small spectral change, similar in shape to the one of Cycle 1, representing the readjustment of the quasi-equilibrated mixture formed in the earlier transition. The sum of the contributions by the two cycles, the reproduced b-spectrum, is in good agreement with the experimental second b-spectrum. As already mentioned above, the restrictions on reproducing the experimental apparent rate by the cycles were deliberately relaxed to achieve a good fit to the b-spectra when both cycles contribute to the transition. The experimentally observed transition is interpreted as the sum of the spectral changes produced by the two cycles detected with a single, average lifetime. Cycle 1 alone is involved in the 170-μs transition, with 160 μs as the actual lifetime (Fig. 7a, red curve). The shape and amplitude of this bs3 spectrum indicates the decay of the K and M mixture, formed in the previous step, into the O state. Cycle 2 alone is responsible for the 1.4-ms process, with an actual lifetime of 1.3 ms. This bs4 spectrum is similar in shape to bs3 except that it contains the decaying L state in addition to the K and M states (Fig. 7b, cyan curve). Both cycles produce similar O intermediate states, which simultaneously decay with lifetimes close to 6.7 ms. In Cycle 1, the O state converts into the P state with a 6.4-ms lifetime (Fig. 7a, pink curve), which itself produces the recovered state later with a 1.4-s lifetime (Fig. 7a, orange curve). Cycle 2 skips the P state and converts directly into the recovered form with a lifetime of 7.0 ms (Fig. 7b, pink curve). Fig. 7c compares the combined reproduced b-spectra of the two cycles (solid lines) with the b-spectra obtained in the exponential fit of experimental data (broken lines).
TABLE 2.
Microscopic reaction rates of Cycle 1 and Cycle 2
| K → L | L → K | K → M | M → K | M → O | O → P | O → R | P → R | |
|---|---|---|---|---|---|---|---|---|
| Cycle 1 | 7.51 × 10⁴ | 4.97 × 10⁴ | 1.08 × 10⁴ | 155 | 0.71 | |||
| Cycle 2 | 5.55 × 10⁵ | 6.34 × 10⁵ | 3.90 × 10⁵ | 3.17 × 10⁵ | 1.88 × 10³ | 144 |
FIGURE 7.
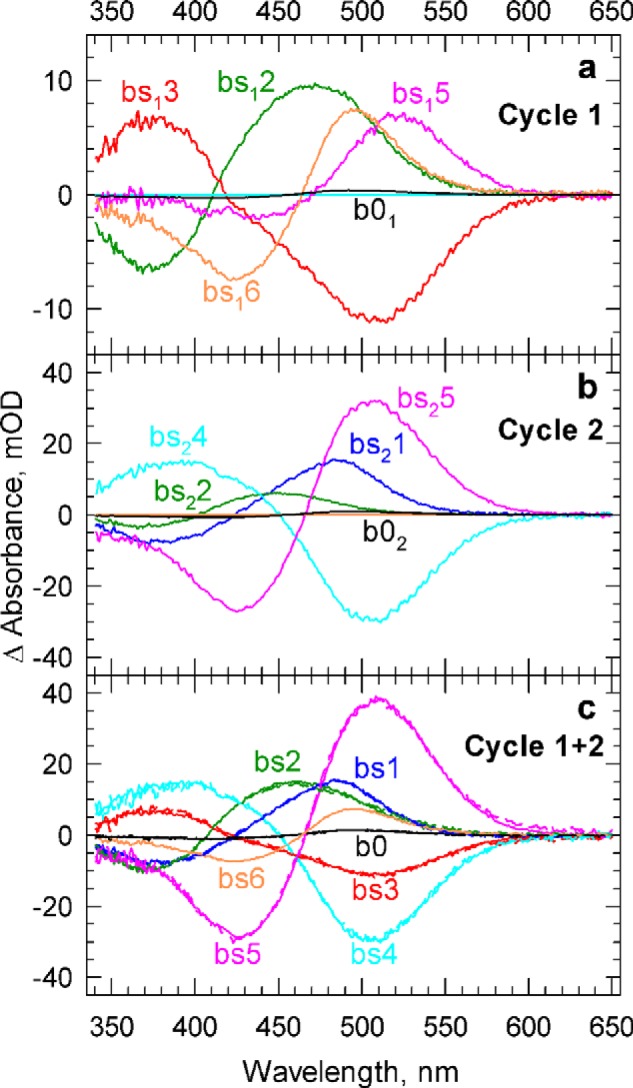
a and b, the contributions of Cycle 1 (a) and Cycle 2 (b) to the b-spectra. c, the sum of the contributions of the two cycles is compared with the experimental b-spectra (solid and broken lines, respectively). mOD, milli-optical density.
The evolution of the molecular events represented by Cycle 1 and Cycle 2 discussed above are best visualized in Fig. 8, a and b, respectively, where the time dependence of the concentrations of the molecular states are shown. Fig. 8c compares the combined concentration profiles of the molecular states reproduced by the two-cycle model (solid lines) with the ones obtained from the decomposition of the sequential intermediate spectra (broken lines). The latter was already shown in Fig. 6. Cycle 1 has a slower beginning, suggesting that the involvement of the L state in Cycle 2 makes the Schiff's base deprotonation easier. Comparing the cyan curves in Fig. 8, a and b, shows that the next step, conversion to the O state, however, is faster and easier without the involvement of the L state. The O states in the two cycles decay with the same rate but follow different paths. In Cycle 1, the formation of the P state precedes the final recovery step, whereas Cycle 2 quickly recovers to the final PsChR2 state. There is an interesting pattern of alternating rate combination, slow/fast/slow in Cycle 1 and fast/slow/fast in Cycle 2, seen in the kinetics.
FIGURE 8.
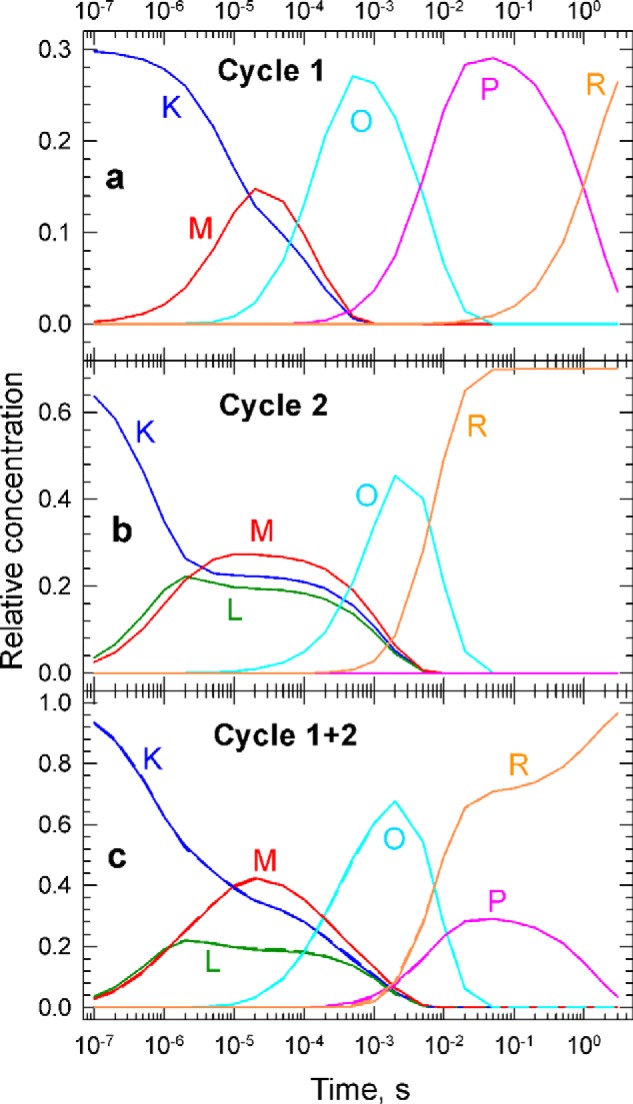
a and b, the concentration profiles of the molecular states in Cycle 1 (a) and Cycle 2 (b) calculated based on the set of microscopic rate constants contained in the corresponding cycles. c, the concentration profiles for the sum of the two cycles are compared with the experimental concentration profiles obtained from the decomposition of the sequential intermediate spectra (solid and broken lines, respectively).
Contributions by the Cycles to the Sequential Intermediate Spectra
Multiple cycles can be handled with relative ease using the algebraic kinetic analysis method. When the global exponential fitting is performed without the assumption of a kinetic mechanism, as done above, the experimental b-spectra appear as sums of the contributions by the cycles. This makes the modeling a relatively straightforward task. Although the sequential scheme is a very useful tool in determining the general features of the kinetics, and in sorting out the different spectral forms present in the data matrix, it is not the optimal basic tool in mechanistic modeling for the treatment of multiple cycles. The reason is that the individual sequences of the two cycles are usually shifted in time relative to each other and cannot be simply summed up to combine the cycles. For instance, the K state in Cycle 2 decays earlier than in Cycle 1, or the O state in Cycle 1 appears earlier than in Cycle 2, as seen in Fig. 8, a and b. Moreover, the sequential scheme derived from the experimental data has seven intermediates, two more than the individual cycles have, and therefore a direct comparison between the model and experiment, based on the reaction sequences, cannot be made. Before summing up the contributions made by Cycle 1 and Cycle 2, they have to be converted into the longer, seven-member cycle determined by the experimental apparent rates. Fig. 9 shows the contributions by Cycle 1 and Cycle 2 to the intermediates of the sequential scheme after converting both cycles to this seven-member common sequence, Fig. 9, a and b, respectively. Fig. 9c compares the sum of cycle contributions (solid lines) to the experimental sequential intermediates (broken lines). Cycle 1 in Fig. 9a displays similar, but not equal, spectral contributions to the sequential intermediates In1 and In2 because the cycle is silent in the first, 0.60-μs, transition. Following the concentration profiles depicted in Fig. 8, it can be seen that the decrease in amplitude is due to the small progression of the 5.3-μs K to M transition in Cycle 1. Similar arguments apply to the O state in intermediates In4 and In5. Cycle 1 has already converted slightly into the P state, and because of that, it contributes less to In5, when the O state in Cycle 2 reaches its peak concentration. Cycle 2 is silent in the 170-μs transition. Therefore it shows similar, but not equal, contributions to In3 and In4. Again, the small change in amplitude is caused by the progression of the 1.4-ms formation of the O state in Cycle 2. Because Cycle 2 terminates earlier than the 1.4-s transition in Cycle 1, its contributions to In6 and In7 are the same.
FIGURE 9.
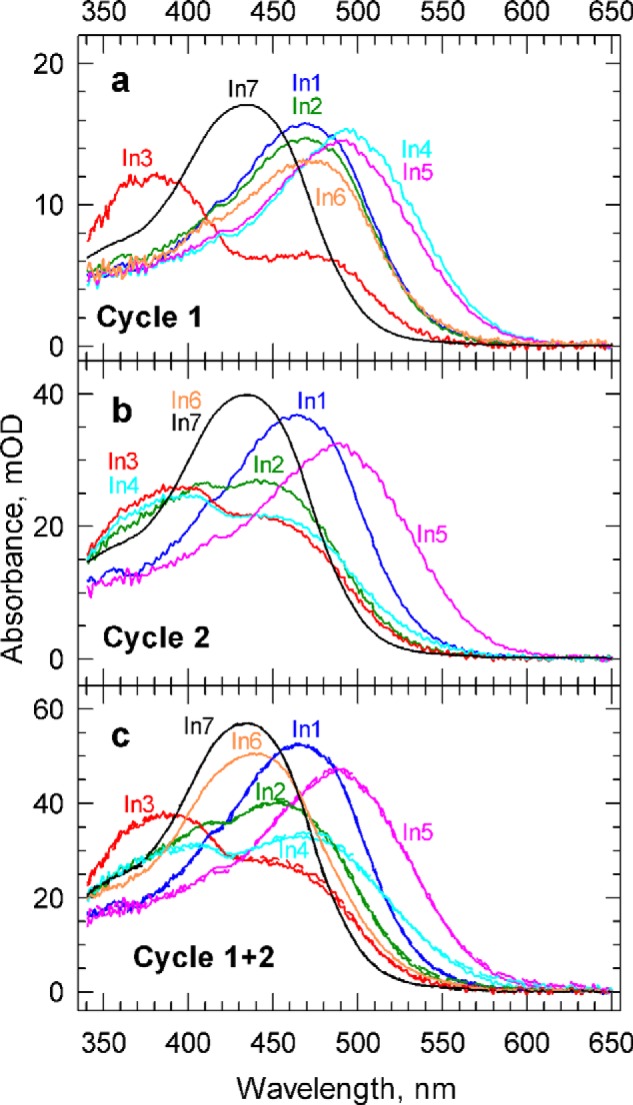
a and b, the contributions of Cycle 1 (a) and Cycle 2 (b) to the spectra of the sequential intermediates. c, the sum of the contributions (solid lines) is compared with the experimental intermediate spectra (broken lines). mOD, milli-optical density.
The above analysis of the cycle contributions indicates that the assignment of In5 to the O state was not entirely correct, making it necessary during the modeling to make small adjustments to the spectra of the molecular intermediates to improve the quality of the fit to the b-spectra. An additional slight improvement in the fit was also observed if different K and O spectra were used for these states in the two cycles. These spectra were produced by shifting the original spectra by 2–3 nm to the red for Cycle 1 and to the blue for Cycle 2. Because the changes caused by these spectral alterations were not significant, we do not present and discuss them in any further details.
Conclusions
The kinetic analysis presented here shows that two parallel photocycles, shown in Fig. 10, occur simultaneously during the PsChR2 photoreactions. Cycle 1 comprises 30% of the photoproducts and involves K, M, O, and P states before terminating in the recovered form, whereas 70% of the photoexcited molecules go through K, L, M, and O molecular states in Cycle 2. The conversion between the K, L, and M states is reversible and completed in microseconds. The O state in Cycle 1 forms in 170 μs and decays to the P state in the 6.7-ms transition. The P state itself decays in 1.4 s. In Cycle 2, the O state forms in 1.4 ms and decays in the 6.7-ms transition. Because of the existence of two distinct concurrent photocycles, most of the classical sequential intermediates, named based on their similarity to those of well studied microbial rhodopsins and calculated as if belonging to a single cycle from exponential fits to the experimental data, represent mixtures of molecular states generated during the photochemical reactions and are not adequate to describe the photochemistry on the molecular level. Moreover, if a single photocycle is assumed, the number of sequential intermediates exceeds the number of molecular states because the formation rates of the latter are different in the two cycles. This creates artificial transitions between states belonging to the two different photocycles, which would result in a false appearance of molecular events in the single-cycle sequential mechanism.
FIGURE 10.
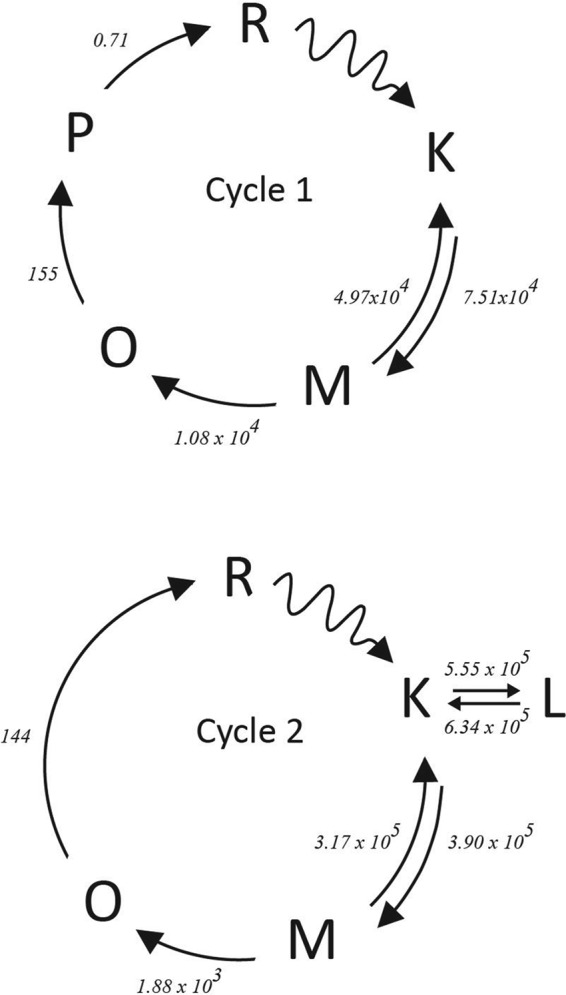
Cycle 1 and Cycle 2. Rate constants for each microscopic step are shown by the appropriate arrow linking the different intermediates. The wavy arrows indicate steps initiated by light. Time constants are in units of s−1.
The origin of the parallel photocycles is not known. The two cycles may reflect the presence of two chromophore-induced conformers in the unphotolyzed state of the PsChR2 protein given that the contributions of the two photocycles in PsChR2 are similar to the fractions of the protein with all-trans and 13-cis chromophores (15). Alternatively, the two cycles may be due to the presence of two differently folded protein conformers irrespective of retinal configuration. In either case, identifying the two parallel photocycles and deriving them from time-dependent optical absorption data is an important perspective for the understanding of the molecular mechanisms of channelrhodopsins.
This research was supported by National Institutes of Health Grant R01EY000983 from the NEI (to D. S. K.) and by National Institutes of Health Grant R01GM027750 from the NIGMS, the Hermann Eye Fund, and Endowed Chair AU-0009 from the Robert A. Welch Foundation (to J. L. S.) The authors declare that they have no conflicts of interest with the contents of this article.
The originally named PsChR (15) is renamed PsChR2 based on the recent identification of a second, new ChR from the organism by homology cloning (E. G. Govorunova and J. L. Spudich, unpublished data). This newly found ChR has a spectrum that is red-shifted from that of the original ChR and, in analogy to the naming of C. reinhardtii ChRs, is designated PsChR1.
- ChR
- channelrhodopsin
- CrChR2
- Chlamydomonas reinhardtii channelrhodopsin-2
- PsChR2
- Platymonas subcordiformis channelrhodopsin-2
- BR
- bacteriorhodopsin
- In
- intermediate.
References
- 1. Sineshchekov O. A., Jung K. H., Spudich J. L. (2002) Two rhodopsins mediate phototaxis to low- and high-intensity light in Chlamydomonas reinhardtii. Proc. Natl. Acad. Sci. U.S.A. 99, 8689–8694 [DOI] [PMC free article] [PubMed] [Google Scholar]
- 2. Nagel G., Ollig D., Fuhrmann M., Kateriya S., Musti A. M., Bamberg E., Hegemann P. (2002) Channelrhodopsin-1: a light-gated proton channel in green algae. Science 296, 2395–2398 [DOI] [PubMed] [Google Scholar]
- 3. Nagel G., Szellas T., Huhn W., Kateriya S., Adeishvili N., Berthold P., Ollig D., Hegemann P., Bamberg E. (2003) Channelrhodopsin-2, a directly light-gated cation-selective membrane channel. Proc. Natl. Acad. Sci. U.S.A. 100, 13940–13945 [DOI] [PMC free article] [PubMed] [Google Scholar]
- 4. Boyden E. S., Zhang F., Bamberg E., Nagel G., Deisseroth K. (2005) Millisecond-timescale, genetically targeted optical control of neural activity. Nat. Neurosci. 8, 1263–1268 [DOI] [PubMed] [Google Scholar]
- 5. Chow B. Y., Han X., Boyden E. S. (2012) Genetically encoded molecular tools for light-driven silencing of targeted neurons. Prog. Brain Res. 196, 49–61 [DOI] [PMC free article] [PubMed] [Google Scholar]
- 6. Deisseroth K. (2011) Optogenetics. Nat. Methods 8, 26–29 [DOI] [PMC free article] [PubMed] [Google Scholar]
- 7. Spudich J. L., Yang C. S., Jung K. H., Spudich E. N. (2000) Retinylidene proteins: structures and functions from archaea to humans. Annu. Rev. Cell Dev. Biol. 16, 365–392 [DOI] [PubMed] [Google Scholar]
- 8. Ernst O. P., Lodowski D. T., Elstner M., Hegemann P., Brown L. S., Kandori H. (2014) Microbial and animal rhodopsins: structures, functions, and molecular mechanisms. Chem. Rev. 114, 126–163 [DOI] [PMC free article] [PubMed] [Google Scholar]
- 9. Stehfest K., Hegemann P. (2010) Evolution of the channelrhodopsin photocycle model. Chemphyschem. 11, 1120–1126 [DOI] [PubMed] [Google Scholar]
- 10. Lórenz-Fonfría V. A., Heberle J. (2014) Channelrhodopsin unchained: structure and mechanism of a light-gated cation channel. Biochim. Biophys. Acta 1837, 626–642 [DOI] [PubMed] [Google Scholar]
- 11. Bamann C., Kirsch T., Nagel G., Bamberg E. (2008) Spectral characteristics of the photocycle of channelrhodopsin-2 and its implication for channel function. J. Mol. Biol. 375, 686–694 [DOI] [PubMed] [Google Scholar]
- 12. Verhoefen M. K., Bamann C., Blöcher R., Förster U., Bamberg E., Wachtveitl J. (2010) The photocycle of channelrhodopsin-2: ultrafast reaction dynamics and subsequent reaction steps. Chemphyschem. 11, 3113–3122 [DOI] [PubMed] [Google Scholar]
- 13. Lórenz-Fonfría V. A., Resler T., Krause N., Nack M., Gossing M., Fischer von Mollard G., Bamann C., Bamberg E., Schlesinger R., Heberle J. (2013) Transient protonation changes in channelrhodopsin-2 and their relevance to channel gating. Proc. Natl. Acad. Sci. U.S.A. 110, E1273–E1281 [DOI] [PMC free article] [PubMed] [Google Scholar]
- 14. Ritter E., Piwowarski P., Hegemann P., Bartl F. J. (2013) Light-dark adaptation of channelrhodopsin C128T mutant. J. Biol. Chem. 288, 10451–10458 [DOI] [PMC free article] [PubMed] [Google Scholar]
- 15. Govorunova E. G., Sineshchekov O. A., Li H., Janz R., Spudich J. L. (2013) Characterization of a highly efficient blue-shifted channelrhodopsin from the marine alga Platymonas subcordiformis. J. Biol. Chem. 288, 29911–29922 [DOI] [PMC free article] [PubMed] [Google Scholar]
- 16. Hou S. Y., Govorunova E. G., Ntefidou M., Lane C. E., Spudich E. N., Sineshchekov O. A., Spudich J. L. (2012) Diversity of Chlamydomonas channelrhodopsins. Photochem. Photobiol. 88, 119–128 [DOI] [PMC free article] [PubMed] [Google Scholar]
- 17. Szundi I., Lewis J. W., Kliger D. S. (1997) Deriving reaction mechanisms from kinetic spectroscopy: application to late rhodopsin intermediates. Biophys. J. 73, 688–702 [DOI] [PMC free article] [PubMed] [Google Scholar]
- 18. Mooney V. L., Szundi I., Lewis J. W., Yan E. C., Kliger D. S. (2012) Schiff base protonation changes in Siberian hamster ultraviolet cone pigment photointermediates. Biochemistry 51, 2630–2637 [DOI] [PMC free article] [PubMed] [Google Scholar]
- 19. Szundi I., Kittredge C., Choi S. K., McDonald W., Ray J., Gennis R. B., Einarsdóttir Ó. (2014) Kinetics and intermediates of the reaction of fully reduced Escherichia coli bo3 ubiquinol oxidase with O2. Biochemistry 53, 5393–5404 [DOI] [PubMed] [Google Scholar]