

Background: MicroRNA-21 (miR-21) is an oncomiR in human hepatocellular carcinoma and is highly expressed in liver, but its regulation is uncharacterized.
Results: Dehydroepiandrosterone (DHEA) rapidly increases miR-21 transcription in HepG2 cells by activating G-protein-coupled estrogen receptor (GPER).
Conclusion: miR-21 transcription is regulated by DHEA through GPER.
Significance: GPER may be among the activators of miR-21 expression in human hepatocellular carcinoma.
Keywords: estrogen receptor, G-protein-coupled receptor (GPCR), gene transcription, microRNA (miRNA), microRNA biogenesis, hormones
Abstract
Little is known about the regulation of the oncomiR miR-21 in liver. Dehydroepiandrosterone (DHEA) regulates gene expression as a ligand for a G-protein-coupled receptor and as a precursor for steroids that activate nuclear receptor signaling. We report that 10 nm DHEA increases primary miR-21 (pri-miR-21) transcription and mature miR-21 expression in HepG2 cells in a biphasic manner with an initial peak at 1 h followed by a second, sustained response from 3–12 h. DHEA also increased miR-21 in primary human hepatocytes and Hep3B cells. siRNA, antibody, and inhibitor studies suggest that the rapid DHEA-mediated increase in miR-21 involves a G-protein-coupled estrogen receptor (GPER/GPR30), estrogen receptor α-36 (ERα36), epidermal growth factor receptor-dependent, pertussis toxin-sensitive pathway requiring activation of c-Src, ERK1/2, and PI3K. GPER antagonist G-15 attenuated DHEA- and BSA-conjugated DHEA-stimulated pri-miR-21 transcription. Like DHEA, GPER agonists G-1 and fulvestrant increased pri-miR-21 in a GPER- and ERα36-dependent manner. DHEA, like G-1, increased GPER and ERα36 mRNA and protein levels. DHEA increased ERK1/2 and c-Src phosphorylation in a GPER-responsive manner. DHEA increased c-Jun, but not c-Fos, protein expression after 2 h. DHEA increased androgen receptor, c-Fos, and c-Jun recruitment to the miR-21 promoter. These results suggest that physiological concentrations of DHEA activate a GPER intracellular signaling cascade that increases pri-miR-21 transcription mediated at least in part by AP-1 and androgen receptor miR-21 promoter interaction.
Introduction
Dehydroepiandrosterone (DHEA)4 and its sulfated derivative, DHEA-S, produced in the adrenal (1), is the most abundant endogenous circulating steroid hormone. Plasma DHEA-S and DHEA decline from a peak around age 20 (∼6 μm and 24 nm in women and 11 μm and 22 nm in men, respectively) to ∼1 μm DHEA-S and 7 nm DHEA in women and 2.5 μm DHEA-S and 6 nm DHEA in men ages 60–80 (2). DHEA is metabolized to androgens and estrogens. In rats DHEA induces hepatocellular tumors in a dose-, gender-, and strain-dependent manner (3). In contrast, treatment of HepG2 hepatocellular carcinoma (HCC) cells with 100–200 μm DHEA inhibited cell proliferation (4). DHEA is used as a non-Food and Drug Administration-regulated dietary supplement varying widely in preparation in the United States but as a hormone in Europe (5). Although beneficial effects of DHEA in mood disorders and cardiovascular disease in humans have been reported, the long term effects of DHEA remain unknown (5, 6).
The mechanisms of DHEA action remain to be fully elucidated. DHEA binds intracellular steroid/nuclear receptors, e.g. pregnane X receptor/steroid and xenobiotic receptor (PXR/SXR), estrogen receptors α and β (ERα and ERβ), and androgen receptor (AR) with Kd in the μm range (7). DHEA binds plasma membrane (PM) receptors in a cell-specific manner (7). In vascular endothelial cells, DHEA binds (Kd ∼ 49 nm) and activates specific PM-associated G-protein-coupled receptors (GPCR) leading to MAPK and endothelial nitric-oxide synthase activation (8, 9). In PC12 rat adrenal pheochromocytoma cells, DHEA or membrane-impermeable BSA-conjugated DHEA bound to “membrane DHEA binding sites” and rapidly (5–30 min) activated PI3K/AKT, Src, PKA, PKC, and MAPK pathways by interaction with the sigma-1 receptor (10).
Males have a 2–4-fold higher incidence of HCC than females (11), and estrogens are protective, whereas androgens are deleterious in animal models (for review, see Ref. 12). Studies showed that male 5α-reductase type 1 knock-out (5αR1−/−) mice were protected against dietary fat-induced HCC by decreased dihydrotestosterone (DHT) availability and glucocorticoid clearance (13). AR was increased in human HCC compared with normal livers and liver-specific ablation of AR reduced the incidence of carcinogen- and hepatitis B- induced HCC tumors in mice (14). A role for acetylcholine-activated AR in HCC migration and invasion was reported (15). The gender disparity in HCC may be due to higher interleukin-6 (IL-6) in males as 17β-estradiol (E2) inhibits IL-6 production (16). Other studies dispute this claim and implicate a role for Foxa1/2 in carcinogen-induced HCC in mice (12). E2-ERβ inhibited tumor-associated macrophage activation in orthotopic HCC xenografts in mice and inhibited Hepa1–6 HCC cell invasion (17). Thus, although yet unresolved, E2 appears to act through multiple mechanisms to inhibit HCC, whereas androgens stimulate HCC.
miR-21 is the most overexpressed oncomiR in HCC (18) and in the serum of HCC patients (for review, see Ref. 19). miR-21 is 1 of the 10 most abundant miRNAs in human and mouse liver (20) and is an established survival factor during liver injury and HCC development (21). miR-21 down-regulates the expression of a number of tumor suppressor proteins, e.g. Programmed Cell Death 4 (Pdcd4/PDCD4) (22). Pdcd4 protein is reduced in human HCC tumors (23) and is inversely correlated with miR-21 in HCC (24).
The mechanisms regulating miR-21 in HCC remain elusive. Thyroid hormone (T3) increased transcript levels of both miR-21 and the TMEM49/VMP1 gene in which it is encoded in HepG2 cells stably overexpressing thyroid hormone receptor α1 (TRα1) or TRβ1 (25). IL-6 was reported to increase miR-21 in normal human hepatocytes by activating Stat3 recruitment to the miR-21 promoter (21). We recently reported that DHEA was metabolized to steroids, increasing AR and ERβ recruitment to the miR-21 promoter, resulting in increased primary miR-21 (pri-miR-21) transcription after 6 h of treatment in HepG2 cells (26). In this study we demonstrate that DHEA rapidly (within 15 min) increases pri-miR-21 transcription in HepG2 cells and investigate the mechanism of the acute increase in miR-21. Our results suggest that GPER activation is involved in DHEA-stimulated miR-21 transcription, and we dissect the molecular mechanisms downstream, revealing roles for ERα36, EGFR, MAPK, AP-1, and AR.
Experimental Procedures
Chemicals
Chemicals were purchased as follows: Sigma: E2, wortmannin (PI3K inhibitor), methyl-β-cyclodextrin (MβCD, lipid raft disruptor), cycloheximide (CHX, translation inhibitor), pertussis toxin (PT), 4-hydroxytamoxifen, and actinomycin D (ActD, a transcriptional inhibitor); Calbiochem: 4-amino-5-(4-chlorophenyl)-7-(t-butyl)pyrazolo[3,4-d]pyrimidine (PP2, a selective Src tyrosine kinase inhibitor) and AG1478 (tyrphostin); Tocris (Ellisville, MO): fulvestrant (ICI 182,780), G-1 (a GPER/GPR30 agonist), and G-15 (a GPER/GPR30 antagonist); Cell Signaling Technology (Beverly, MA): PD98059 (MEK1/2 inhibitor); Steraloids (Wilton, NH): DHEA, DHT, and 5-androsten-3β-ol-17-one 17-carboxymethyloxime:BSA (DHEA-BSA, cat. no. A8507-000). The AR antagonist bicalutamide (Casodex) was generously provided by Astra Zeneca (Macclesfield, UK).
Cells and Treatments
Human hepatocellular liver carcinoma HepG2 (male) and Hep3B (male) and liver adenocarcinoma SK-HEP-1 (male) cells were purchased from ATCC and were used within nine passages. Cells were grown in DMEM (Cellgro, Manassas, VA) supplemented with 5% fetal bovine serum (FBS) and 1% penicillin/streptomycin at 37 °C under an atmosphere of 5% CO2. Before ligand treatment the medium was replaced with phenol red-free DMEM supplemented with 5% dextran charcoal-stripped FBS for 48 h (“serum-starved”). Where indicated, HepG2 cells were pretreated with 100 ng/ml PT for 16 h (27), 100 nm ICI for 6 h, 50 μm PD98059 (28), 100 nm wortmannin (29), 2 μm PP2 (30), 10 μg/ml CHX (31) for 1 h or 10 mm MβCD for 30 min (32, 33), 10 μm bicalutamide for 1 h (34) before ligand treatment. For some experiments HepG2 cells were preincubated with 500 nm (35) or 50 μm (36) AG1478 (tyrphostin), an EGFR tyrosine kinase inhibitor, for 1 h before ligand treatment. Cells were treated with DMSO (vehicle control), 10 nm E2, or 10 nm DHEA alone or after pretreatment for 1 h. Where indicated, HepG2 cells were preincubated with a 1:200 dilution of rabbit IgG or anti-GPER (Novus Biologicals NBP1–31239, Littleton, CO), EGFR antibody 528 (Santa Cruz Biotechnology sc-120, Santa Cruz, CA), or ERα36 (Cell Applications, CY1109, San Diego, CA) antibodies.
Human Hepatocytes and Treatment
Human hepatocytes (female) were obtained from BioreclamationIVT, (Baltimore, MD) and stored in liquid nitrogen until use. InVitroGRO™ CP medium (Bioreclamation IVT) was prewarmed to 37 °C. Hepatocytes were thawed in a 37 °C water bath for ∼90 s, and the contents of 1 vial placed in 5 ml of InVitroGRO™ CP medium. Hepatocytes were counted, and concentration was adjusted to 0.7 × 10⁶ cells/ml and plated in collagen-coated 12-well plates. After 24 h the cells were washed with PBS and incubated in phenol red-free DMEM supplemented with 5% dextran charcoal-stripped FBS for 48 h (serum-starved before treatment. Cells were treated with DMSO (vehicle control) or 10 nm DHEA for 1 or 6 h.
ERα36 Transient Transfection
HepG2 cells were transfected with 1.5 or 2.5 μg of empty vector or pCR3.1-ERα36 expression vector (37) or pRNAT-U6.1/Neo empty vector or containing shERα36 (38), kindly provided by Dr. Zhaoyi Wang of Creighton University School of Medicine, for 48 h.
Quantitative Real-time PCR (qPCR) Analysis of miRNA and mRNA Expression
Total RNA was isolated with the miRCURYTM RNA isolation kit (Exiqon, Vedbaek, Denmark) according to the manufacturer's instructions. The quality and quantity of the isolated RNA was analyzed using a NanoDrop spectrophotometer. Quantification of miR-21 was performed using the miRCURY LNATM Universal RT microRNA PCR kit (Exiqon) and SYBR Green master mix (Exiqon). RNU48 and 5 S RNA were used for normalization of miRNA expression. For analysis of PDCD4, ESR1 (ERα), ESR2 (ERβ), primary miR-21 (pri-miR-21), and TMEM49/VMP1 mRNA expression. 1 μg of RNA was reverse-transcribed by the High Capacity cDNA Reverse Transcription kit (Applied Biosystems, Inc., Carlsbad, CA), and quantitation was performed using TaqMan primers and probes sets with TaqMan Gene Expression Master Mix (Applied Biosystems), and 18S was used for normalization. The sequences of the real-time primers for GPER were as follows: forward, 5′-AGTCGGATGTGAGGTTCAG-3′; reverse, 5′-TCTGTGTGAGGAGTGCAAG-3′ (39). The sequences of the primers for qPCR for ERα36 are from Dumond and co-workers (40) and Wang and co-workers (41). SYBR® Green ROXTM qPCR Master Mix (Qiagen, Valencia, CA) was used for analysis of GPER and ERα36. qPCR was run using a ViiA7 real-time PCR system (Applied Biosystems) with each reaction run in triplicate. Analysis and -fold change were determined using the comparative threshold cycle (CT method). The change in miRNA or mRNA expression was calculated as -fold change, i.e. relative to DMSO-treated (control).
RNA Interference
HepG2 cells were grown to 70% confluency in 6-well plates in DMEM supplemented with 5% dextran charcoal-stripped FBS. The siRNA oligonucleotides designed to target GPER/GPR30 were as follows: sense strand, 5′-CUGACACCGUCGACCAGGATT-3′; antisense strand 5′-UCCUGGUCGACGGUGUCGTT-3′ (42). As a control, cells were transfected with negative control siRNA (Ambion). In all cases cells were transfected with 90 pmol of siRNA/well using 7 μl of Lipofectamine RNAiMAX (Invitrogen) in antibiotic-free medium and incubated for 72 h. Cells were subsequently treated with DMSO (vehicle control), 10 nm DHEA, or 10 nm E2 for 1 h. RNA and protein lysates were prepared for qPCR and Western blot analysis.
Western Blotting
Cells were treated as indicated in the individual figure legends, and whole cell extracts (WCE) were prepared in modified radioimmune precipitation assay buffer (Sigma) with the addition of protease and phosphatase inhibitors (Roche Applied Science). Western analysis was performed and quantitated as described (43). Proteins were separated by 10% SDS-PAGE and transferred to PVDF membranes (Bio-Rad). Dual color precision protein molecular mass markers (Bio-Rad) were separated in parallel. Antibodies were purchased as follows: ERα (D-12, sc-8005), EGFR (sc-03), and GPER/GPR30 (sc-48524-R) from Santa Cruz Biotechnology; Tyr(P)-1068-EGFR (#2236), PDCD4 (9535P), pERK (9101S), ERK (9102), cJun (9165P), cFos (2250P), pSrc (2101S), and Src (2108) from Cell Signaling Technology; phospho-Ser-118-ERα (#2511) from Abcam (Cambridge, MA); GPER/GPR30 (NBP1–31239) from Novus Biologicals; ERα36 (CY1109) from Cell Applications; β-actin from Sigma; α-tubulin (MS-581-P1) from Thermo Scientific/Lab Vision (Fremont, CA). The ERα36 antibody was supplied by Dr. Zhaoyi Wang of Creighton University School of Medicine (37). Chemiluminescent bands were visualized on a Carestream Imager and quantified using Carestream Molecular Imaging software (New Haven, CT).
Chromatin Immunoprecipitation (ChIP) Assays
ChIP assays were performed using the MAGnify™ ChIP System kit (Invitrogen). In brief, HepG2 cells were serum-starved (as above) for 48 h and then treated with DMSO, 10 nm DHEA, 10 nm E2, 10 nm G-1, or 10 nm DHT for 15 or 60 min. Chromatin was cross-linked using 1% formaldehyde for 5 min. The sonicated extracts were incubated with antibodies or normal rabbit IgG from Santa Cruz Biotechnology: anti-c-Jun (H-79, sc-1694); anti-ERα (HC-20, sc-543), anti-ERβ (H-150, sc-8974), or anti-AR (N-20, sc-816). Anti-c-Fos (38–4950) was purchased from Invitrogen. The primers used for PCR of the miR-21 promoter and a negative control region in the TMEM49/VMP1 gene are listed in Table 1. CT values were normalized against input chromatin, and relative promoter region enrichment compared with IgG is plotted (44).
TABLE 1.
Primers used for ChIP assays on the miR-21 promoter and negative control
MatInspector identified three putative AP-1 binding sites in the ARE region. F, forward; R, reverse.
| ARE-F, 5′-TCCCAATCATCTCAGAACAAGCT-3′ |
| ARE-R, 5′-TGCACAGAAACTCCAGTACATTAGTAAC-3′ |
| Negative control F, 5′-ATTGGCTATCTTTGTGTGCCTTG-3′ |
| Negative control R, 5′-TGCTCAATAAAACACATTGTTCTTCAT-3′ |
| 12,038 bp in the 3′ end of TMEM49/VMP1 |
Transient Transfection and Luciferase Reporter Assay
HepG2 cells were transfected with a luciferase reporter containing 1.5 kb of the human MIR21 promoter in the pGL3-basic vector (Promega, Fitchburg, WI) or a mutant within ARE1 (45), plus pRL-TK Renilla luciferase (Promega) and luciferase assays were performed as described in Teng et al. (26).
Statistics
Statistical analyses were performed using Student's t test or one-way analysis of variance followed by Student-Newman-Keuls or Dunnett's post-hoc tests using GraphPad Prism (San Diego, CA).
Results
Biphasic Induction of Primary and Mature miR-21 Transcript Expression by DHEA
miR-21 is up-regulated in HCC (19) to which males are more susceptible than females (11). We examined the time-course of primary miR-21 (pri-miR-21) and mature miR-21 expression in response to 10 nm DHEA (Fig. 1A). A reproducible biphasic response in both pri-miR-21 and miR-21 was seen with an initial peak at 1 h followed by a decrease at 90 min, a sustained second peak from 3–6 h, and increased miR-21 expression still detected at 24 h (Fig. 1A). To our knowledge this is the first report of biphasic regulation of pri-miR-21 transcription.
FIGURE 1.

DHEA increases pri-miR-21 transcription and mature miR-21. For all panels, cells were serum-starved, i.e. incubated in phenol-red free DMEM medium containing 5% dextran charcoal-stripped FBS, for 48 h before treatment to reduce steroid hormone levels. qPCR was used to examine miR-21 and pri-miR-21 expression relative to RNU48 and 18S rRNA, respectively. A, HepG2 cells were incubated with DMSO (vehicle control) or 10 nm DHEA for the indicated times. Relative expression is -fold change normalized to DMSO at time zero. Values are the average of 2–4 separate experiments ± S.E. B, primary human hepatocytes (B) or Hep3B human hepatoma cells (C) were treated with DMSO or 10 nm DHEA for 1 or 6 h, and qPCR was performed for miR-21. Values are the average of three determinations within one experiment ± S.E. *, p < 0.05 versus DMSO. D, where indicated, HepG2 cells were preincubated with the following inhibitors: 10 μg/ml ActD, 10 μg/ml CHX, 100 ng/ml PT, 10 μm MβCD, 500 nm AG-1478 (tyrphostin), 2 μm PP2, 50 μm PD98059, or 50 nm wortmannin before 1 h of treatment with DMSO or 10 nm DHEA. Values are the mean ± S.E. of three-four separate experiments/time point. *, p < 0.05 versus DMSO vehicle; #, p < 0.05 versus 10 nm DHEA. E, to confirm that AG1478 blocks EGFR activity in HepG2 cells at the concentrations used, cells were treated with 10 ng/ml EGF ± the indicated concentrations of AG1478 for 15 min. Whole cell lysates, 40 μg of protein, were immunoblotted first for Tyr(P)-1068-EGFR. The membrane was stripped and re-probed for EGFR.
DHEA Stimulates miR-21 Expression in Primary Human Hepatocytes and in Hep3B Cells
DHEA also increased pri-miR-21 (data not shown) and miR-21 expression in primary human hepatocytes (Fig. 1B) and in Hep3B cells (Fig. 1C), with higher expression detected at 1 h than at 6 h.
Stimulation of miR-21 Transcription by DHEA Involves Plasma Membrane-initiated Signaling Pathways
To investigate the possible mechanisms involved in the rapid increase in pri-miR-21 and miR-21 transcript expression, HepG2 cells were selected as a model system because they were derived from a male patient, are not hepatitis B-positive, and are a commonly used HCC cell line in mechanistic studies. HepG2 cells were treated with pathway-specific inhibitors at concentrations and for times selected to minimize “off target” effects (see “Experimental Procedures”) (Fig. 1D). The DHEA-induced increase in pri-miR-21 and miR-21 detected at 1 h was inhibited by the transcriptional inhibitor ActD, suggesting a primary transcriptional effect. In contrast, pretreatment with the protein synthesis inhibitor CHX did not inhibit DHEA-induced miR-21, indicating that protein synthesis is not required for DHEA stimulation of miR-21 expression. Pretreatment of HepG2 cells with PT, which inhibits G-protein heterotrimer interaction with GPCRs, inhibited DHEA-induced pri-miR-21 and miR-21 expression. MβCD removes cholesterol from the PM of cultured cells and is used to examine the necessity of intact caveolae and PM integrity in intracellular signaling (46). MβCD inhibited DHEA-induced pri-miR-21 and mature miR-21 transcript expression. Pretreatment of HepG2 cells with the EGFR kinase inhibitor AG1478 (tyrphostin), Src kinase inhibitor PP2, MEK/MAPK inhibitor PD98059, and PI3K/AKT inhibitor wortmannin also inhibited DHEA-induced pri-miR-21 transcription and mature miR-21 transcript expression. Fig. 1E demonstrates that the 0.5 and 50 μm AG1478 concentrations used inhibited EGF-stimulated EGFR phosphorylation. Together, these data suggest that the rapid DHEA-induced increase in pri-miR-21 and miR-21 is a transcriptional response that requires GPCR signaling, EGFR activation, Src kinase activity, intact PM structure, and MAPK and PI3K activity.
DHEA Stimulates TMEM49/VMP1 Transcription by a Mechanism Different from That of miR-21
Most studies of miR-21 regulation have not evaluated TMEM49/VMP1 expression in parallel with pri-miR-21 and mature miR-21. The miR-21 gene was initially reported to be regulated independently of TMEM49 in which it is encoded (47). However, there is evidence of read-through of TMEM49 increasing miR-21 expression (48). DHEA increased TMEM49 expression 1 h after treatment to a similar extent as pri-miR-21 (Fig. 2A). DHEA-induced TMEM49 transcription was inhibited by PT, PD98059, MβCD, and PP2, but not by wortmannin, in contrast to the inhibition of pri-miR-21 and miR-21 transcription (Fig. 2B and Fig. 1D). These results suggest differences between DHEA regulation of pri-miR-21 and TMEM49 transcription by PI3K/AKT that should be ascribed elsewhere.
FIGURE 2.

DHEA regulation of TMEM and other miRNAs. A–C, HepG2 cells were serum-starved for 48 h before treatment. A, TMEM49/VMP1 mRNA transcript levels were normalized by GAPDH and measured after 1 h of treatment with DMSO or 10 nm DHEA. Values are the average of 15 separate experiments ± S.E. *, p < 0.05 versus DMSO vehicle; #, p < 0.05 versus TMEM49. B and C, cells were pretreated with ActD, CHX, MβCD, PP2, PD98059, or wortmannin (Wort, as in Fig. 1) before 1 h of treatment with DMSO or DHEA. B, TMEM49 transcript levels were normalized by 18S. C, Let-7f, miR-200a, and miR-22 levels were normalized by RNU48. Values are the average of three separate experiments ± S.E. *, p < 0.05 versus DMSO vehicle; #, p < 0.05 versus 10 nm DHEA.
DHEA Regulation of miRNA Transcription Appears to Be miR-specific
To examine the specificity of DHEA activation of miR-21 expression in HepG2 cells, the effect of 10 nm DHEA on the expression of miRNAs deregulated in HCC and two with no reported roles (miR-340 and miR-665, as potential negative controls) was assessed (Table 2). DHEA had no effect on miR-340 or miR-665. DHEA increased miR-16, let-7d, and miR-22 and reduced let-7f expression. To test if DHEA-stimulation of miR-22 involved a pathway similar to that for miR-21 up-regulation, similar inhibitor studies were performed (Fig. 2C), with different outcomes. The increase in miR-22 was not inhibited by ActD or PT, suggesting different mechanisms for DHEA regulation of miR-21 and miR-22 expression. Furthermore, the MAPK and PI3K pathway inhibitors PD98059 and wortmannin differentially affected let-7f, miR-200a, and miR-22 expression compared with miR-21 (Fig. 2C). Together these data suggest that DHEA regulation of miR-21 transcription is not mediated by a common cellular response to DHEA and reflects the likelihood that miRNAs are individually regulated by complex networks.
TABLE 2.
Effect of DHEA on the expression of other miRNAs in HepG2 cells
HepG2 cells were serum-starved for 48 h and treated with DMSO (vehicle control) or 10 nm DHEA for 1 h. Expression values are relative to that of miRNA, normalized to RNU38, at time 0 (no treatment). CHC, chronic hepatitis C infection; NAFLD, non-alcoholic fatty-liver disease. Values are the mean of triplicate determinations ± S.E.
| miRNA | DHEA | Role in HCC |
|---|---|---|
| miR-16 | 2.2 ± 0.03a | Reduced (67) or elevated (68) in sera of NAFLD, CHC, and HCC patients |
| Let-7d | 2.9 ± 0.08a | Reduced in HCC tumors (69) |
| Let-7f | 0.8 ± 0.01 | Reduced in HCC tumors (69) |
| miR-22 | 1.5 ± 0.02a | Down-regulated in male HCC tumors (70) |
| miR-200a | 0.9 ± 0.01 | Down-regulated in HCC tumors (69) |
| miR-340 | 0.7 ± 0.01 | |
| miR-744 | 0.9 ± 0.01 | Reduced in HCC tumors (71) |
| miR-765 | 1.1 ± 0.01 |
a p < 0.05 versus vehicle control.
GPER/GPR30 Activation Increases miR-21 Transcription
A recent study reported that a DHEA metabolite, 7β-hydroxy-epiandrosterone, activates GPR30/GPER (49). To examine if DHEA acts through GPER in HepG2 cells, we first confirmed that HepG2 cells express GPER (42) by demonstrating GPER mRNA and protein expression in HepG2 cells (Fig. 3, A and B, and data not shown).
FIGURE 3.

DHEA increases GPER/GPR30 and knockdown of GPER inhibits DHEA-induced pri-miR-21 transcription. A, B, and C, HepG2 cells were transfected with an siRNA control or targeting GPER for 48 h and serum-starved during that time. Cells were treated with DMSO (vehicle control), 10 nm DHEA, or 10 nm G-1, a GPER agonist, for 1 or 6 h as indicated. A, GPER expression was determined by qPCR relative to 18S values, and values are the average ± S.E. of triplicate determinations in one experiment. B, WCEs (25 μg) were immunoblotted for GPER, and the blot was stripped and re-probed for β-actin. The arrows indicate the two GPER bands, monomer and putative dimer, that were quantitated as estimated molecular mass bands of 85 and 45 kDa. The values above the β-actin blot are the quantitation of the sum of the GPER bands/β-actin relative to the 1 h DMSO siRNA control that was set to 1. The values below the β-actin blot are the quantitation of the sum of the GPER bands/β-actin relative to the DHEA siRNA control. C, pri-miR-21 and miR-21 expression was determined by qPCR relative to 18S and RNU48, respectively. Values are the mean ± S.E. of three separate experiments. *, p < 0.05 versus DMSO vehicle; #, p < 0.05 versus 10 nm DHEA (siControl); , p < 0.05 versus 10 nm G-1 (siControl). D and E, HepG2 cells were serum-starved for 48 h before treatment with DMSO, 10 nm DHEA, the indicated concentrations of GPER agonist G-1, GPER antagonist G-15, or ICI 182,780 (ICI, fulvestrant, a nuclear ERα/β antagonist, and GPER agonist) alone or in combination for 1 h. Values are the mean ± S.E. of three separate experiments. *, p < 0.05 versus DMSO vehicle; #, p < 0.05 versus 10 nm DHEA; , p < 0.05 versus 10 nm G-1. F, a diagram summarizes the results shown here.
To test the role of GPER in DHEA activation of miR-21 transcription, HepG2 cells were transfected with control siRNA or siRNA targeting GPER. An ∼50% reduction in GPER mRNA (Fig. 3A, gray bars) and an ∼60% decrease in protein (Fig. 3B) was detected. We observed that DHEA stimulated GPER mRNA and protein expression. DHEA-induced GPER mRNA transcription was blocked by siGPER at 1 h but not 6 h (Fig. 3A). siGPER inhibited DHEA-stimulated GPER protein expression by 70% at 1 h and 85% at 6 h (Fig. 3B). Knockdown of GPER completely abrogated the acute (1 h) DHEA stimulation of pri-miR-21 and miR-21 expression (Fig. 3C). Furthermore, 10 nm G-1, a selective GPER agonist that has no affinity for ERα or ERβ (50), stimulated pri-miR-21 and miR-21 to an extent similar to 10 nm DHEA and in a GPER-dependent manner (Fig. 3C). Knockdown of GPER inhibited pri-miR-21 but not miR-21 expression stimulated by DHEA 6 h after treatment (Fig. 3C), whereas knockdown of GPER ablated the stimulation of both pri-miR-21 and miR-21 by 6 h of treatment with G-1. Less inhibition of DHEA-induced pri-miR-21 expression by siGPER was detected at 6 h compared with 1 h (complete versus 43%; Fig. 3C). These data suggest that DHEA activation of GPER stimulates miR-21 transcription observed 1 h after treatment, but after 6 h of DHEA treatment a mechanism in addition to DHEA activation of GPER is involved in pri-miR-21 transcription. This fits the metabolism of DHEA to ERβ and AR agonists that stimulate pri-miR-21 transcription described in Teng et al. (26).
Like DHEA and G-1, fulvestrant (ICI 182,780), an ER antagonist and GPER agonist (51), also increased GPER mRNA expression in a concentration-dependent manner (Fig. 3D and data not shown). GPER antagonist G-15, which binds neither ERα nor ERβ (52), abrogated DHEA-, G-1-, and fulvestrant-induced GPER expression (Fig. 3D). Also like DHEA, both G-1 and fulvestrant increased pri-miR-21 and miR-21 in a concentration-dependent manner that was abrogated by G-15 (Fig. 3E and data not shown). Together, these data suggest that DHEA, like GPER agonists G-1 and fulvestrant, increases pri-miR-21, miR-21, and GPER expression in a GPER-dependent manner (Fig. 3F).
ERα36 Contributes to DHEA-regulated miR-21 Expression
ERα36 is a PM-associated splice variant of ERα that has been proposed to mediate the membrane-initiated effects of E2 and G-1 as a direct transcriptional target of GPER activation of the Src/MEK1/2/AP-1 pathway (41). Because DHEA activated GPER and increased GPER expression and G-1 activation of GPER increases ERα36 (41), we evaluated if DHEA increased ERα36 expression. One hour of treatment of HepG2 cells with either 10 nm DHEA or G-1 increased ERα36 mRNA, which was abrogated by siGPER (Fig. 4A). However, in contrast to the sustained increase in GPER by DHEA (Fig. 3A), the increase in ERα36 was transient as levels returned to basal after 6 h of DHEA or G-1 treatment (Fig. 4A). ERα36 protein was also increased by DHEA (Fig. 4B). As positive controls, E2 and DHT increased ERα36 in HepG2 cells (Fig. 4B), similar to findings in TCam-2 seminoma cells (40).
FIGURE 4.

DHEA activates PM-bound GPER and increases pri-miR-21 transcription. For all panels, HepG2 cells were serum-starved for 48 h before treatment. A, where indicated, HepG2 cells were transfected with siRNA control or siRNA against GPER for 48 h. Cells were treated with DMSO (vehicle control), 10 nm DHEA, or 10 nm G-1 for 1 or 6 h. qPCR used two different primer sets specific for ERα36 (Dumond (40) and Wang (41); see “Experimental Procedures”. Values are the average ± S.E. of triplicate determinations. B, Western blot for ERα36 using 25 μg of WCE from HepG2 cells treated with DMSO, 10 nm E2, 10 nm DHEA, or 10 nm DHT for 1 or 6 h. The membrane was stripped and re-probed for β-actin. The values are the ratio of ERα36/β-actin normalized to 1 h DMSO. C, HepG2 cells were preincubated with 1:200 dilution of rabbit IgG or antibodies (Ab) against GPER or ERα36 for 24 h and then treated with DMSO, 10 nm DHEA, or 10 nm G-1 (shaded gray) for 1 h. Where indicated cells were transfected with pRNAT-U6.1 vector control or the shERα36 plasmid for 48 h before 1 h treatment with DMSO or 10 nm DHEA. Values are the mean ± S.E. of three separate experiments. *, p < 0.05 versus DMSO control. #, p < 0.05 from the indicated treatment (DHEA or G-1) without antibody or control plasmid. D, HepG2 cells were transfected with the indicated amounts of empty expression vector (EV) or pCR3.1-ERα36 (37) for 48 h before qPCR for ERα36 relative to 18S. Values are the average ± S.E. of triplicate determinations. *, p < 0.05 versus empty vector control. E, Western blot of ERα36 relative to β-actin. F, transfection of HepG2 cells with ERα36 for 48 h increased pri-miR-21 and miR-21 levels. Values are the average ± S.E. of triplicate determinations. *, p < 0.05 versus empty vector control. G, EGF stimulation of pri-miR-21 and miR-21 expression is blocked by EGFR monoclonal antibody 528. Cells were incubated with 1 μg/ml EGFR antibody 528 or mouse IgG for 3 h before the addition of DMSO (vehicle control) or 10 nm DHEA for 1 h. Values are the average ± S.E. of triplicate determinations within one experiment. *, p < 0.05 versus DMSO vehicle; #, p < 0.05 versus EGF or DHEA, as indicated.
Preincubation of Cells with Antibodies to GPER, ERα36, or EGFR Inhibits DHEA-induced Pri-miR-21 and miR-21 Expression
To further investigate the roles of ERα36 and GPER in DHEA-induced miR-21 expression, HepG2 cells were preincubated with antibodies recognizing ERα36 or GPER for either 15 min or 2 h. Identical preincubation with IgG served as a negative control with no effect on DHEA- or G-1-induced miR-21 expression (Fig. 4C). Preincubation with antibodies recognizing either ERα36 or GPER inhibited DHEA-induced pri-miR-21 and miR-21 expression to a similar extent (Fig. 4C). However, the anti-ERα36 antibody did not inhibit G-1-induced miR-21 expression, which was ablated by anti-GPER (Fig. 4C). Transfection with an ERα36-specific shRNA expression vector (38) reduced basal pri-miR-21 and miR-21 and inhibited DHEA-induced expression of both (Fig. 4C). Additionally, transfection of cells with an ERα36 expression vector (37) for 48 h increased ERα36 (Fig. 4, D and E), pri-miR-21, and miR-21 expression (Fig. 4F). These data suggest that DHEA activates both GPER and ERα36, whereas G-1 activates only GPER in HepG2 cells.
Preincubation with an EGFR monoclonal antibody 528, known to bind the extracellular domain of the EGFR and antagonize ligand binding, thus blocking EGFR activation and downstream signaling (53), ablated EGF- and DHEA-induced pri-miR-21 and miR-21 expression (Fig. 4G). The EGFR antibody 528 also inhibited G-1 activation of pri-miR-21, and miR-21 expression was, like DHEA, inhibited by EGFR kinase inhibitor AG1478 (Fig. 1D), reflecting GPER-EGFR cross-talk (54) (data not shown). These data suggest that DHEA activates EGFR signaling, an established downstream response to GPER activation (54).
DHEA-BSA Increases pri-miR-21 and miR-21 Expression in a GPER-dependent Manner
To further examine the possibility that PM-associated GPER was activated by DHEA, we tested the ability of membrane-impermeable BSA-conjugated DHEA to increase pri-miR-21 and miR-21 expression in a time-dependent manner (Fig. 5, A and B). Some cells were preincubated with 1 μm G-15 to inhibit GPER activation before the addition of the DHEA-BSA. Like DHEA, DHEA-BSA increased pri-miR-21 and miR-21 expression in a GPER-dependent manner with a peak at 60 min. We observed that the DHEA- and DHEA-BSA- stimulated increase in pri-miR-21 and miR-21 expression at 6 h was not significantly inhibited by G-15 (data not shown), suggesting GPER independence at that later time point. To examine if AR is involved in the rapid increase in pri-miR-21 and miR-21 stimulated by DHEA and DHEA-BSA, cells were preincubated with the AR antagonist bicalutamide, previously shown to inhibit DHEA-induced miR-21 expression after 6 h of treatment (26). Bicalutamide had no statistically significant effect on the DHEA- or DHEA-BSA-induced increase in pri-miR-21 or miR-21 expression (Fig. 5C), suggesting a lack of AR involvement.
FIGURE 5.

DHEA rapidly activates MAPK, ERα phosphorylation, and Src phosphorylation and increases c-Jun in HepG2 cells. For all panels, HepG2 cells were serum-starved for 48 h before treatment. A and B, HepG2 cells were treated with DMSO, 10 nm DHEA, and 10 nm DHEA-BSA for the indicated times. Where indicated, cells were preincubated with 1 μm G-15 (GPER antagonist) for 1 h before the addition of DHEA or DHEA-BSA. Values are the average ± S.E. of three separate experiments. *, p < 0.05 versus DMSO vehicle; #, p < 0.05 versus 10 nm DHEA or 10 nm DHEA-BSA. C and D, HepG2 cells were treated with DMSO, 10 nm DHEA, and 10 nm DHEA-BSA for 1 h. Where indicated, cells were preincubated with 10 μm bicalutamide (AR antagonist) for 1 h before treatment. qPCR for pri-miR-21 and miR-21 were normalized by RNU48, and PDCD4 was normalized by 18S. Values in the DMSO-treated samples were set to one, and values are the mean ± S.E. of three-five separate experiments. *, p < 0.05 versus DMSO. E, HepG2 cells were treated with DMSO or 10 nm DHEA for the times indicated, and WCE (20 μg of protein) were immunoblotted for PDCD4, a bona fide miR-21 target. The membrane was stripped and re-probed for β-actin. The values are the ratio of PDCD4/β-actin normalized to DMSO at time zero. F, HepG2 cells were transfected with anti-miR-21 inhibitor or anti-miR control (AS control or AS miR-21) for 24 h before incubation under serum starvation conditions for an additional 48 h before WCE preparation. WCE (20 μg of protein) were immunoblotted for PDCD4. The membrane was stripped and re-probed for β-actin. The values are the ratio of PDCD4/β-actin normalized to non-transfected cells (lane 1). G, HepG2, HepG3, and primary human hepatocytes wee serum-starved for 48 h before 1 h of treatment with DMSO or 10 nm DHEA. qPCR for PDCD4 was normalized to 18S. Values are the average ± S.E. of 3 replicate wells within one experiment. *, p < 0.05 versus DMSO vehicle
DHEA Inhibits PDCD4 Expression
Because DHEA and DHEA-BSA increased miR-21, expression of the tumor suppressor PDCD4, a bona fide target of miR-21 (22), should be reduced in DHEA- or DHEA-BSA-treated HepG2 cells. Indeed, DHEA and DHEA-BSA reduced PDCD4 transcript and protein expression (Fig. 5, D and E). Bicalutamide did not abrogate the decrease in PDCD4 after DHEA or DHEA-BSA treatment. AS-miR-21 increased PDCD4 protein in DHEA-treated HepG2 cells (Fig. 5F), showing direct targeting of PDCD4 by miR-21 in HepG2 cells. DHEA also decreased PDCD4 transcript levels in HepG3 and primary human hepatocytes (Fig. 5G). These data suggest that the increase in miR-21 after DHEA treatment has a functional outcome: reducing PDCD4 in HCC cells and hepatocytes. Furthermore, AR is not involved in the reduction of PDCD4 transcript 1 h after DHEA treatment in HepG2 cells.
DHEA Stimulates MAPK and Src Phosphorylation in a GPER-dependent Manner
Activation of GPER increases MAPK activity and ERK1/2 phosphorylation (54). We examined if DHEA increased MAPK and Src phosphorylation in HepG2 cells. DHEA rapidly increased the relative pERK/ERK ratio, peaking at 5 min. Preincubation with G-15 inhibited DHEA-induced MAPK activation (Fig. 6A). The pERK/ERK ratio remained elevated (>1) up to 6 h after DHEA treatment (Fig. 6B). DHEA also increased ERα Ser-118 phosphorylation (Fig. 6C), an established target of MAPK (55). DHEA increased the pSrc/Src ratio in HepG2 cells with the peak at 5 min, and this stimulation was inhibited by GPER antagonist G-15 (data not shown).
FIGURE 6.
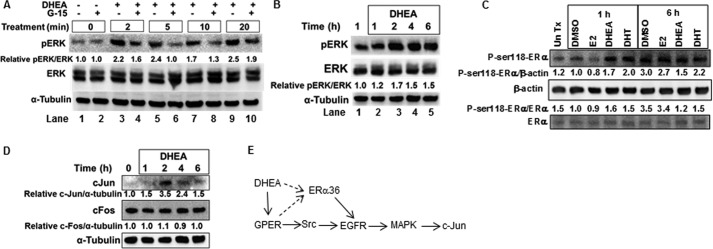
DHEA increased MAPK and Src activity in a GPER-dependent manner and increases ER phosphorylation. For all panels, HepG2 cells were serum-starved for 48 h before treatment. Where indicated (A), cells were preincubated with 1 μm G-15 (GPER antagonist) for 15 min. A, the phospho-ERK blot was stripped and re-probed for total ERK and then stripped and re-probed for α-tubulin. Values are the quantification of pERK/ERK relative to the DMSO control (lane 1). B, the values are the quantification of pERK/ERK relative to the 1 h DMSO. C, cells were treated with DMSO, 10 nm E2, 10 nm DHEA, or 10 nm DHT as indicated. The membrane was probed first for phospho-Ser-118-ERα and then stripped and reprobed for ERα and β-actin. The ratios of p-Ser-118-ERα/β-actin or p-Ser-118-ERα/ERα relative to the 1 h DMSO control are indicated. Un Tx, untreated. D, cells were treated with 10 nm DHEA for the indicated times. WCE (25 μg of protein) were immunoblotted for c-Jun, and the membrane was and stripped and reprobed for c-Fos, then stripped and re-probed for α-tubulin. Values are the quantification of c-Jun/α-tubulin or c-Fos/α-tubulin relative to time 0 control. E, a model summarizes the suggested conclusions from these data, those in the preceding figures and those for the GPER-ERα36-EGFR (41) and GPER-Src-EGFR-MAPK-cJun pathways reported previously (51). The dashed arrow indicates the order of activation remains to be determined.
Activation of GPER increases the expression of downstream transcription factors. For example, G-1 increased c-Jun and c-Fos in a MAPK-dependent manner in PC-3 prostate cancer cells (56). We observed that DHEA increased c-Jun but had no effect on c-Fos protein levels in HepG2 cells (Fig. 6D). Together these data suggest that DHEA activation of GPER and ERα36 activates Src, EGFR, and MAPK, resulting in increased c-Jun protein expression (Fig. 6E).
Recruitment of AR and AP-1 (c-Fos/c-Jun) and Release of ERβ from the miR-21 Promoter
ChIP assays were performed to examine ERβ, AR, and AP-1 (c-Fos and c-Jun) recruitment to the miR-21 promoter in HepG2 cells treated for 15 min or 1 h with DMSO (vehicle control), 10 nm DHEA, or 10 nm G-1. Primers for qPCR were selected to examine recruitment of each receptor to the AP-1 binding site/ARE in the miR-21 promoter (Fig. 7A). DHEA increased AR, cFos, and c-Jun recruitment to the AP-1/ARE site in the miR-21 promoter, with DHEA showing a larger effect on c-Jun recruitment (Fig. 7B). DHEA reduced ERβ recruitment to the AP-1/ARE region (Fig. 7B). Similar results were observed in GPER agonist G-1-treated cells except that equivalent c-Fos and c-Jun recruitment was observed. These data are consistent with a model of DHEA activation of signaling pathways that activate AP-1 and AR.
FIGURE 7.

DHEA rapidly increases AR, c-Fos, and c-Jun recruitment to and dismisses ERβ from the miR-21 promoter. A, the diagram shows the chromosomal location of the pri-miR-21 promoter within the VMP2/TMEM49 gene (see the Atlas of Genetics and Cytogenetics in Oncology and Haematology). The location and sequences of the AP-1/ARE and the primers (black arrows) used for ChIP are indicated. MatInspector identified three AP-1 binding sites in the ARE region. B, HepG2 cells were serum-starved for 48 h and then treated with DMSO, 10 nm DHEA, or 10 nm G-1 for 60 min. ChIP was performed using antibodies for ERβ, AR, c-Fos, and c-Jun as described under “Experimental Procedures.” Values are -fold enrichment of the PCR product in the immunoprecipitated samples relative to input control and are the average ± S.E. of three separate experiments, performed in triplicate within each biological replicate. *, p < 0.05 versus DMSO. C, HepG2 cells were transfected with a firefly luciferase reporter constructs driven by the 5′-flanking region of human MIR21 in the sense orientation or with mutations in ARE1 (ARE1mut) (26). The cells were treated with DMSO (−, vehicle control) or 10 nm DHEA for 24 h. Where indicated, cells were preincubated for 15 min with 1 μm G-15 or 6 h with 100 nm bicalutamide (AR antagonist). The results are expressed relative to DMSO in the full-length MIR21 reporter after normalization with Renilla luciferase (mean ± S.E., n = triplicate wells in one experiment). *, p < 0.05 versus DMSO; #, p < 0.05 versus 10 nm DHEA.
To further address DHEA activation of MIR21 transcription, HepG2 cells were transiently transfected with a MIR-21 promoter luciferase reporter (Fig. 7C). DHEA-induced luciferase activity was inhibited by G-15 and bicalutamide and by mutation of the ARE. These data are consistent with roles for GPER and AR in DHEA-induced miR-21 transcription. AP-1 activation of miR-21 transcription has been reported (47).
Discussion
Although miR-21 is 1 of the 10 most abundant miRNAs in human and mouse liver (20) and its expression is elevated in HCC (18, 19), the mechanisms regulating miR-21 expression in liver are largely undefined (26). Here we observed that nm concentrations of DHEA, physiologically relevant for men and women 40–60 years of age (2), rapidly increased pri-miR-21 transcription and miR-21 expression in primary human hepatocytes, HepG2 cells, and Hep3B cells. Based on reports of rapid activation of a DHEA-specific GPCR in vascular endothelial cells (8), PC12 cells (9), and DU145 and Caco2 cells (57), we hypothesized that the first temporal peak of miR-21 transcription detected in HepG2 cells involved plasma membrane-initiated signaling by DHEA. Indeed, we demonstrate here that inhibition of G-protein heterotrimer interaction with GPCRs by PT, PM integrity by MβCD, EGFR kinase by AG1478, and Src kinase by PP2, MAPK, and PI3K block DHEA-induced pri- and miR-21 transcription, supporting membrane-mediated signaling by DHEA in HepG2 cells.
Three different experimental approaches demonstrated that rapid DHEA activation of GPER is involved in increased pri-miR-21 transcription. The acute increase in pri-miR-21 and miR-21 transcription at 1 h was abrogated by GPER knockdown, by preincubation of HepG2 cells with anti-GPER antibody, and by GPER-specific antagonist G-15. Although the cellular location of GPER is cell- and context-specific as well as dynamic (51, 58, 59), DHEA-induced pri-miR-21 transcription was inhibited by MβCD, which indicates the necessity of intact caveolae and PM integrity (46). Cell-impermeable DHEA-BSA showed a similar time-course of induction of pri-miR-21 and miR-21 expression that was inhibited at 1 h by G-15, suggesting that DHEA-BSA activated GPER in a manner similar to DHEA.
We found that c-Jun and c-Fos (AP-1) were recruited to the AP-1/ARE region in the miR-21 promoter. c-Jun phosphorylation promotes heterodimerization and DNA binding leading to increased activation of AP-1. AP-1 members are downstream targets of the JNK and ERK signaling pathways; therefore, it is possible that the recruitment of AP-1 to the miR-21 promoter may result from phosphorylation of c-Fos and/or c-Jun. In addition, GPER activation of MAPK and PI3K increased c-Fos and c-Jun expression and AP-1 activation, promoting transcription of targets such as cyclin D1 in breast cancer cells (60). Based on review of the GPER/GPR30 literature, e.g. Refs. 51, 54, 59, and the experiments performed here, we suggest a model (Fig. 8) where DHEA activation of GPER activates Src, in turn activating EGFR, MAPK, and PI3K, leading to increased pri-miR-21 transcription via AP-1 activation and recruitment to the pri-miR-21 promoter. Others have reported rapid (5–15 min) Src activation in HepG2 cells by 1–100 ng/ml EGF (61) and by 10 nm TCDD (2,3,7,8-tetrachlorodibenzo-p-dioxin) (30), indicating the presence of these signaling pathways in this cell line.
FIGURE 8.
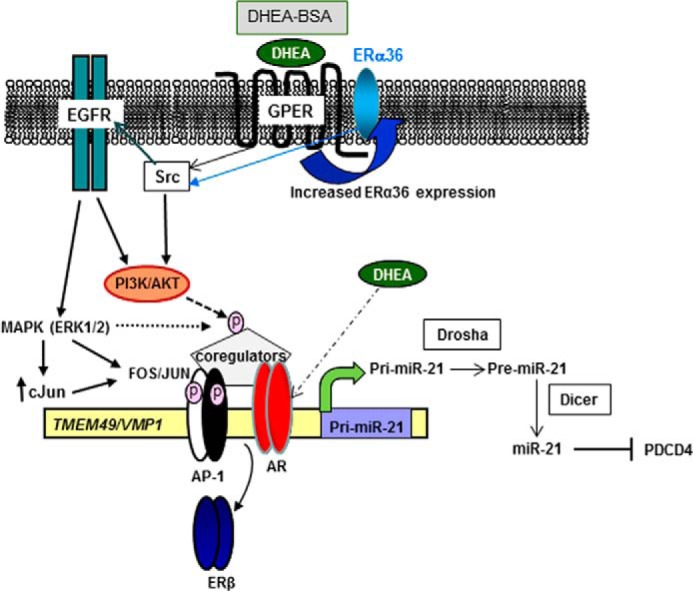
Proposed model for DHEA activation of GPER and ERα36 leading to increased pri-miR-21 transcription in HepG2 cells. Solid lines represent conclusions based on studies reported here and in the literature cited herein, whereas dashed lines indicate possible mechanisms based on other studies included in the discussion. The data presented here suggest that DHEA activates GPER and increases ERα36 expression (mechanism not diagrammed, but indicated by the curved black arrow) leading to activation of Src, EGFR, MAPK, and PI3K/AKT, which results in increased transcription of pri-miR-21. This pathway is based on the reports on GPER activity (for review, see Ref. 54). The cellular location of these receptors and whether DHEA binds directly to GPER and/or ERα36 is unknown. Nonetheless, because DHEA-BSA, like DHEA, activated pri-miR-21 transcription and antibodies to GPER and ERα36 ablated DHEA-induced pri-miR-21 transcription, a plasma membrane location seems logical. Preincubation with an EGFR antibody (mAb 528) that binds the extracellular domain of the EGFR and antagonizes ligand binding ablated DHEA-induced pri-miR-21 expression. GPER activates EGFR and stimulates intracellular kinase pathway activation (51, 60). We observed increased AR, c-Fos, and c-Jun recruitment to the miR-21 promoter in cells treated with DHEA, whereas ERβ recruitment was reduced. It is possible that MAPK and PI3K/AKT may phosphorylate (dashed lines, pink circle) and activate AP-1 or coregulators (coactivators such as SRC-1) interacting with AP-1 and AR to modify chromatin structure and increase pri-miR-21 transcription. Although AR antagonist bicalutamide did not block DHEA-activated pri-miR-21 transcription and we used physiologically relevant 10 nm DHEA, well below the well below the Kd ∼ 1–2 μm for DHEA-AR binding (7), we cannot exclude the possibility that DHEA may also bind and activate AR (dashed/dotted line).
In HepG2 cells, DHEA did not increase c-Fos protein but did increase c-Jun after 2 h of treatment. Our data in HepG2 cells suggest cell-specific differences in the control of AP-1 expression in response to GPER activation. The increase in c-Jun protein in HepG2 cells after 2 h of DHEA treatment does not correspond to the initial peak of miR-21 transcription, supporting a potential role of phosphorylation of AP-1 mediating the DHEA-GPER signaling pathway for miR-21 expression. Others have reported that AP-1 activates miR-21 transcription after 4 h of PMA treatment in HL-60 cells (47). To our knowledge there are no reports of DHEA increasing c-Jun protein expression.
There is some evidence that the membrane-initiated effects of E2 and G-1 in breast cancer cells are not mediated by GPER but require ERα36, a splice variant of ERα lacking exons 1, 7, and 8 and having an added unique 27-amino acid exon at the C terminus (36). ERα36 was reported to be higher in HCC compared with normal or cirrhotic liver (62). We observed that DHEA and G-1 increased ERα36 mRNA and protein in HepG2 cells. This is, to our knowledge, the first report of ERα36 expression in HepG2 cells and its up-regulation by DHEA. DHEA-induced ERα36 mRNA expression was ablated by siGPER, in agreement with cross-talk between GPER and ERα36 in breast cancer cells (36).
Preincubation of HCC38 breast cancer cells with an ERα36 antibody inhibited E2-induced cell proliferation and PKC activity (63). Similarly, preincubation of HepG2 cells with an ERα36 antibody inhibited DHEA-induced miR-21 expression at 1 h. The pathway of rapid membrane-initiated E2 signaling by ERα36 is thought to involve activation of PLC, PKC, Src, and ERK1/2 (63). The connection between ERα36 and GPER in HepG2- and DHEA-induced miR-21 expression likely involves these pathways, as indicated by the ability of Src kinase inhibitor PP2 and MAPK inhibitor PD98059 to inhibit DHEA-induced miR-21 transcription. There is also evidence of interactions between GPER and EGFR (58, 59) as well as between full length ERα, ERα36, ERα46, and GPER, suggesting “complex stimulatory networks” (for review, see Ref. 64) that require further elucidation.
ERβ is usually a tumor suppressor (65), and unliganded ERβ occupies AP-1 sites when overexpressed in U2OS cells (66). The “dismissal” of ERβ from the miR-21 promoter in cells treated with DHEA or G-1 at the time of AP-1 recruitment is consistent with these data. ERβ and other nuclear receptors show cell-specific and ligand-dependent DNA binding sites, and ERβ-ChIP-RNA seq and Argonaut 2-HITS-CLIP will be required to fully characterize the DHEA transcriptome and which miRNA-mRNA pairs are DHEA-regulated in HepG2 cells. Although the AR antagonist bicalutamide did not affect DHEA-induced pri-miR-21 transcription, we observed an ∼2-fold increase in AR recruitment to the miR-21 promoter with DHEA treatment, suggesting a direct role for AR in mediating the rapid increase in pri-miR-21 transcription stimulated by DHEA in HepG2 cells. We note that DHEA-BSA activated miR-21 transcription, a result that cannot be attributed to intracellular AR, although we cannot exclude the potential for direct DHEA-AR binding (dotted line in Fig. 8). However, this seems unlikely as most of our mechanistic experiments used 10 nm DHEA, well lower than the Kd ∼ 1–2 μm for DHEA-AR binding (7).
Nuclear receptors and AP-1 recruit coregulators that are regulated by phosphorylation and other post-translational modifications. Because DHEA rapidly activated MAPK and the stimulation of pri-miR-21 transcription was inhibited by the PI3K/AKT inhibitor wortmannin, it is possible that coactivators involved in pri-miR-21 transcription are stabilized or in some other manner “activated” in response to DHEA treatment (dashed line in Fig. 8). Future studies are necessary to determine the contribution of AP-1, AR, and co-activator phosphorylation on DHEA-mediated miR-21 expression in HepG2 cells.
In summary, this study revealed that a rapid increase in miR-21 transcription stimulated by DHEA in HepG2 cells involves GPER and ERα36, which activate Src, EGFR, ERK1/2, and PI3K/AKT signaling and AR and AP-1 recruitment to the miR-21 promoter. The increase in miR-21 reduced PDCD4. Whether DHEA or its metabolites contribute to gender differences in HCC by increasing oncomiR-21 requires further examination.
Acknowledgments
We thank Drs. Boaz Robinzon and Brian Ceresa for suggestions for experiments. We thank Dr. Zhaoyi Wang of Creighton University School of Medicine for the pCR3.1-ERα36 expression vector and the ERα36 antibody.
This work was supported, in whole or in part, by National Institutes of Health Grant R01 CA138410 (to C. M. K.). The authors declare that they have no conflicts of interest with the contents of this article.
- DHEA
- dehydroepiandrosterone
- miR-21
- microRNA-21
- GPER (GPR30)
- G-protein-coupled estrogen receptor
- HCC
- hepatocellular carcinoma
- ER
- estrogen receptor
- AR
- androgen receptor
- PM
- plasma membrane
- GPCR
- G-protein-coupled receptor
- DHT
- dihydrotestosterone
- E2
- 17β-estradiol
- MβCD
- methyl-β-cyclodextrin
- CHX
- cycloheximide
- PT
- pertussis toxin
- ActD
- actinomycin D
- PP2
- 4-amino-5-(4-chlorophenyl)-7-(t-butyl)pyrazolo[3,4-d]pyrimidine
- qPCR
- quantitative real-time PCR
- WCE
- whole cell extract
- EGFR
- epidermal growth factor receptor
- pri-miR-21
- primary miR-21
- ARE
- androgen response element.
References
- 1. Rege J., Nakamura Y., Satoh F., Morimoto R., Kennedy M. R., Layman L. C., Honma S., Sasano H., Rainey W. E. (2013) Liquid chromatography-tandem mass spectrometry analysis of human adrenal vein 19-carbon steroids before and after ACTH stimulation. J. Clin. Endocrinol. Metab. 98, 1182–1188 [DOI] [PMC free article] [PubMed] [Google Scholar]
- 2. Labrie F., Bélanger A., Cusan L., Gomez J.-L., Candas B. (1997) Marked decline in serum concentrations of adrenal C19 sex steroid precursors and conjugated androgen metabolites during aging. J. Clin. Endocrinol. Metab. 82, 2396–2402 [DOI] [PubMed] [Google Scholar]
- 3. Mayer D., Forstner K. (2004) Impact of dehydroepiandrosterone on hepatocarcinogenesis in the rat (review). Int. J. Oncol. 25, 1021–1030 [PubMed] [Google Scholar]
- 4. Ho H. Y., Cheng M. L., Chiu H. Y., Weng S. F., Chiu D. T. (2008) Dehydroepiandrosterone induces growth arrest of hepatoma cells via alteration of mitochondrial gene expression and function. Int. J. Oncol. 33, 969–977 [PubMed] [Google Scholar]
- 5. Samaras N., Samaras D., Frangos E., Forster A., Philippe J. (2013) A review of age-related dehydroepiandrosterone decline and its association with well-known geriatric syndromes: is treatment beneficial? Rejuvenation Res. 16, 285–294 [DOI] [PMC free article] [PubMed] [Google Scholar]
- 6. Traish A. M., Kang H. P., Saad F., Guay A. T. (2011) Dehydroepiandrosterone (DHEA): a precursor steroid or an active hormone in human physiology (CME). J. Sex. Med. 8, 2960–2982 [DOI] [PubMed] [Google Scholar]
- 7. Webb S. J., Geoghegan T. E., Prough R. A., Michael Miller K. K. (2006) The biological actions of dehydroepiandrosterone involves multiple receptors. Drug Metab. Rev. 38, 89–116 [DOI] [PMC free article] [PubMed] [Google Scholar]
- 8. Liu D., Dillon J. S. (2004) Dehydroepiandrosterone stimulates nitric oxide release in vascular endothelial cells: evidence for a cell surface receptor. Steroids 69, 279–289 [DOI] [PubMed] [Google Scholar]
- 9. Charalampopoulos I., Alexaki V.-I., Lazaridis I., Dermitzaki E., Avlonitis N., Tsatsanis C., Calogeropoulou T., Margioris A. N., Castanas E., Gravanis A. (2006) G protein-associated, specific membrane binding sites mediate the neuroprotective effect of dehydroepiandrosterone. FASEB J. 20, 577–579 [DOI] [PubMed] [Google Scholar]
- 10. Moriguchi S., Shinoda Y., Yamamoto Y., Sasaki Y., Miyajima K., Tagashira H., Fukunaga K. (2013) Stimulation of the sigma-1 receptor by DHEA enhances synaptic efficacy and neurogenesis in the hippocampal dentate gyrus of olfactory bulbectomized Mice. PLoS ONE 8, e60863. [DOI] [PMC free article] [PubMed] [Google Scholar]
- 11. El-Serag H. B. (2011) Hepatocellular carcinoma. N. Engl. J. Med. 365, 1118–1127 [DOI] [PubMed] [Google Scholar]
- 12. Li Z., Tuteja G., Schug J., Kaestner K. H. (2012) Foxa1 and Foxa2 are essential for sexual dimorphism in liver cancer. Cell 148, 72–83 [DOI] [PMC free article] [PubMed] [Google Scholar]
- 13. Dowman J. K., Hopkins L. J., Reynolds G. M., Armstrong M. J., Nasiri M., Nikolaou N., van Houten E. L., Visser J. A., Morgan S. A., Lavery G. G., Oprescu A., Hübscher S. G., Newsome P. N., Tomlinson J. W. (2013) Loss of 5α-reductase type 1 accelerates the development of hepatic steatosis but protects against hepatocellular carcinoma in male mice. Endocrinology 154, 4536–4547 [DOI] [PMC free article] [PubMed] [Google Scholar]
- 14. Wu M.-H., Ma W.-L., Hsu C.-L., Chen Y.-L., Ou J.-H. J., Ryan C. K., Hung Y.-C., Yeh S., Chang C. (2010) Androgen receptor promotes hepatitis B virus-induced hepatocarcinogenesis through modulation of hepatitis B virus RNA transcription. Sci. Transl. Med. 2, 32ra35. [DOI] [PMC free article] [PubMed] [Google Scholar]
- 15. Nie H., Cao Q., Zhu L., Gong Y., Gu J., He Z. (2013) Acetylcholine acts on androgen receptor to promote the migration and invasion but inhibit the apoptosis of human hepatocarcinoma. PLoS ONE 8, e61678. [DOI] [PMC free article] [PubMed] [Google Scholar]
- 16. Dorak M. T., Karpuzoglu E. (2012) Gender Differences in cancer susceptibility: an inadequately addressed issue. Front. Genet. 3, 268. [DOI] [PMC free article] [PubMed] [Google Scholar]
- 17. Yang W., Lu Y., Xu Y., Xu L., Zheng W., Wu Y., Li L., Shen P. (2012) Estrogen represses hepatocellular carcinoma (HCC) growth via inhibiting alternative activation of tumor-associated macrophages (TAMs). J. Biol. Chem. 287, 40140–40149 [DOI] [PMC free article] [PubMed] [Google Scholar]
- 18. Meng F., Henson R., Wehbe-Janek H., Ghoshal K., Jacob S. T., Patel T. (2007) MicroRNA-21 regulates expression of the PTEN tumor suppressor gene in human hepatocellular cancer. Gastroenterology 133, 647–658 [DOI] [PMC free article] [PubMed] [Google Scholar]
- 19. Borel F., Konstantinova P., Jansen P. L. (2012) Diagnostic and therapeutic potential of miRNA signatures in patients with hepatocellular carcinoma. J. Hepatol. 56, 1371–1383 [DOI] [PubMed] [Google Scholar]
- 20. Androsavich J. R., Chau B. N., Bhat B., Linsley P. S., Walter N. G.(2012) Disease-linked microRNA-21 exhibits drastically reduced mRNA binding and silencing activity in healthy mouse liver. RNA 18, 1510–1526 [DOI] [PMC free article] [PubMed] [Google Scholar]
- 21. Francis H., McDaniel K., Han Y., Liu X., Kennedy L., Yang F., McCarra J., Zhou T., Glaser S., Venter J., Huang L., Levine P., Lai J.-M., Liu C.-G., Alpini G., Meng F. (2014) Regulation of the extrinsic apoptotic pathway by microRNA-21 in alcoholic liver injury. J. Biol. Chem. 289, 27526–27539 [DOI] [PMC free article] [PubMed] [Google Scholar]
- 22. Lu Z., Liu M., Stribinskis V., Klinge C. M., Ramos K. S., Colburn N. H., Li Y. (2008) MicroRNA-21 promotes cell transformation by targeting the programmed cell death 4 gene. Oncogene 27, 4373–4379 [DOI] [PMC free article] [PubMed] [Google Scholar]
- 23. Zhang H., Ozaki I., Mizuta T., Hamajima H., Yasutake T., Eguchi Y., Ideguchi H., Yamamoto K., Matsuhashi S. (2006) Involvement of programmed cell death 4 in transforming growth factor-β1-induced apoptosis in human hepatocellular carcinoma. Oncogene 25, 6101–6112 [DOI] [PubMed] [Google Scholar]
- 24. Zhu Q., Wang Z., Hu Y., Li J., Li X., Zhou L., Huang Y. (2012) miR-21 promotes migration and invasion by the miR-21-PDCD4-AP-1 feedback loop in human hepatocellular carcinoma. Oncol. Rep. 27, 1660–1668 [DOI] [PubMed] [Google Scholar]
- 25. Huang Y.-H., Lin Y.-H., Chi H.-C., Liao C.-H., Liao C.-J., Wu S.-M., Chen C.-Y., Tseng Y.-H., Tsai C.-Y., Lin S.-Y., Hung Y.-T., Wang C.-J., Lin C. D., Lin K.-H. (2013) Thyroid hormone regulation of miR-21 enhances migration and invasion of hepatoma. Cancer Res. 73, 2505–2517 [DOI] [PubMed] [Google Scholar]
- 26. Teng Y., Litchfield L. M., Ivanova M. M., Prough R. A., Clark B. J., Klinge C. M. (2014) Dehydroepiandrosterone-induces miR-21 transcription in HepG2 cells through estrogen receptor β and androgen receptor. Mol. Cell. Endocrinol. 392, 23–36 [DOI] [PMC free article] [PubMed] [Google Scholar]
- 27. Simoncini T., Scorticati C., Mannella P., Fadiel A., Giretti M. S., Fu X.-D., Baldacci C., Garibaldi S., Caruso A., Fornari L., Naftolin F., Genazzani A. R. (2006) Estrogen receptor α interacts with Gα13 to drive actin remodeling and endothelial cell migration via the RhoA/Rho kinase/moesin pathway. Mol. Endocrinol. 20, 1756–1771 [DOI] [PubMed] [Google Scholar]
- 28. Chen J., An B.-S., Cheng L., Hammond G. L., Leung P. C. (2009) Gonadotropin-releasing hormone-mediated phosphorylation of estrogen receptor-α contributes to fosB expression in mouse gonadotrophs. Endocrinology 150, 4583–4593 [DOI] [PubMed] [Google Scholar]
- 29. Lobenhofer E. K., Huper G., Iglehart J. D., Marks J. R. (2000) Inhibition of mitogen-activated protein kinase and phosphatidylinositol 3-kinase activity in MCF-7 cells prevents estrogen-induced mitogenesis. Cell Growth Differ. 11, 99–110 [PubMed] [Google Scholar]
- 30. Dong B., Cheng W., Li W., Zheng J., Wu D., Matsumura F., Vogel C. F. (2011) FRET analysis of protein-tyrosine kinase c-Src activation mediated via aryl hydrocarbon receptor. Biochim. Biophys. Acta 1810, 427–431 [DOI] [PMC free article] [PubMed] [Google Scholar]
- 31. Bourdeau V., Deschênes J., Laperrière D., Aid M., White J. H., Mader S. (2008) Mechanisms of primary and secondary estrogen target gene regulation in breast cancer cells. Nucleic Acids Res. 36, 76–93 [DOI] [PMC free article] [PubMed] [Google Scholar]
- 32. Jin S. H., Lee Y. Y., Kang H. Y. (2008) Methyl-β-cyclodextrin, a specific cholesterol-binding agent, inhibits melanogenesis in human melanocytes through activation of ERK. Arch. Dermatol. Res. 300, 451–454 [DOI] [PubMed] [Google Scholar]
- 33. Tiwary R., Yu W., deGraffenried L. A., Sanders B. G., Kline K. (2011) Targeting cholesterol-rich microdomains to circumvent tamoxifen-resistant breast cancer. Breast Cancer Res. 13, R120. [DOI] [PMC free article] [PubMed] [Google Scholar]
- 34. Pinthus J. H., Bryskin I., Trachtenberg J., Lu J. P., Singh G., Fridman E., Wilson B. C. (2007) Androgen induces adaptation to oxidative stress in prostate cancer: implications for treatment with radiation therapy. Neoplasia 9, 68–80 [DOI] [PMC free article] [PubMed] [Google Scholar]
- 35. Fox E. M., Bernaciak T. M., Wen J., Weaver A. M., Shupnik M. A., Silva C. M. (2008) Signal transducer and activator of transcription 5b, c-Src, and epidermal growth factor receptor signaling play integral roles in estrogen-stimulated proliferation of estrogen receptor-positive breast cancer cells. Mol. Endocrinol. 22, 1781–1796 [DOI] [PMC free article] [PubMed] [Google Scholar]
- 36. Santolla M. F., Lappano R., De Marco P., Pupo M., Vivacqua A., Sisci D., Abonante S., Iacopetta D., Cappello A. R., Dolce V., Maggiolini M. (2012) G protein-coupled estrogen receptor mediates the up-regulation of fatty acid synthase induced by 17β-estradiol in cancer cells and cancer-associated fibroblasts. J. Biol. Chem. 287, 43234–43245 [DOI] [PMC free article] [PubMed] [Google Scholar]
- 37. Zou Y., Ding L., Coleman M., Wang Z. (2009) Estrogen receptor-α (ER-α) suppresses expression of its variant ER-α36. FEBS Lett. 583, 1368–1374 [DOI] [PMC free article] [PubMed] [Google Scholar]
- 38. Deng H., Zhang X.-T., Wang M.-L., Zheng H.-Y., Liu L.-J., Wang Z.-Y. (2014) er-α36-mediated rapid estrogen signaling positively regulates ER-positive breast cancer stem/progenitor cells. PLoS ONE 9, e88034. [DOI] [PMC free article] [PubMed] [Google Scholar]
- 39. Girgert R., Emons G., Gründker C. (2012) Inactivation of GPR30 reduces growth of triple-negative breast cancer cells: possible application in targeted therapy. Breast Cancer Res. Treat. 134, 199–205 [DOI] [PMC free article] [PubMed] [Google Scholar]
- 40. Wallacides A., Chesnel A., Ajj H., Chillet M., Flament S., Dumond H. (2012) Estrogens promote proliferation of the seminoma-like TCam-2 cell line through a GPER-dependent ERα36 induction. Mol. Cell. Endocrinol. 350, 61–71 [DOI] [PubMed] [Google Scholar]
- 41. Kang L., Zhang X., Xie Y., Tu Y., Wang D., Liu Z., Wang Z.-Y. (2010) Involvement of estrogen receptor variant ER-α36, not GPR30, in nongenomic estrogen signaling. Mol. Endocrinol. 24, 709–721 [DOI] [PMC free article] [PubMed] [Google Scholar]
- 42. Ikeda Y., Tajima S., Izawa-Ishizawa Y., Kihira Y., Ishizawa K., Tomita S., Tsuchiya K., Tamaki T. (2012) Estrogen regulates hepcidin expression via GPR30-BMP6-dependent signaling in hepatocytes. PLoS ONE 7, e40465. [DOI] [PMC free article] [PubMed] [Google Scholar]
- 43. Riggs K. A., Wickramasinghe N. S., Cochrum R. K., Watts M. B., Klinge C. M. (2006) Decreased chicken ovalbumin upstream promoter transcription factor II expression in tamoxifen-resistant breast cancer cells. Cancer Res. 66, 10188–10198 [DOI] [PubMed] [Google Scholar]
- 44. Mattingly K. A., Ivanova M. M., Riggs K. A., Wickramasinghe N. S., Barch M. J., Klinge C. M. (2008) Estradiol stimulates transcription of nuclear respiratory factor-1 and increases mitochondrial biogenesis. Mol. Endocrinol. 22, 609–622 [DOI] [PMC free article] [PubMed] [Google Scholar]
- 45. Terao M., Fratelli M., Kurosaki M., Zanetti A., Guarnaccia V., Paroni G., Tsykin A., Lupi M., Gianni M., Goodall G. J., Garattini E. (2011) Induction of miR-21 by retinoic acid in estrogen receptor-positive breast carcinoma cells: biological correlates and molecular targets. J. Biol. Chem. 286, 4027–4042 [DOI] [PMC free article] [PubMed] [Google Scholar]
- 46. Rodal S. K., Skretting G., Garred O., Vilhardt F., van Deurs B., Sandvig K. (1999) Extraction of cholesterol with methyl-β-cyclodextrin perturbs formation of clathrin-coated endocytic vesicles. Mol. Biol. Cell 10, 961–974 [DOI] [PMC free article] [PubMed] [Google Scholar]
- 47. Fujita S., Ito T., Mizutani T., Minoguchi S., Yamamichi N., Sakurai K., Iba H. (2008) miR-21 gene expression triggered by AP-1 is sustained through a double-negative feedback mechanism. J. Mol. Biol. 378, 492–504 [DOI] [PubMed] [Google Scholar]
- 48. Mudduluru G., George-William J. N., Muppala S., Asangani I. A., Kumarswamy R., Nelson L. D., Allgayer H. (2011) Curcumin regulates miR-21 expression and inhibits invasion and metastasis in colorectal cancer. Biosci. Rep. 31, 185–197 [DOI] [PubMed] [Google Scholar]
- 49. Niro S., Pereira E., Pélissier M.-A., Morfin R., Hennebert O. (2012) The DHEA metabolite 7β-hydroxy-epiandrosterone exerts anti-estrogenic effects on breast cancer cell lines. Steroids 77, 542–551 [DOI] [PubMed] [Google Scholar]
- 50. Bologa C. G., Revankar C. M., Young S. M., Edwards B. S., Arterburn J. B., Kiselyov A. S., Parker M. A., Tkachenko S. E., Savchuck N. P., Sklar L. A., Oprea T. I., Prossnitz E. R. (2006) Virtual and biomolecular screening converge on a selective agonist for GPR30. Nat. Chem. Biol. 2, 207–212 [DOI] [PubMed] [Google Scholar]
- 51. Prossnitz E. R., Barton M. (2011) The G-protein-coupled estrogen receptor GPER in health and disease. Nat. Rev. Endocrinol. 7, 715–726 [DOI] [PMC free article] [PubMed] [Google Scholar]
- 52. Dennis M. K., Burai R., Ramesh C., Petrie W. K., Alcon S. N., Nayak T. K., Bologa C. G., Leitao A., Brailoiu E., Deliu E., Dun N. J., Sklar L. A., Hathaway H. J., Arterburn J. B., Oprea T. I., Prossnitz E. R. (2009) In vivo effects of a GPR30 antagonist. Nat. Chem. Biol. 5, 421–427 [DOI] [PMC free article] [PubMed] [Google Scholar]
- 53. Dinneen J. L., Ceresa B. P. (2004) Continual Expression of Rab5(Q79L) causes a ligand-independent EGFR internalization and diminishes EGFR activity. Traffic 5, 606–615 [DOI] [PubMed] [Google Scholar]
- 54. Prossnitz E. R., Barton M. (2014) Estrogen biology: new insights into GPER function and clinical opportunities. Mol. Cell. Endocrinol. 389, 71–83 [DOI] [PMC free article] [PubMed] [Google Scholar]
- 55. Joel P. B., Traish A. M., Lannigan D. A. (1998) Estradiol-induced phosphorylation of serine 118 in the estrogen receptor is independent of p42/p44 mitogen-activated protein kinase. J. Biol. Chem. 273, 13317–13323 [DOI] [PubMed] [Google Scholar]
- 56. Chan Q. K., Lam H. M., Ng C. F., Lee A. Y., Chan E. S., Ng H. K., Ho S. M., Lau K. M. (2010) Activation of GPR30 inhibits the growth of prostate cancer cells through sustained activation of Erk1/2, c-jun/c-fos-dependent up-regulation of p21, and induction of G2 cell-cycle arrest. Cell Death Differ. 17, 1511–1523 [DOI] [PMC free article] [PubMed] [Google Scholar]
- 57. Anagnostopoulou V., Pediaditakis I., Alkahtani S., Alarifi S. A., Schmidt E.-M., Lang F., Gravanis A., Charalampopoulos I., Stournaras C. (2013) Differential effects of dehydroepiandrosterone and testosterone in prostate and colon cancer cell apoptosis: the role of nerve growth factor (NGF) receptors. Endocrinology 154, 2446–2456 [DOI] [PubMed] [Google Scholar]
- 58. Madeo A., Maggiolini M. (2010) Nuclear alternate estrogen receptor GPR30 mediates 17β-estradiol-induced gene expression and migration in breast cancer-associated fibroblasts. Cancer Res. 70, 6036–6046 [DOI] [PubMed] [Google Scholar]
- 59. Filardo E. J., Thomas P. (2012) Minireview: G protein-coupled estrogen receptor-1, GPER-1: its mechanism of action and role in female reproductive cancer, renal and vascular physiology. Endocrinology 153, 2953–2962 [DOI] [PMC free article] [PubMed] [Google Scholar]
- 60. Prossnitz E. R., Maggiolini M. (2009) Mechanisms of estrogen signaling and gene expression via GPR30. Mol. Cell. Endocrinol. 308, 32–38 [DOI] [PMC free article] [PubMed] [Google Scholar]
- 61. Wang Y., Ripperger J., Fey G. H., Samols D., Kordula T., Wetzler M., Van Etten R. A., Baumann H. (1999) Modulation of hepatic acute phase gene expression by epidermal growth factor and Src protein-tyrosine kinases in murine and human hepatic cells. Hepatology 30, 682–697 [DOI] [PubMed] [Google Scholar]
- 62. Miceli V., Cocciadiferro L., Fregapane M., Zarcone M., Montalto G., Polito L. M., Agostara B., Granata O. M., Carruba G. (2011) Expression of wild-type and variant estrogen receptor α in liver carcinogenesis and tumor progression. OMICS 15, 313–317 [DOI] [PubMed] [Google Scholar]
- 63. Chaudhri R. A., Olivares-Navarrete R., Cuenca N., Hadadi A., Boyan B. D., Schwartz Z. (2012) Membrane estrogen signaling enhances tumorigenesis and metastatic potential of breast cancer cells via estrogen receptor-α36 (ERα36). J. Biol. Chem. 287, 7169–7181 [DOI] [PMC free article] [PubMed] [Google Scholar]
- 64. Notas G., Kampa M., Pelekanou V., Castanas E. (2012) Interplay of estrogen receptors and GPR30 for the regulation of early membrane initiated transcriptional effects: A pharmacological approach. Steroids 77, 943–950 [DOI] [PubMed] [Google Scholar]
- 65. Dey P., Barros R. P., Warner M., Ström A., Gustafsson J.-Å. (2013) Insight into the mechanisms of action of estrogen receptor β in the breast, prostate, colon, and CNS. J. Mol. Endocrinol. 51, T61–T74 [DOI] [PubMed] [Google Scholar]
- 66. Vivar O. I., Zhao X., Saunier E. F., Griffin C., Mayba O. S., Tagliaferri M., Cohen I., Speed T. P., Leitman D. C. (2010) Estrogen receptor β binds to and regulates three distinct classes of target genes. J. Biol. Chem. 285, 22059–22066 [DOI] [PMC free article] [PubMed] [Google Scholar]
- 67. Qu K. Z., Zhang K., Li H., Afdhal N. H., Albitar M. (2011) Circulating microRNAs as biomarkers for hepatocellular carcinoma. J. Clin. Gastroenterol. 45, 355–360 [DOI] [PubMed] [Google Scholar]
- 68. Cermelli S., Ruggieri A., Marrero J. A., Ioannou G. N., Beretta L. (2011) Circulating microRNAs in patients with chronic hepatitis C and non-alcoholic fatty liver disease. PLoS ONE 6, e23937. [DOI] [PMC free article] [PubMed] [Google Scholar]
- 69. Turato C., Simonato D., Quarta S., Gatta A., Pontisso P. (2014) MicroRNAs and serpinB3 in hepatocellular carcinoma. Life Sci. 100, 9–17 [DOI] [PubMed] [Google Scholar]
- 70. Jiang R., Deng L., Zhao L., Li X., Zhang F., Xia Y., Gao Y., Wang X., Sun B. (2011) miR-22 promotes HBV-related hepatocellular carcinoma development in males. Clin. Cancer Res. 17, 5593–5603 [DOI] [PubMed] [Google Scholar]
- 71. Lin F., Ding R., Zheng S., Xing D., Hong W., Zhou Z., Shen J. (2014) Decrease expression of microRNA-744 promotes cell proliferation by targeting c-Myc in human hepatocellular carcinoma. Cancer Cell Int. 14, 58. [DOI] [PMC free article] [PubMed] [Google Scholar]