

Background: Mycobacteria have no soluble cytochrome c; the electron transfer chain involves a Complex III-IV “supercomplex.”
Results: Expression of the M. tuberculosis Complex III in M. smegmatis lacking native complex yields a functional hybrid supercomplex.
Conclusion: This supercomplex is a dimer of protomers containing two each of hemes A, B, and C.
Significance: This is the first purification of respiratory Complex III or IV from Mycobacterium.
Keywords: electron transfer complex, enzyme purification, Mycobacterium smegmatis, Mycobacterium tuberculosis, respiratory chain, Q203, cytochrome bcc, respiratory supercomplex
Abstract
Recently, energy production pathways have been shown to be viable antitubercular drug targets to combat multidrug-resistant tuberculosis and eliminate pathogen in the dormant state. One family of drugs currently under development, the imidazo[1,2-a]pyridine derivatives, is believed to target the pathogen's homolog of the mitochondrial bc1 complex. This complex, denoted cytochrome bcc, is highly divergent from mitochondrial Complex III both in subunit structure and inhibitor sensitivity, making it a good target for drug development. There is no soluble cytochrome c in mycobacteria to transport electrons from the bcc complex to cytochrome oxidase. Instead, the bcc complex exists in a “supercomplex” with a cytochrome aa3-type cytochrome oxidase, presumably allowing direct electron transfer. We describe here purification and initial characterization of the mycobacterial cytochrome bcc-aa3 supercomplex using a strain of M. smegmatis that has been engineered to express the M. tuberculosis cytochrome bcc. The resulting hybrid supercomplex is stable during extraction and purification in the presence of dodecyl maltoside detergent. It is hoped that this purification procedure will potentiate functional studies of the complex as well as crystallographic studies of drug binding and provide structural insight into a third class of the bc complex superfamily.
Introduction
Mycobacterium tuberculosis is the etiological agent of tuberculosis, an airborne disease responsible for 1.4 million deaths in 2013. Elimination of tuberculosis is complicated by the ability of the pathogen to survive for extended periods of time in a non-replicating state in granulomas and by the acquisition of mechanisms of resistance to all of the first and second line drugs used thus far. Development of new drugs targeting different pathways and effective against the latent form of the disease is thus a high priority (1). Recently, oxidative phosphorylation has been demonstrated as an effective target (2–4), and efforts are under way to increase understanding of the mycobacterial energy-producing pathways (2, 3, 5). A new drug that has recently been approved for clinical treatment, bedaquiline, targets the pathogen's ATP synthase enzyme. Although bedaquiline holds great promise for the treatment of multidrug-resistant and extensively drug-resistant tuberculosis, safety concerns still restrict the use of the drug to cases where other treatments have failed (6).
Another family of drug candidates, which has been shown to compromise the pathogen's energy production (7–9), is the imidazo[1,2-a]pyridine (IP)8 series. Two independent studies identified a single polymorphism in cytochrome b (the QcrB gene product) that confers high resistance to the IP series (8, 9). Another study, using a strain made hypersensitive by deletion of the cytochrome bd oxidase, identified seven more resistance-conferring mutations in cytochrome b (10).
The QcrCAB operon codes for the respiratory cytochrome bcc complex (11), which is a homologue of the mitochondrial cytochrome bc1 (Complex III) and the chloroplast b6f complexes. When the M. tuberculosis QcrB gene product sequence is aligned with bc1 and b6f sequences, all of the resistance-conferring mutations are near the Qp quinone-binding site, leading to the assumption that the IP drugs work by binding in the Qp site, thereby excluding the substrate (9, 10).
The original resistance mutation (8, 9) is T313A. This residue aligns with Ala-277 in human cytochrome b; thus, humans (and other vertebrates) have the resistance mutation in the normal state. Other factors are also required for sensitivity, because closely related actinobacteria, such as Mycobacterium smegmatis, have Thr in this position and yet are resistant. Thus, it is not surprising that preclinical studies of lead IP drug candidates have shown low toxicity in vertebrates (8, 9, 12). The leading drug candidate, Q203, combines this low toxicity with high activity against multidrug-resistant and extensively drug-resistant clinical isolates and high potency at low dose in a mouse model of tuberculosis (8, 9, 12).
Both mitochondrial cytochrome bc1 (Complex III) and mycobacterial cytochrome bcc belong to an evolutionarily related superfamily of “cytochrome bc” complexes catalyzing electron transfer from a hydrophobic quinol to a proteinaceous acceptor (13). The members have three redox cofactor-bearing proteins: cytochrome b, a c-type cytochrome, and an iron-sulfur protein of the Rieske type. The cytochrome b and iron-sulfur protein sequences are evolutionarily related,, whereas the c-type cytochromes appear to be unrelated. The superfamily has four major subdivisions differentiated (among other things) by whether the cytochrome b sequences are present on one polypeptide or split into two and the type of c cytochrome (Fig. 1). The most familiar examples are the mitochondrial or proteobacterial cytochrome bc1 complexes and chloroplast or cyanobacterial b6f complexes. For the bc1 complexes, the minimal unit consists of cytochrome b with eight transmembrane helices (TMHs), cytochrome c1 with a single C-terminal TMH, and a Rieske-type high potential Fe2S2 iron-sulfur complex with a single N-terminal TMH.
FIGURE 1.
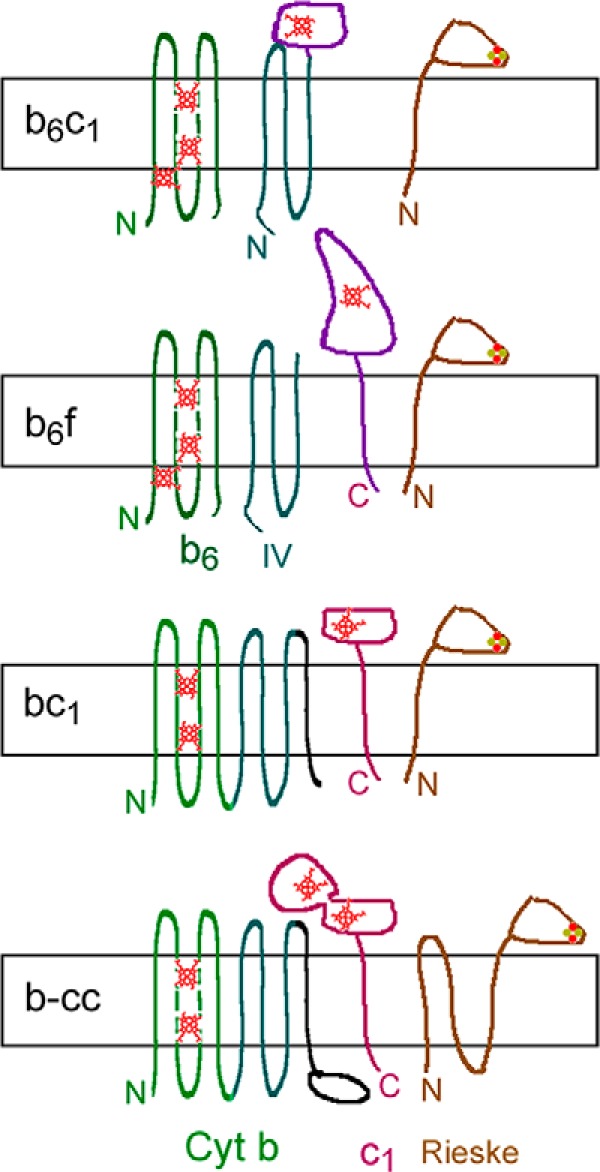
Four divisions of bc complexes. N and C, N and C termini; small red figures, hemes. The rectangular slab represents the energy-transducing membrane, with P side above and N side below. The mycobacterial bcc complex cytochrome b has sequences corresponding to b6 and SUIV in a single polypeptide like mitochondrial cyt b but with an extension on the C terminus. The c-type cytochrome has two hemes and is the only c-type cytochrome in the genome. The iron-sulfur protein apparently has three transmembrane helices.
The b6f complexes have cytochrome b sequences split over two subunits. Cytochrome b6 has sequences homologous to the first four TMHs of cyt b, which form a four-helix bundle enclosing the two hemes (green in Fig. 1). Subunit 4 (SUIV) has sequences corresponding to TMHs 5–7 of cyt b (blue-green), including the highly conserved PEWY sequence that lines one side of the quinol-oxidizing Qp site. They have an unrelated c cytochrome (cytochrome f) and a Rieske protein.
The b6c1 complexes of firmicutes (Gram-positive organisms with low GC content) typified by Geobacillus stearothermophilus (formerly Bacillus stearothermophilus) have a short cyt b subunit like b6 (14). The three transmembrane helices homologous to SUIV are fused to a cytochrome c, which is not closely related to either mitochondrial cyt c1 or cytochrome f.
The cytochrome bcc complexes of GC-rich Gram-positive bacteria (actinobacteria) such as Mycobacterium, Corynebacterium, and Rhodococcus have a long cyt b, containing sequences aligning with b6 and SUIV, and a C-terminal extension of about 115 residues (11, 15). The Rieske protein is similar in sequence to the recently solved Rieske protein from Thermus thermophilus but has a long N-terminal extension with apparently three transmembrane helices. There is a diheme c-type cytochrome (cyt cc), with a C-terminal TMH (11, 15). It has been suggested that one cytochrome c domain is the donor for cytochrome oxidase, and the other one is the acceptor from the Rieske protein (11, 15). There is no soluble cytochrome c or any other c-type cytochrome at all in the genome. The two complexes form a supercomplex that facilitates electron transfer from menaquinol to oxygen (15–17).
QcrB is predicted to be essential based on transposon mutagenesis experiments (18, 19). Furthermore, the bcc-aa3 pathway could not be deleted by homologous recombination in M. tuberculosis (20), reinforcing the notion that it is vital for M. tuberculosis. Assuming that the IPA series target the bcc complex, such observations could explain the effectiveness of the series against M. tuberculosis in vitro and in vivo (8, 9, 12). Interestingly, disruption of the bcc-aa3 pathway is possible in M. smegmatis but leads to a profound growth impairment (20).
The essentiality of the cytochrome bcc in M. tuberculosis, together with the large differences between this menaquinol-oxidizing enzyme of the pathogen and the ubiquinol-oxidizing human mitochondrial bc1 complex, make it a good target for therapeutic intervention to control or eliminate tuberculosis.
The genes for the three cytochrome bcc subunits qcrC (cyt cc), qcrA (iron-sulfur protein), and qcrB (cyt b) are organized into the qcr (quinol cytochrome c reductase) operon. The cyt aa3 cytochrome oxidase subunits are encoded by the genes ctaC (Cox2), ctaD (Cox1), and ctaE (Cox3).
We report here the purification and initial characterization of a stable supercomplex consisting of the cytochrome bcc of M. tuberculosis and cytochrome aa3 of M. smegmatis, using untagged proteins and methods suitable for purification on a scale large enough to support crystallographic studies. We believe that this is the first reported isolation an untagged Complex III or IV from actinobacteria and the first tagless isolation of a stable Complex III-IV supercomplex from any organism.
Experimental Procedures
Bacterial Strains
M. smegmatis ΔqcrCAB (20) (kindly provided by Valerie Mizrahi and Bavesh Kana) was transformed with a replicative plasmid, pMV262, harboring the full qcrCAB operon from M. tuberculosis under the control of the hsp60 promoter. The 3775-bp fragment encoding the complete qcrCAB was amplified by polymerase chain reaction (PCR) from M. tuberculosis genomic DNA using the oligonucleotides with the following sequences: 5′-TCGAAGCTTATCGATATGACGAAACTGGGGTTCACCC-3′ and 5′-CGTACGCTAGTTAACCTAGTGCTCGCCGTCTGGCG-3′ that contain a ClaI and an HpaI restriction site (underlined), respectively. The PCR product was digested with ClaI and HpaI and then inserted into the ClaI and HpaI sites of the Escherichia coli-mycobacteria shuttle expression vector pMV262 to yield pMV262-qcrCAB. The pMV262-qcrCAB was finally transformed by electroporation into M. smegmatis ΔqcrCAB::hyg. The recombinant strain was maintained on kanamycin (25 μg/ml) and hygromycin (50 μg/ml). Antibiotics were omitted from cultures intended for protein purification.
Mycobacterial Culture
Cells were grown in Bacto brand soy tryptic broth supplemented with Tween 80 (0.5 ml/liter), at 30 °C with shaking to maintain oxygenation. Cells were grown from frozen stock in three stages (3 ml, 100 ml, and 6 1L). After the A600 reached ∼1.5, the bacteria were harvested by centrifugation and resuspended in 50 mm KPi, 0.5 mm EDTA, and PMSF and lysed either by two passages through a French pressure cell at 16,000 p.s.i. or by treatment with lysozyme and sonication. After a low speed centrifugation (1000 rpm for 5 min in the JA14 rotor (150 × g at rmax) to remove intact cells, the light yellow membranes were pelleted by centrifuging at 50,000 rpm for 4 h using a Ti70 rotor (257,000 × g). The membranes were resuspended to a concentration of 35 g/liter protein in 50 mm KPi, 0.5 mm EDTA, and 0.1 mm freshly added PMSF and frozen at −80 °C until use.
Assays
Columns were monitored during the run by absorbance at 280 nm. Elution profiles of cytochromes were determined by scanning spectra from 340 to 470 (in the fraction collector tubes) and either fitting the spectra with a standard Soret peak spectrum or measuring the absorbance difference, 415 − 371 nm. To identify the cytochromes present, portions of selected fractions were diluted and analyzed by recording spectra from 250 to 650 nm before and after reducing with dithionite. Column fractions were analyzed by SDS-gel electrophoresis, scanning the gels for fluorescent cofactors with a Typhoon 9410 imager (GE Healthcare) as described (21) to locate covalent flavoproteins; heme (peroxidase) staining (22) to locate cytochrome cc with its covalently bound hemes; and Coomassie Brilliant Blue R for protein bands. Fractions containing supercomplex were identified by the presence of cyt aa3 in the spectrum and/or the presence of cytochrome cc from spectra of ascorbate-reduced fractions or heme-stained gels. Heme was quantified in the final product by making the pyridine hemochrome as described before (23), except that K3Fe(CN)6 was omitted, and absolute reduced spectra rather than reduced-minus-oxidized spectra were used for calculating heme content.
Purification
Membranes were thawed and diluted to a final concentration of 20 g/liter protein in 50 mm KPi, pH 7.4, 100 mm NaCl, and 10 g/liter n-dodecyl β-d-maltoside (DDM). The mixture was stirred magnetically at 4 °C for 30 min and centrifuged at 18,000 rpm for 20 min using a JA20 rotor (39,000 × g). The yellow supernatants were decanted and pooled, whereas the large white pellets were discarded.
The supernatant (up to 70 ml) was diluted with 0.25 volume of cold water and loaded onto a column of DEAE-Sepharose CL6B (100 ml; 2.6 × 30 cm) equilibrated with 50 mm KPi, 100 mm NaCl, 0.5 mm EDTA, and 0.1 g/liter DDM. (In some cases, 20 mm KMOPS replaced the 50 mm KPi). After loading, the column was washed with 100 ml of the equilibration buffer and eluted with a linear gradient from that buffer to a high salt buffer containing 50 mm KPi, 500 mm NaCl, 0.5 mm EDTA, and 0.1 g/liter DDM in 200 ml. This was followed by 100 ml of the high salt buffer.
Fractions containing cytochrome bcc-aa3 were pooled and concentrated by ultrafiltration (100 kDa cut-off membrane) before layering on top of glycerol density step gradients in tubes compatible with a SW-32.Ti rotor. The gradient was made by layering 10, 14, and 10 ml of 60, 40, and 20% (w/v) glycerol, 20 mm KMOPS, 100 mm NaCl, and 0.5 mm EDTA. The gradients were then centrifuged at 30,000 rpm for 72 h and fractionated by pumping out from the bottom, through a stainless steel cannula inserted down from the top of the tube, into a fraction collector. The gradients were fractionated one after another into the same set of tubes, which were then analyzed by Soret spectra, full dithionite-reduced spectra of selected fractions, and gel electrophoresis.
Fractions containing cytochrome bcc-aa3 were pooled and loaded without dilution onto a 7 × 1.5-cm Q-Sepharose column equilibrated with the same equilibration buffer as for the first (DEAE) column and eluted similarly but with 30, 100, and 45 ml for wash, gradient, and high salt wash.
Fractions containing the cytochrome bcc-aa3 were pooled, concentrated to 3 ml by ultrafiltration, and chromatographed on a 1.5 × 113-cm (200 ml) column of Sepharose CL-6B equilibrated with 20 mm KMOPS, 100 mm NaCl, 0.5 mm EDTA, and 0.1 g/liter DDM. Fractions containing cyt bcc-aa3 were pooled and concentrated and, in some cases, further purified on a second glycerol density gradient.
Results and Discussion
Expression of the M. tuberculosis qcrCAB Operon in M. smegmatis ΔqcrCAB Strain Restores Robust Growth
The M. tuberculosis bcc complex (QcrCAB) was overexpressed in the strain M. smegmatis ΔqcrCAB::hyg. The M. smegmatis strain deficient for the expression of the bcc complex was previously shown to be viable but severely attenuated for growth (20). In Fig. 2, we show that the expression of the M. tuberculosis bcc complex restored the growth of the M. smegmatis ΔqcrCAB to a large extent. This result shows that the M. tuberculosis bcc complex is inserted into the membranes and can functionally complement the absence of the native M. smegmatis complex.
FIGURE 2.
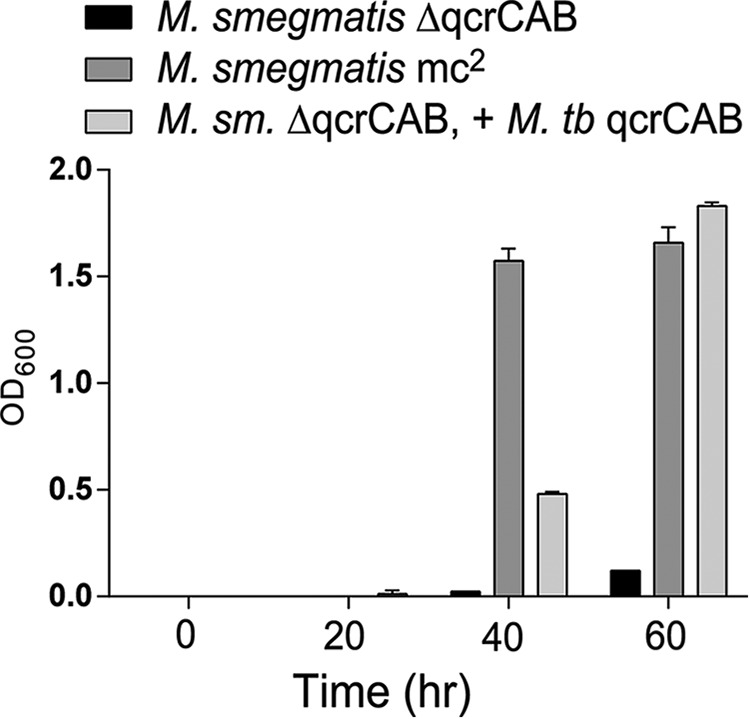
Expressing M. tuberculosis qcrCAB (cyt bcc) overcomes to a large extent the growth defect of M. smegmatis ΔqcrCAB. Rich growth medium (7H9 Middlebrook broth plus 0.2% glycerol, 0.05% Tween 80, supplemented with 10% ADS (0.5% bovine albumin fraction V, 0.2% glucose, 140 mm NaCl)) was inoculated with the indicated strain at time 0, and A600 was read at the indicated times. The error bars show S.D. from triplicate cultures of each strain. The strains are described under “Experimental Procedures.”
Electron Transport Properties of the Membranes Prepared from M. smegmatis
Membranes from M. smegmatis or M. smegmatis ΔqcrCAB_pMV262-MtbQcrCAB catalyze rapid oxidation of NADH. Fig. 3 shows spectral changes of membranes suspended in aerobic buffer after adding NADH. Only a slight reduction of cytochromes aa3 and cc is seen (Fig. 3, trace 1) until the medium becomes anoxic. At that point, c- and a-type cytochrome(s) are reduced, as indicated by peaks at 552 and 600 nm (trace 2). The b cytochromes are partly reduced (shoulder at 562 nm). Upon adding dithionite (trace 3), b cytochromes become further reduced, giving a flat-topped peak extending from 552 to 563 nm. The spectrum of the additional cytochromes reduced by dithionite has its peak at 563 nm (trace 3 − 2).
FIGURE 3.
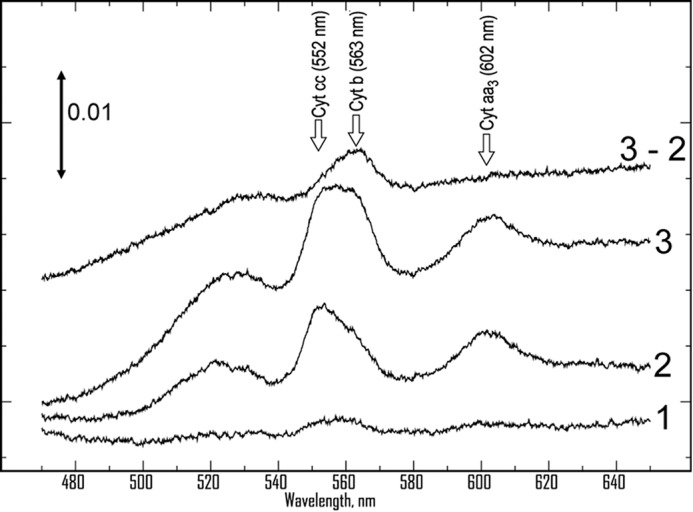
Absorbance spectra of cytochromes in the membranes of M. smegmatis. Membranes were diluted (to 0.6 g/liter protein in 50 mm KPi, 0.5 mm EDTA, pH 7.5), and a baseline was recorded, which has been subtracted from the subsequent spectra. NADH was added, and spectra were repeatedly scanned until the sample became anoxic, as indicated by increased reduction of cytochromes (trace 2), as compared with trace 1 taken while O2 was present. Finally, sodium dithionite was added (trace 3), leading to additional reduction of b-type cytochrome(s), as indicated by the difference spectrum (trace 3 − 2). The spectra have been displaced vertically by arbitrary amounts to avoid overlap.
Purification
We were able to purify the intact bcc-aa3 complex from M. smegmatis ΔqcrCAB expressing the M. tuberculosis qcrCAB operon by a procedure involving membrane extraction with DDM, two ion exchange chromatographies, density gradient centrifugation, and size exclusion chromatography. Extraction of membranes with 0.5 g of DDM/g of protein solubilized essentially all of the cytochromes, as determined by pyridine hemochrome analysis of the supernatant and pellet (not shown). From this extract, the cyt bcc-aa3 supercomplex was purified as described under “Experimental Procedures.”
Anion Exchange Chromatography Begins the Separation and Reveals the Different Spectral Signatures of Different Cytochrome Complexes
First, a large DEAE-Sepharose column was used to obtain a crude fractionation. Spectra of selected fractions from this column are shown in Fig. 4. In this case, the supernatant was not diluted before applying, and the flow-through fractions contained some c- and a-type cytochromes. Even with dilution before loading, a small amount of c- and a-type cytochromes did not bind to the column, which may represent cytochromes not assembled into the supercomplex.
FIGURE 4.
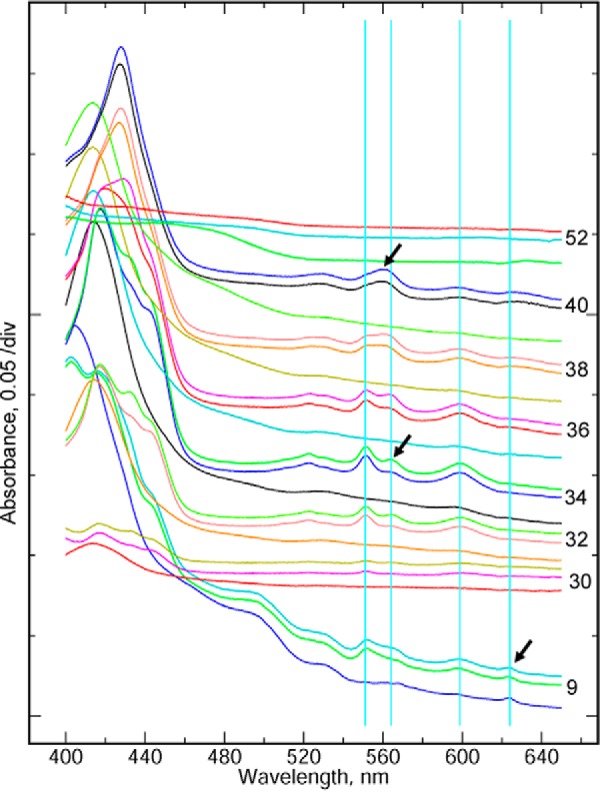
Fractionation of cytochromes in the detergent extract by ion exchange chromatography. Fractions from the column were analyzed by UV-visible spectroscopy. Three spectra are shown for each fraction: untreated and two consecutive scans after adding dithionite. Each triplet is labeled with the fraction number. For clarity, the spectra are offset by an arbitrary amount to order them from bottom to top while avoiding overlap in the range 480–650 nm. Light blue vertical lines indicate the wavelengths corresponding to absorbance peaks of the cytochrome cc (552 nm), cytochrome b (563 nm), and cytochrome aa3 (600 nm) of the supercomplex and cytochrome d (623 nm) of the cyt bd menaquinol oxidase.
More significantly, the flow-through fractions have a peak at 623 nm. This is presumed to be cytochrome d, although 628–630 nm is more typical for that cytochrome (24). If so, then the peaks at ∼600 and ∼560 nm probably contain contributions from cyt b595 and b558 of the cyt bd oxidase. Cyt d is not seen in any other fractions, implying that the bd oxidase does not adsorb to the DEAE-Sepharose under these conditions. The 623 nm peak is already visible before adding dithionite. A two subunit cytochrome bd menaquinol oxidase has been purified from Corynebacterium glutamicum (25). The flow-through also contained a yellow, organic-soluble pigment, perhaps a carotenoid, with peaks at 475 and 445 nm and perhaps a third peak around ∼420 nm, which is obscured in the native spectra by the Soret peaks of cytochromes.
In the fractions eluted by the salt gradient, the flat-topped peak in the region of cyt b and c α peaks that was seen in the membranes splits into two spectral signatures. The fractions eluting early in the gradient (Fig. 4, fractions 32, 34, and 36) have the typical bcc-aa3 spectrum with well separated α peaks for cyt b (562 nm) and cc (552 nm). Cyt b is reduced slowly (and incompletely on this time scale), as indicated by the further reduction of cyt b in the second scan after adding dithionite. Later fractions (fractions 38 and 40) show a cyt b557 filling the trough between the 552 and 562 peaks, resulting in a single maximum, dominating the α peak in fraction 40. Fluorescence scans of SDS gels (not shown) reveal a high molecular weight flavoprotein in these fractions, suggesting that b557 belongs to the superfamily of succinate:quinone oxidoreductases (26).
Ion exchange chromatography did not completely separate cyt b557 from the supercomplex, but this can be achieved by density gradient centrifugation. In order to obtain a good yield, all of the fractions, eluted by the gradient, that contained cyt aa3 (as seen by the −600 nm spectral peak) were pooled for the next step, including some that contained significant amounts of the cyt b557 and flavoprotein.
Density Gradient Centrifugation Separates Supercomplex from Cyt b557
Fig. 5 shows results from density gradient centrifugation. Photographs in Fig. 5a show a sharp colored band formed near the bottom of the tube, in what was originally the 60% glycerol layer. It is well separated from other cytochrome complexes due to its high molecular weight. This is not equilibrium centrifugation, and the supercomplex would eventually pellet if the run were long enough. However, the rate is greatly decreased upon entering the 60% glycerol, resulting in sharp focusing of the band, so the product can be recovered in a small volume. The perceived color depends on the illumination. When the relatively impure pooled fractions from the first ion exchange column were applied (tube A), the bulk of other cytochromes was well separated. Elution profile monitored by the Soret peak height (Fig. 5b) shows near-baseline separation between supercomplex peaking in fraction 7 and other cytochrome(s) peaking around 15. If the separation here is not good enough, a second density gradient centrifugation is performed as a final purification step.
FIGURE 5.
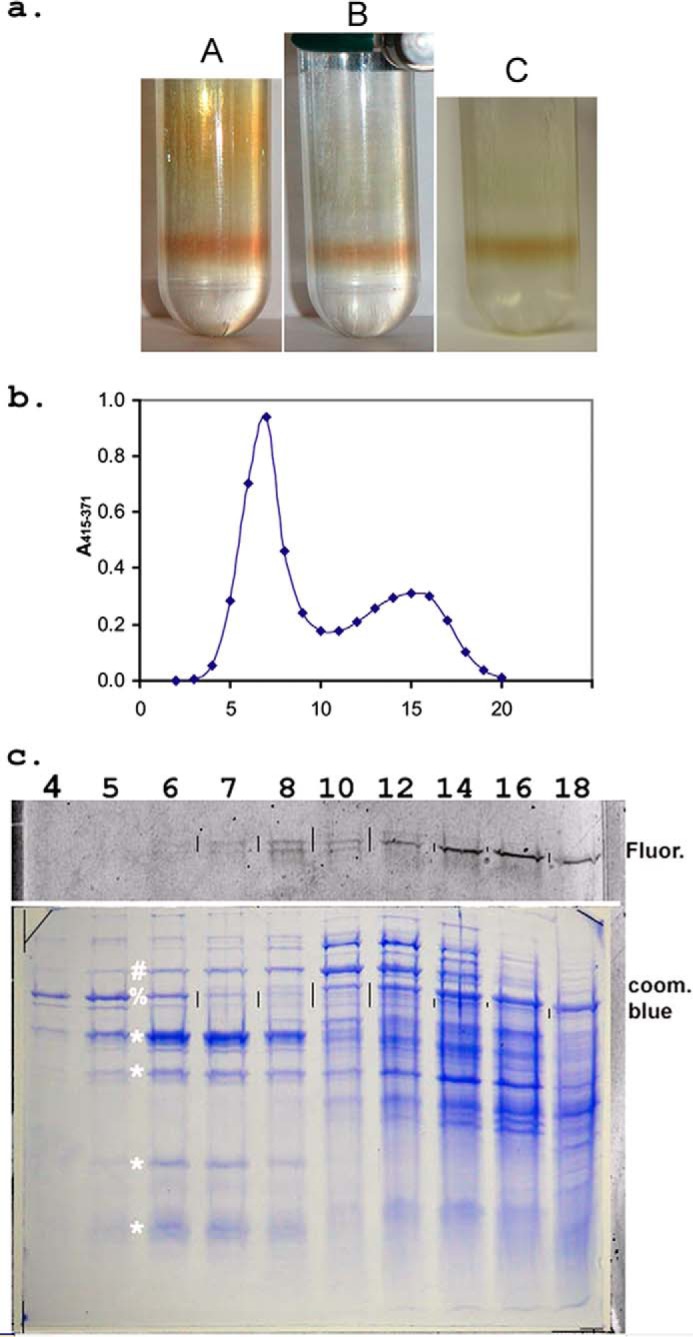
Density gradient purification of cyt bcc-aa3. Samples were separated by density gradient sedimentation as described under “Experimental Procedures.” a, supercomplex forms a sharp, visible band. In A, material from the initial ion exchange column was applied, demonstrating separation of slower moving colored contaminants. B and C both show the another sample with different illumination. In this case, the density gradient was applied as a final polishing step to nearly pure material. A and B are photographed with flash which gives a redder appearance, whereas C was photographed with fluorescent light and represents the greenish-brown appearance when viewed by eye under fluorescent lights. b, density gradient profile of cytochromes in pooled fractions from the initial DEAE-Sepharose column. The density gradient of Fig. 1A was fractionated by inserting a cannula to the bottom of the tube (from the top) and pumping to a fraction collector. The fraction collector was started at the same time as the pump, and fluid reached the fraction collector just before the start of fraction 2. The 20 fractions collected represent the bottom two-thirds of the gradient, with fraction 2 being the bottom. c, SDS-gel analysis of fractions from density gradient. The bottom panel shows the Coomassie-stained gel, and the strip above it is from a fluorescence scan of the gel. Cyt bcc-aa3 elutes primarily in fractions 6, 7, and 8. The four bands marked by asterisks are present in the purified complex, as is a sharp but weak band just below the largest of these. The putative identity of the bands will be provided later. The band indicated by # in lanes 6–8 may be the heme-staining subcomplex described later and/or overlap from a slower sedimenting band of the same gel mobility seen in fractions 10–14. The 65 kDa band (indicated by %) sediments faster than bcc-aa3 but overlaps somewhat. It can be cleanly separated by ion exchange in the next step. The vertical lines between some of the lanes serve to register the fluorescent scan with the Coomassie-stained gel and indicate the position of fluorescent proteins on the latter.
Fig. 5c shows SDS-gel analysis of the fractions from the density gradient, probed by Coomassie stain and flavin fluorescence. Four or five bands (Fig. 5c, *) sedimenting in parallel, which peak in fractions 6 and 7, will be seen later to be characteristic of the supercomplex. A band at about 65 kDa (Fig. 5c, %) that sediments faster (peaking in fraction 5) but overlaps with the supercomplex will be well separated by the Q-Sepharose column in the next step.
The top panel in Fig. 5c shows fluorescence in the range of succinate:quinone oxidoreductase flavoproteins. There appear to be at least three fluorescent proteins based on gel mobility. The uppermost faint band is only visible in fractions 10–12. The middle band has a weak peak in fraction 8, after the peak of supercomplex but overlapping, and then a strong peak in fraction 14, well after supercomplex. The lower band peaks in fraction 8, in parallel with the first peak of the middle band. Given the sensitivity of the fluorescence detection, the flavoprotein overlapping supercomplex is present in a relatively insignificant amount already at this stage and would not be visible in the Coomassie-stained gel. On the other hand, the strong fluorescent band in fractions 14 and 16 does seem to correspond to a faint band in the Coomassie-stained gel, as indicated by vertical black lines placed between the lanes at this level in both fluorescent and stained gels for alignment. Given that the second heme peak is also in fractions 14–16 (Fig. 5b), this fluorescent band may be the flavoprotein of the putative cytochrome b557/succinate:quinone oxidoreductase, which was overlapping with the supercomplex on the ion exchange column of Fig. 4. Expression and function of two SQOR protein complexes of M. smegmatis, denoted SDH1 and SDH2, have been investigated (27).
A Second Anion Exchange Chromatography on Q-Sepharose
Due to the relatively low ionic strength of the buffer used for the density gradient, pooled fractions can be bound to Q-Sepharose resin without further dilution. A 12-ml Q-Sepharose column was used, with the same washing and eluting buffer as for the first DEAE-Sepharose column, but with volumes of 30 ml for washing and 100 ml for the linear gradient. SDS-gel analysis of fractions around the supercomplex peak is shown in Fig. 6. Supercomplex elutes in fractions 24–27. As mentioned above, the 65 kDa band elutes well after the supercomplex, peaking in fraction 33. The main flavoprotein peak elutes after the supercomplex, but two weaker fluorescent bands elute around fraction 26, overlapping supercomplex. Again, given the sensitivity of the fluorescent detection, this represents a very slight contamination by these flavoproteins, barely detectable by Coomassie staining at the level of the vertical marks.
FIGURE 6.
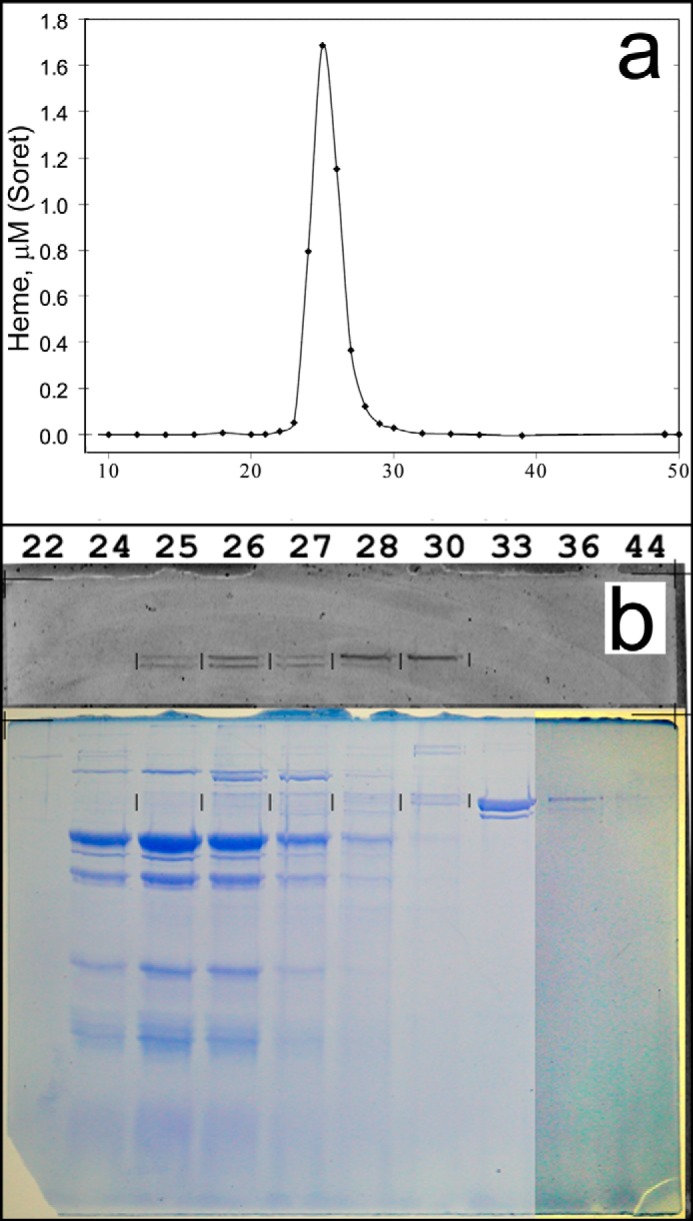
Further purification by anion exchange chromatography on Q-Sepharose. a, elution profile of heme measured by fitting the Soret peak to a 1 μm standard spectrum. b, SDS-PAGE analysis of fractions during gradient elution. The top portion shows the fluorescence scan, and fraction numbers are indicated at the top. Supercomplex elutes in fractions 24–27. Note that the 65 kDa band in fraction 33 is the material sedimenting faster than supercomplex in the density gradient (Fig. 4) and is well separated in this step. Contrast was enhanced for the Coomassie-stained gel in lanes 36 and 44 to show weak bands. Fraction size was 3 ml; the salt gradient eluted in approximately fractions 15–48.
Size Fractionation by Gel Filtration
Pooled fractions from the Q-Sepharose column were chromatographed on Sepharose CL-6B. Fig. 7 shows SDS gel analysis of fractions eluting near supercomplex. Fluorescence due to flavoprotein is barely detectable now, and the flavoprotein elutes slightly after, but still overlapping with the supercomplex. These bands are not detected by Coomassie staining. The Coomassie-stainable bands elute in constant proportion and presumably belong to the supercomplex, except for the highest, above the flavoprotein. This band appears together with the supercomplex and peaks in fractions 24 and 25, but continues to elute as late as fraction 32. The molecular weight is too high for any known subunits of the supercomplex, but as discussed below, an incompletely dissociated complex containing cytochrome cc is often seen near this molecular weight. This subcomplex may be responsible for that portion of the high molecular weight band in Fig. 7 peaking in fractions 24 and 25 with supercomplex, but in that case, an impurity of the same gel mobility must be overlapping in order to account for this band extending to fraction 32, where the other supercomplex bands are undetectable.
FIGURE 7.
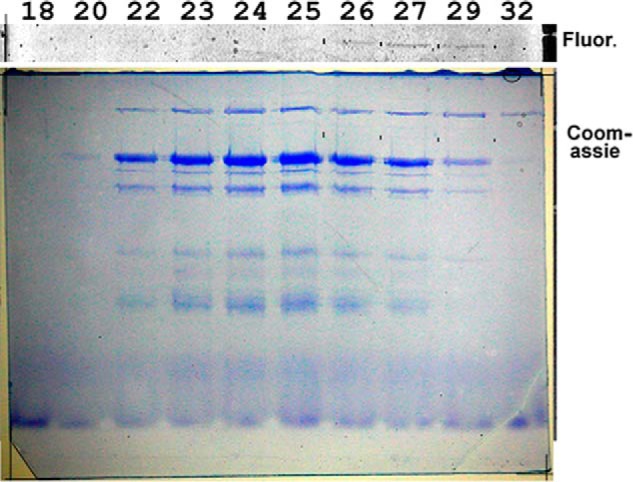
Sepharose CL-6B size exclusion chromatography. Samples from fractions across the elution peak were denatured and separated by SDS gel electrophoresis. The gel was first scanned for flavin fluorescence (top) and then stained with Coomassie Brilliant Blue R. Fine black marks between the lanes on both indicate the locations of fluorescent bands due to flavoprotein.
Summary of the Purification
Fig. 8 shows SDS-gel analysis of pooled fractions at each step of another preparation. The image in the left panel shows the Coomassie-stained gel. In this preparation, the density gradient was run as the last step in order to avoid overloading the gradients with the large amount of protein present initially. The strong band at 50 kDa due to the supercomplex becomes visible after the DEAE-Sepharose chromatography (lane 4) and is slightly enriched by Q-Sepharose and Sepharose 6B chromatography. Finally, a major purification is accomplished by the density gradient. The right panel shows the same gel stained for covalent heme, before Coomassie staining. In addition to the expected band at 26 kDa due to cyt cc, two high molecular mass bands of ∼100 and 115 kDa are stained.
FIGURE 8.

SDS-PAGE analysis at different stages of purification. Lane 1, molecular weight standards; lane 2, membranes; lane 3, detergent extract; lane 4, pooled fractions from DE-Sepharose column; lane 5, after Sepharose CL6b; lane 6, Q-Sepharose; lane 7, glycerol density gradient. Left, stained with Coomassie Brilliant Blue R for protein. Right, heme stain. Arrows on the right of both pictures indicate the positions of three heme-staining bands. The two high molecular weight heme-staining bands are not seen if the samples are heated near boiling to denature. The highest, present especially in the early stages of purification, copurifies with a high spin heme b protein seemingly not related to the supercomplex. The lower band copurifies with the supercomplex and is believed to represent an incompletely dissociated subcomplex containing cyt cc.
Neither of these heme-staining bands is apparent if the sample is heated to 95 °C in SDS denaturing buffer (not shown) before loading. The lower band is only seen in fractions containing supercomplex and probably represents a partially dissociated subcomplex containing cyt cc. The upper heme-staining band can be purified away from the supercomplex and is associated with heme B and a native spectrum consistent with a high spin heme. This band is about 120 kDa and coincides with a Coomassie-staining band that disappears on heat treatment as an ∼25 kDa band appears.
In these preparations, the detergent extract contained about 0.14 μmol of heme A, 0.35 μmol of heme B, and 0.08 μmol of heme C per g of starting protein. The value for heme C is not very accurate, because it is determined in the presence of a much greater amount of heme B, and the bands overlap. Still, there is significantly less heme C than heme A, and the two should be equal if all were present in fully assembled supercomplex containing heme A2B2C2 as determined below for the purified protein. (The amount of heme B is expected to be greater because other b cytochromes are present). Niebisch and Bott (15) have shown that in C. glutamicum, cytochrome aa3 is present in a mutant lacking the qcr operon. It may be that qcr is underexpressed in our transgenic strain, and excess oxidase accumulates as a result. A typical yield of purified supercomplex (monomer) was 9 nmol/g of starting protein, corresponding to ∼22% yield based on heme C or 13% based on heme A.
Characterization
Size of the Supercomplex
Table 1 summarizes putative subunit composition of actinobacterial bcc-aa3 complexes. Ten subunits were associated with the C. glutamicum supercomplex (16). Seven of these, including the largest six, are also present in the qcrCAB operon of M. tuberculosis and ctaC, -D, -E, and -F of M. smegmatis. It is likely that the other three are present in the genome, but low sequence conservation in these small “picket fence” subunits (28) makes it difficult to identify them by database searching alone.
TABLE 1.
Subunits of actinobacterial bcc-acc3 supercomplex
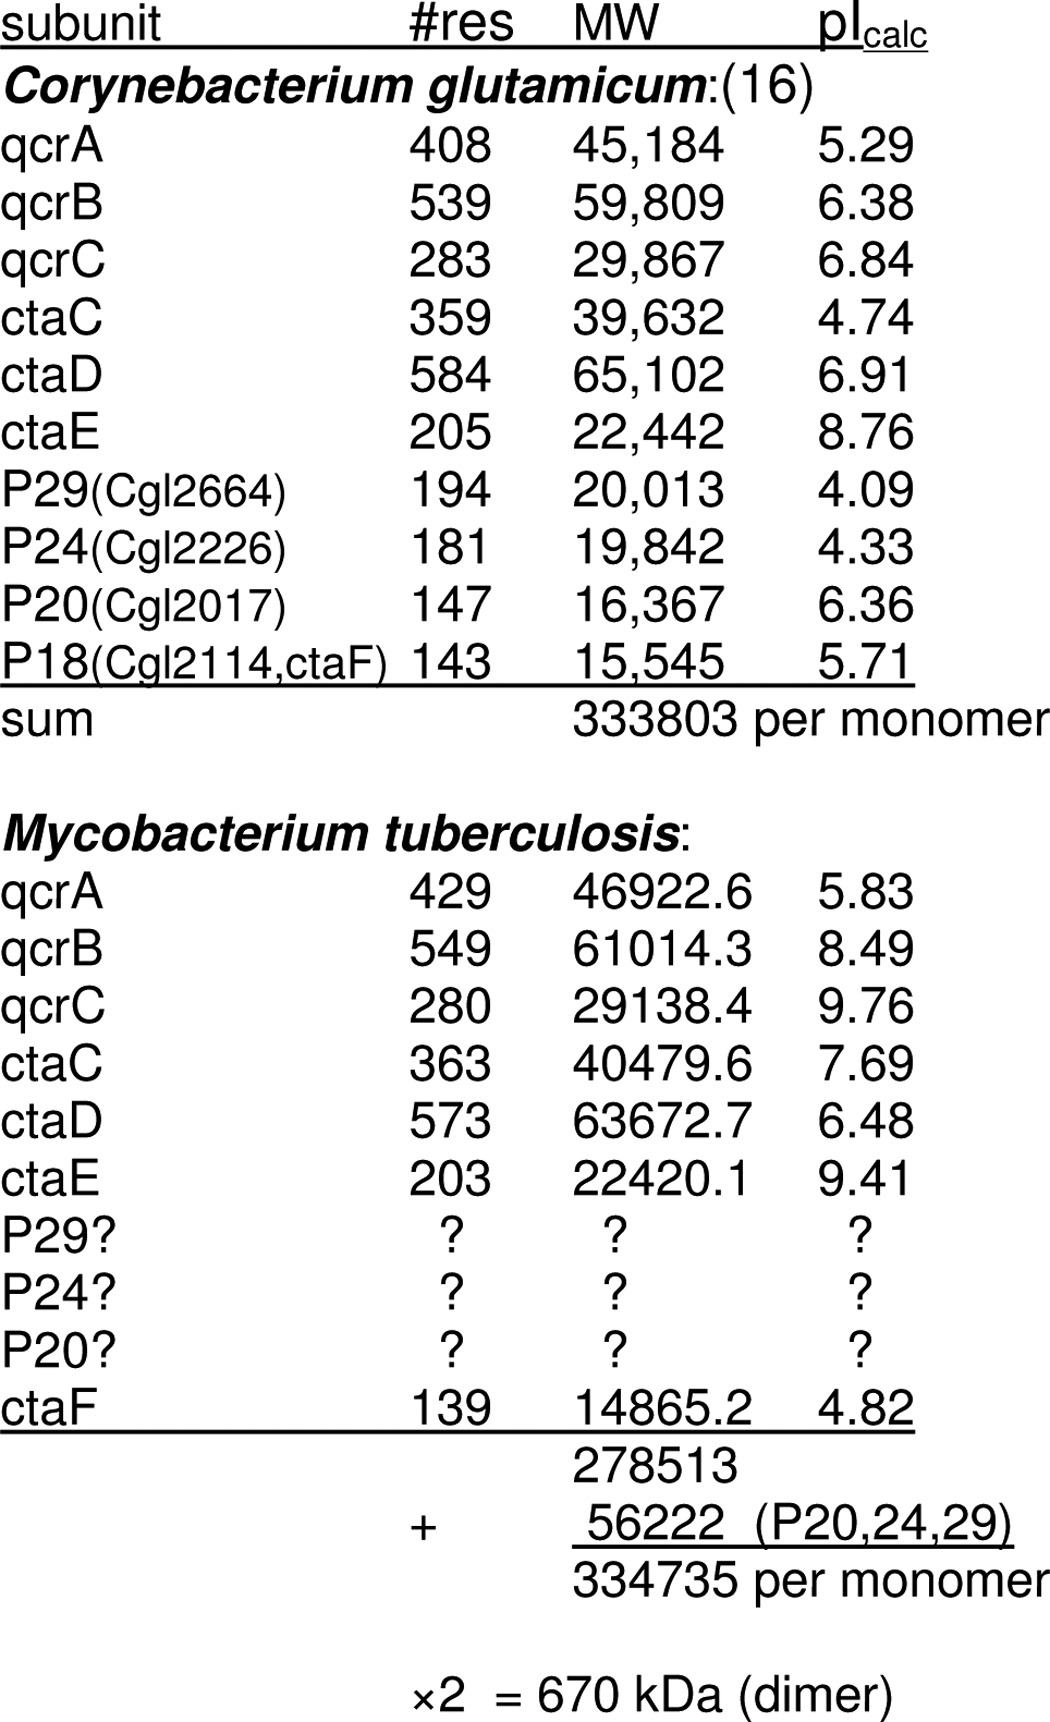
The sum of the molecular mass of the seven known polypeptides (M. tuberculosis qcrCAB and M. smegmatis ctaCDEF) is 279 kDa (Table 1). Assuming that the homologues of C. glutamicam subunits P29, P24, and P20 are present and have the same molecular weights in M. smegmatis, they would add 56 kDa for a 335-kDa complex containing one copy of each subunit. Considering that all known bc1 structures are obligatorily dimeric due to crossover of the iron-sulfur protein extrinsic and membrane domains (29), together with the 1:1:1 heme ratio (determined below), the most likely arrangement is two of each subunit, with a molecular mass of 670 kDa. One step of the purification involves chromatography on a 200-ml Sepharose CL-6B column, from which it elutes at 0.57 of the salt elution volume. The column was not calibrated, but bovine bc1 (480 kDa) elutes from this column at 0.63 of the salt volume, so the supercomplex is significantly larger, possibly 670 kDa.
Subunit Composition
Fig. 9 shows SDS-PAGE analysis of purified supercomplex denatured for 15 min at different temperatures and run on gels of different acrylamide concentration. The 26 kDa band indicated by a plus sign stains for covalent heme and so must be cyt cc. Samples denatured at room temperature or 50 °C and run on a 14% gel show a very strong band at 50 kDa with a weak band just below it, and a moderate band at 40 kDa. When denatured at 90 °C, intensity of the 50 kDa band is decreased to that of the 40 kDa band, and staining material near the top of the gel indicates that the missing protein has aggregated. This is characteristic of large hydrophobic proteins, such as cyt b (30, 31) and Cox1.
FIGURE 9.
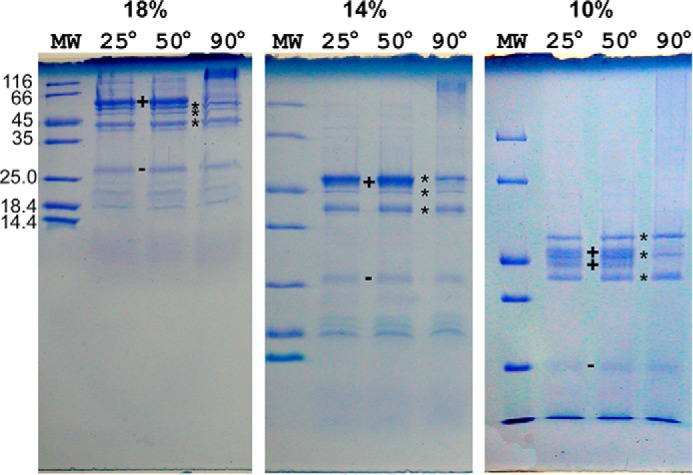
Dependence of PAGE banding pattern of cyt bcc-aa3 on denaturation temperature and gel concentration. The gels were made with different acrylamide concentrations (T+C) of 18, 15, and 10% (left to right). In each gel, the first lane is loaded with standards of the indicated molecular weight, and the other three are loaded with 13 pmol of cyt bcc-aa3 denatured for 15 min at room temperature, 50 °C, or 90 °C. Cyt b and perhaps Cox1 aggregate upon heating to 90 °C, leaving three sharp heat-stable bands (*) in the 45 kDa region. The band(s) that disappear on heating (+) have anomalous dependence on gel concentration, in that with changing gel concentration, their position changes relative to the heat-stable bands and molecular weight standards. Cytochrome cc (QcrC, 30 kDa) is identified by heme stain and labeled (−). Smaller subunits, visible in the 18 and 14% gels and failing to unstack in the 10% gel, may correspond to small proteins (P24, P20, and P18) identified in the Corynebacterium complex (16).
Even when denatured at a temperature that does not lead to aggregation, large hydrophobic proteins, such as cyt b (30, 31) and Cox1 (32), from various organisms migrate anomalously on SDS gels, as indicated by a Ferguson plot. To test this and to find conditions under which subunits separate clearly for isolation and sequence determination, we ran the same sample on gels of 18, 14, and 10% acrylamide (T+C).
The protein(s) that disappeared on heating (Fig. 9, +) run anomalously with respect to gel concentration. On the 18% gel, it is above the heat-stable 50 kDa band, whereas on the 10% gel, it has moved down to the level of the weak middle band and seems to be splitting into two bands. If these indeed represent cyt b (61,014 kDa) and Cox1 (63,672 kDa), the bands remaining after 90 °C treatment must be qcrA (45,184 Da, the iron-sulfur protein) and ctaC (39,632 Da, Cox2), in which case the weak band in the middle may be an unknown component or contaminant.
The small subunits are not clearly defined by the gels of Fig. 9, which were loaded to optimize visualizing the large subunits, but there appear to be multiple subunits in the 19–20 kDa range. These may include ctaE, ctaF, and other small subunits.
Mass spectroscopic analysis of tryptic digests of the gel bands positively identified the 40 kDa band as M. smegmatis Cox2 (CtaC) and the weak band between 40 and 50 kDa as M. tuberculosis QcrA, the Rieske protein. These were from material separated on SDS gel after heating to 93 °C for 15 min. As in Fig. 9, this resulted in diminishing and sharpening the band at 50 kDa, together with the appearance of aggregated protein near the top of the gel. The sharp 50 kDa band gave positive identification (confidence interval 100%) of both the Rieske protein and Cox1 (CtaD). No positive identification at the 0.05 confidence level was obtained for the material at the top of the gel, but the highest score was for M. smegmatis Cox1 protein (CtaD). Cytochrome b was not identified (among the top five hits) in any of the bands, although we know from the spectrum that it was present in the sample applied.
An explanation consistent with these identifications is that the 50 kDa band contains Cox1 and cyt b, as in Corynebacterium (16), but also part of the Rieske protein. The Rieske protein runs as a doublet, due to proteolysis, partial denaturation, or post-translational modification, giving the intermediate band. The lower (40 kDa) band is Cox2. Upon heating, cyt b aggregates, runs near the top of the gel, and resists proteolysis and ionization. A small amount of Cox1 also aggregates and is detected near the top but at an insignificant level.
Weak bands at ∼34 and ∼26 kDa were also analyzed. Neither led to significant identification; however, we know from heme staining that the 26 kDa band is cyt cc (29,138 Da). Together with the spectral properties and the molecular mass from size exclusion (a little greater than 480 kDa), there can be little doubt that the product obtained is a supercomplex of cyt bcc and cytochrome aa3.
Spectral Characteristics, Heme Content, and Extinction Coefficients
One of purest fractions from a final glycerol density gradient was used to acquire standard spectra and subsequently denatured in alkaline pyridine solution to determine heme by the pyridine hemochrome method.
The native spectra of the untreated and dithionite-reduced supercomplex are shown in Fig. 10a. The oxidized form has maxima at 274.5, 414.5, and 529 nm, with minima at 312 and 371 nm. The ratio of the protein peak to Soret peak in the oxidized enzyme (A274/A414) was 1.50. The dithionite-reduced form has absorption maxima at 417 and 432.5 nm in the Soret region and 552.5, 564, and 599 nm for the α peaks. Notably, the peak position at 599 nm is significantly different from the peak for reduced bovine cytochrome oxidase around 605 nm. The peak at 417 nm suggests that the cytochrome is incompletely reduced, although this spectrum was acquired 33 min after adding dithionite.
FIGURE 10.

Spectral properties of purified cytochrome bcc-aa3. a, native spectra before (blue and cyan) and after (green and red) reduction with dithionite. Cytochrome bcc-aa3 was 25 μm, in 20 mm KMOPS 7.4, 100 mm NaCl, 0.5 mm EDTA, and 0.1 g/liter DDM. The expanded cyan and red traces are multiplied by 4. Spectra were taken with a Shimadzu UV-2450, bandpass 2 nm, scan speed fast. For b and c, another sample of cytochrome bcc-aa3 was first reduced with 0.17 mm ascorbate + 1.7 mm KCN and then with dithionite. Spectra were obtained at intervals. b (from bottom to top), change on adding ascorbate +KCN (brown), further immediate change on adding dithionite (magenta), and slow change after adding dithionite (red). Vertical lines, positions of the α peaks in the middle spectrum. In c, the first spectrum after dithionite (gray horizontal line) was subtracted from all to obtain intermediate steps during the slow reduction of cytochrome b in the subsequent (green, cyan, and red) spectra. d, cytochrome bcc-aa3 contains hemes A, B, and C in a 2:2:2 ratio. After recording the spectra of a with sodium dithionite added, an equal volume of 40% pyridine, 0.2 m NaOH (also treated with a small amount of dithionite) was added. The cuvette was stoppered and mixed well by repeated inversion. The dark blue spectrum was recorded from this mixture. The green spectrum is the best fit to this using the three absolute reduced pyridine hemochrome spectra and a linear baseline. The cyan, red, and magenta spectra indicate the amount of each used, respectively (0.253 μm heme C, 0.241 μm heme B, and 0.250 μm heme A), and brown is the baseline. The concentration based on a monomer containing two of each type of heme is obtained by dividing the sum of these by six. The value of 0.248 used for normalizing the spectra of a to obtain extinction coefficients was obtained by correcting this for the 2-fold dilution upon adding alkaline pyridine solution.
Fig. 10b shows difference spectra obtained on treating another preparation with ascorbate/KCN and then dithionite. Cytochrome cc is incompletely reduced by ascorbate, which could be due to a low potential for one of the hemes or to failure of the cytochrome to reach equilibrium with ascorbate due to slow oxidation by a cyanide-insensitive pathway. The remaining c-type cytochrome is completely reduced, along with part of the b cytochrome, in the first spectrum after adding dithionite. The remainder is reduced slowly over the next 30 min, giving the difference spectrum in the upper trace.
Spectra recorded during that interval are shown in Fig. 10c, with the first spectrum after adding dithionite subtracted to show the slowly reduced component. This has an α peak at ∼564 nm and isosbestic points at 425, 452, 528, 540, 555, and 570 nm, suggesting that a single cytochrome is involved.
The spectrum in alkaline pyridine is shown in Fig. 10d, together with its decomposition into a linear combination of the three standard pyridine hemochromogen spectra. The least squares best fit was obtained with spectra corresponding to a ∼0.24 μm concentration of each of the three hemes. Equivalence of heme B and heme C is expected because the bcc complex contains two of each, and the near equivalence of heme A indicates that there is one oxidase per bcc complex rather than a single oxidase servicing both monomers of the dimeric bcc complex. Thus, we can express concentration of the supercomplex in terms of a monomer containing two of each type of heme. The concentration of the monomer in the alkaline pyridine solution of Fig. 10d is then 0.12 μm, and in Fig. 10a, before dilution with pyridine, it is 0.24 μm. This has been used to normalize the spectrum in Fig. 10a to obtain single and dual wavelength extinction coefficients for the supercomplex in the oxidized state. The extinction coefficient at the Soret peak (413 nm) was 726 mm−1, and the difference extinction coefficient at 413–371 nm was 485 mm−1.
Although extinction coefficients for the dithionite-treated enzyme could also be calculated, they would not be very meaningful in light of the incomplete and variable reduction of the cytochrome b obtained with dithionite. An exception would be the 599 nm peak due to oxidase, which should be minimally affected by a small amount of oxidized cyt b remaining. The extinction coefficient of the reduced form at 599–650 nm was 48. Accurate concentrations could be obtained from spectra of the reduced form by fitting the experimental spectrum with the absolute reduced spectrum (Fig. 10a) together with a difference spectrum for the slowly reducible cytochrome b (Fig. 10c).
To approximate the heme content on a protein basis, a sample of the pooled fractions from the same preparation was used for native oxidized spectrum and protein determination by the Lowry method. The ratio A280/A415 for this sample as 1.45, and A415 − A371 was 0.531, indicating a concentration of 1.11 μm. The protein concentration was 0.56 g/liter, giving an effective monomeric molecular mass of 478 kDa. The concentration dependence of the Lowry response did not match the BSA calibration curve very well. It is well known that proteins vary significantly in their response to the Lowry reaction, so this is not inconsistent with the molecular weight suggested by size exclusion chromatography or the sum of molecular weights of the subunits (Table 1).
Conclusions
The hybrid supercomplex of M. tuberculosis cyt bcc and M. smegmatis cyt aa3 is stable during extraction and purification in the presence of dodecyl maltoside detergent. It is hoped that this purification procedure will potentiate functional studies of the complex as well as crystallographic studies of drug binding and thus contribute to the global fight against tuberculosis.
Acknowledgments
We acknowledge the mass spectrometry core facility of the Nanyang Technological University for protein identification by MALDI-TOF/TOF. We thank Valerie Mizrahi and Bavesh Kana for the generous gift of M. smegmatis ΔqcrCAB.
Footnotes
- IP
- imidazo[1,2-a]pyridine
- DDM
- n-dodecyl β-d-maltoside
- cyt
- cytochrome
- SUIV
- subunit 4 of photosynthetic b6f complex
- TMH
- transmembrane helix.
References
- 1. Lechartier B., Rybniker J., Zumla A., Cole S. T. (2014) Tuberculosis drug discovery in the post-post-genomic era. EMBO Mol. Med. 6, 158–168 [DOI] [PMC free article] [PubMed] [Google Scholar]
- 2. Rao S. P., Alonso S., Rand L., Dick T., Pethe K. (2008) The protonmotive force is required for maintaining ATP homeostasis and viability of hypoxic, nonreplicating Mycobacterium tuberculosis. Proc. Natl. Acad. Sci. U.S.A. 105, 11945–11950 [DOI] [PMC free article] [PubMed] [Google Scholar]
- 3. Berney M., Cook G. M. (2010) Unique flexibility in energy metabolism allows mycobacteria to combat starvation and hypoxia. PLoS One 5, e8614. [DOI] [PMC free article] [PubMed] [Google Scholar]
- 4. Mak P. A., Rao S. P., Ping Tan M., Lin X., Chyba J., Tay J., Ng S. H., Tan B. H., Cherian J., Duraiswamy J., Bifani P., Lim V., Lee B. H., Ling Ma N., Beer D., Thayalan P., Kuhen K., Chatterjee A., Supek F., Glynne R., Zheng J., Boshoff H. I., Barry C. E., 3rd, Dick T., Pethe K., Camacho L. R. (2012) A high-throughput screen to identify inhibitors of ATP homeostasis in non-replicating Mycobacterium tuberculosis. ACS Chem. Biol. 7, 1190–1197 [DOI] [PMC free article] [PubMed] [Google Scholar]
- 5. Berney M., Cook G. M. (2014) in Advances in Photosynthesis and Respiration (Hohmann-Marriott M. F., ed) pp. 277–293, Springer Science + Business Media, Dordrecht, The Netherlands [Google Scholar]
- 6. Kakkar A. K., Dahiya N. (2014) Bedaquiline for the treatment of resistant tuberculosis: promises and pitfalls. Tuberculosis 94, 357–362 [DOI] [PubMed] [Google Scholar]
- 7. Moraski G. C., Markley L. D., Hipskind P. A., Boshoff H., Cho S., Franzblau S. G., Miller M. J. (2011) Advent of imidazo[1,2-a]pyridine-3-carboxamides with potent multi- and extended drug resistant antituberculosis activity. ACS Med. Chem. Lett. 2, 466–470 [DOI] [PMC free article] [PubMed] [Google Scholar]
- 8. Abrahams K. A., Cox J. A., Spivey V. L., Loman N. J., Pallen M. J., Constantinidou C., Fernández R., Alemparte C., Remuiñán M. J., Barros D., Ballell L., Besra G. S. (2012) Identification of novel imidazo[1,2-a]pyridine inhibitors targeting M. tuberculosis QcrB. PLoS One 7, e52951. [DOI] [PMC free article] [PubMed] [Google Scholar]
- 9. Pethe K., Bifani P., Jang J., Kang S., Park S., Ahn S., Jiricek J., Jung J., Jeon H. K., Cechetto J., Christophe T., Lee H., Kempf M., Jackson M., Lenaerts A. J., Pham H., Jones V., Seo M. J., Kim Y. M., Seo M., Seo J. J., Park D., Ko Y., Choi I., Kim R., Kim S. Y., Lim S., Yim S. A., Nam J., Kang H., Kwon H., Oh C. T., Cho Y., Jang Y., Kim J., Chua A., Tan B. H., Nanjundappa M. B., Rao S. P., Barnes W. S., Wintjens R., Walker J. R., Alonso S., Lee S., Oh S., Oh T., Nehrbass U., Han S. J., No Z., Lee J., Brodin P., Cho S. N., Nam K. (2013) Discovery of Q203, a potent clinical candidate for the treatment of tuberculosis. Nat. Med. 19, 1157–1160 [DOI] [PubMed] [Google Scholar]
- 10. Arora K., Ochoa-Montaño B., Tsang P. S., Blundell T. L., Dawes S. S., Mizrahi V., Bayliss T., Mackenzie C. J., Cleghorn L. A., Ray P. C., Wyatt P. G., Uh E., Lee J., Barry C. E., 3rd, Boshoff H. I. (2014) Respiratory flexibility in response to inhibition of cytochrome C oxidase in Mycobacterium tuberculosis. Antimicrob. Agents Chemother. 58, 6962–6965 [DOI] [PMC free article] [PubMed] [Google Scholar]
- 11. Sone N., Nagata K., Kojima H., Tajima J., Kodera Y., Kanamaru T., Noguchi S., Sakamoto J. (2001) A novel hydrophobic diheme c-type cytochrome. Purification from Corynebacterium glutamicum and analysis of the QcrCBA operon encoding three subunit proteins of a putative cytochrome reductase complex. Biochim. Biophys. Acta 1503, 279–290 [DOI] [PubMed] [Google Scholar]
- 12. Cheng Y., Moraski G. C., Cramer J., Miller M. J., Schorey J. S. (2014) Bactericidal activity of an imidazo[1,2-a]pyridine using a mouse M. tuberculosis infection model. PLoS One 9, e87483. [DOI] [PMC free article] [PubMed] [Google Scholar]
- 13. Berry E. A., Guergova-Kuras M., Huang L. S., Crofts A. R. (2000) Structure and function of cytochrome bc complexes. Annu. Rev. Biochem. 69, 1005–1075 [DOI] [PubMed] [Google Scholar]
- 14. Sone N., Tsuchiya N., Inoue M., Noguchi S. (1996) Bacillus stearothermophilus qcr operon encoding Rieske FeS protein, cytochrome b6, and a novel-type cytochrome c1 of quinol-cytochrome c reductase. J. Biol. Chem. 271, 12457–12462 [DOI] [PubMed] [Google Scholar]
- 15. Niebisch A., Bott M. (2001) Molecular analysis of the cytochrome bc1-aa3 branch of the Corynebacterium glutamicum respiratory chain containing an unusual diheme cytochrome c1. Arch. Microbiol. 175, 282–294 [DOI] [PubMed] [Google Scholar]
- 16. Niebisch A., Bott M. (2003) Purification of a cytochrome bc-aa3 supercomplex with quinol oxidase activity from Corynebacterium glutamicum: identification of a fourth subunit of cytochrome aa3 oxidase and mutational analysis of diheme cytochrome c1. J. Biol. Chem. 278, 4339–4346 [DOI] [PubMed] [Google Scholar]
- 17. Megehee J. A., Hosler J. P., Lundrigan M. D. (2006) Evidence for a cytochrome bcc-aa3 interaction in the respiratory chain of Mycobacterium smegmatis. Microbiology 152, 823–829 [DOI] [PubMed] [Google Scholar]
- 18. Sassetti C. M., Boyd D. H., Rubin E. J. (2003) Genes required for mycobacterial growth defined by high density mutagenesis. Mol. Microbiol. 48, 77–84 [DOI] [PubMed] [Google Scholar]
- 19. Griffin J. E., Gawronski J. D., Dejesus M. A., Ioerger T. R., Akerley B. J., Sassetti C. M. (2011) High-resolution phenotypic profiling defines genes essential for mycobacterial growth and cholesterol catabolism. PLoS Pathog. 7, e1002251. [DOI] [PMC free article] [PubMed] [Google Scholar]
- 20. Matsoso L. G., Kana B. D., Crellin P. K., Lea-Smith D. J., Pelosi A., Powell D., Dawes S. S., Rubin H., Coppel R. L., Mizrahi V. (2005) Function of the cytochrome bc1-aa3 branch of the respiratory network in mycobacteria and network adaptation occurring in response to its disruption. J. Bacteriol. 187, 6300–6308 [DOI] [PMC free article] [PubMed] [Google Scholar]
- 21. Hao H. X., Khalimonchuk O., Schraders M., Dephoure N., Bayley J. P., Kunst H., Devilee P., Cremers C. W., Schiffman J. D., Bentz B. G., Gygi S. P., Winge D. R., Kremer H., Rutter J. (2009) SDH5, a gene required for flavination of succinate dehydrogenase, is mutated in paraganglioma. Science 325, 1139–1142 [DOI] [PMC free article] [PubMed] [Google Scholar]
- 22. Thomas P. E., Ryan D., Levin W. (1976) An improved staining procedure for the detection of the peroxidase activity of cytochrome P-450 on sodium dodecyl sulfate polyacrylamide gels. Anal. Biochem. 75, 168–176 [DOI] [PubMed] [Google Scholar]
- 23. Berry E. A., Trumpower B. L. (1987) Simultaneous determination of hemes a, b, and c from pyridine hemochrome spectra. Anal. Biochem. 161, 1–15 [DOI] [PubMed] [Google Scholar]
- 24. Borisov V. B., Gennis R. B., Hemp J., Verkhovsky M. I. (2011) The cytochrome bd respiratory oxygen reductases. Biochim. Biophys. Acta 1807, 1398–1413 [DOI] [PMC free article] [PubMed] [Google Scholar]
- 25. Kusumoto K., Sakiyama M., Sakamoto J., Noguchi S., Sone N. (2000) Menaquinol oxidase activity and primary structure of cytochrome bd from the amino-acid fermenting bacterium Corynebacterium glutamicum. Arch. Microbiol. 173, 390–397 [DOI] [PubMed] [Google Scholar]
- 26. Hägerhäll C. (1997) Succinate: quinone oxidoreductases: variations on a conserved theme. Biochim. Biophys. Acta 1320, 107–141 [DOI] [PubMed] [Google Scholar]
- 27. Pecsi I., Hards K., Ekanayaka N., Berney M., Hartman T., Jacobs W. R., Jr., Cook G. M. (2014) Essentiality of succinate dehydrogenase in Mycobacterium smegmatis and its role in the generation of the membrane potential under hypoxia. mBio 5, 01093-14 [DOI] [PMC free article] [PubMed] [Google Scholar]
- 28. Hasan S. S., Yamashita E., Ryan C. M., Whitelegge J. P., Cramer W. A. (2011) Conservation of lipid functions in cytochrome bc complexes. J. Mol. Biol. 414, 145–162 [DOI] [PMC free article] [PubMed] [Google Scholar]
- 29. Zhang Z., Huang L., Shulmeister V. M., Chi Y. I., Kim K. K., Hung L. W., Crofts A. R., Berry E. A., Kim S. H. (1998) Electron transfer by domain movement in cytochrome bc1. Nature 392, 677–684 [DOI] [PubMed] [Google Scholar]
- 30. Marres C. M., Slater E. C. (1977) Polypeptide composition of purified QH2:cytochrome c oxidoreductase from beef-heart mitochondria. Biochim. Biophys. Acta 462, 531–548 [DOI] [PubMed] [Google Scholar]
- 31. Horváth A., Berry E. A., Maslov D. A. (2000) Translation of the edited mRNA for cytochrome b in trypanosome mitochondria. Science 287, 1639–1640 [DOI] [PubMed] [Google Scholar]
- 32. Yamanaka T., Kamita Y., Fukumori Y. (1981) Molecular and enzymatic properties of “cytochrome aa3”-type terminal oxidase derived from Nitrobacter agilis. J. Biochem. 89, 265–273 [DOI] [PubMed] [Google Scholar]