

Background: GLUT4 is a promising target for multiple myeloma therapy.
Results: In silico modeling of GLUT4, followed by virtual screening and validation, led to the identification of GLUT4-selective inhibitors.
Conclusion: Despite significant homology between GLUT1 and GLUT4, we have identified GLUT4-selective inhibitors exhibiting cytotoxicity in myeloma.
Significance: Potent selective GLUT4 inhibitors are promising cancer therapeutics with both cytostatic and chemosensitizing properties warranting further development.
Keywords: cancer, glucose transport, glucose transporter type 4 (GLUT4), multiple myeloma, Warburg effect
Abstract
Tumor cells rely on elevated glucose consumption and metabolism for survival and proliferation. Glucose transporters mediating glucose entry are key proximal rate-limiting checkpoints. Unlike GLUT1 that is highly expressed in cancer and more ubiquitously expressed in normal tissues, GLUT4 exhibits more limited normal expression profiles. We have previously determined that insulin-responsive GLUT4 is constitutively localized on the plasma membrane of myeloma cells. Consequently, suppression of GLUT4 or inhibition of glucose transport with the HIV protease inhibitor ritonavir elicited growth arrest and/or apoptosis in multiple myeloma. GLUT4 inhibition also caused sensitization to metformin in multiple myeloma and chronic lymphocytic leukemia and a number of solid tumors suggesting the broader therapeutic utility of targeting GLUT4. This study sought to identify selective inhibitors of GLUT4 to develop a more potent cancer chemotherapeutic with fewer potential off-target effects. Recently, the crystal structure of GLUT1 in an inward open conformation was reported. Although this is an important achievement, a full understanding of the structural biology of facilitative glucose transport remains elusive. To date, there is no three-dimensional structure for GLUT4. We have generated a homology model for GLUT4 that we utilized to screen for drug-like compounds from a library of 18 million compounds. Despite 68% homology between GLUT1 and GLUT4, our virtual screen identified two potent compounds that were shown to target GLUT4 preferentially over GLUT1 and block glucose transport. Our results strongly bolster the utility of developing GLUT4-selective inhibitors as anti-cancer therapeutics.
Introduction
It is now well established that tumor cells consume more glucose than their normal counterparts to maintain survival and proliferation. This phenomenon has been capitalized upon for the diagnostic and prognostic monitoring of a number of cancers, including multiple myeloma (MM),2 by using fluoro-2-deoxyglucose positron emission tomography (1–4). However, elevated glucose utilization has not successfully been targeted for cancer therapy. Evaluation of glucose entry into tumor cells demonstrates glucose uptake to be a key rate-limiting step in glucose metabolism suggesting the utility of targeting glucose transport for therapy (5). A number of cancers demonstrate up-regulation of GLUT1 (6), and GLUT1 inhibitors with therapeutic efficacy in renal cell carcinoma have been identified (7). The facilitative transport of glucose into normal B cells is primarily thought to be mediated by GLUT1, -3, and -4 (8, 9). Our investigation of MM, a malignancy of differentiated B cells, importantly demonstrated reliance on GLUT4, not GLUT1, for maintenance of survival and proliferation (10). MM cell lines and patient samples demonstrate reduced levels of GLUT3 in comparison with normal plasma cells, indicating that GLUT3 does not play a significant role in MM glucose transport (10). GLUT4, which is normally sequestered intracellularly in the basal state in insulin-responsive tissues, was found to be constitutively localized at the plasma membrane in MM cells, thereby facilitating glucose entry (10). Suppression of GLUT4 expression leads to growth inhibition and/or cytotoxicity in MM cells (10).
Given the potential utility of targeting GLUT4 for myeloma therapy, we tested the HIV protease inhibitor ritonavir that noncompetitively inhibits glucose transport through GLUT4 (11). We found ritonavir to inhibit glucose transport and exhibit growth inhibitory effects on MM cells and to importantly synergize with a number of therapeutics, including metformin as reported previously (12, 13). However, ritonavir was not as effective in eliciting cytotoxicity as that obtained upon suppression of GLUT4 expression (10), and also it demonstrates inhibitory activity against GLUT1. We therefore sought to identify compounds with increased potency and selectivity as GLUT4 inhibitors.
GLUT4 is a 12-transmembrane, 509-amino acid protein containing a large cytoplasmic loop between transmembrane (TM) helices 6 and 7 (14, 15). Both the N and C termini are cytoplasmic, and these two regions along with loops possess transporter-specific signature sequences involved in spatial regulation and the substrate specificity of GLUT4 (16). So far, 14 members have been described that are grouped into three classes based on sequence similarities. Sugar transport is thought to be mediated through an alternating transport mechanism whereby the transporter undergoes a conformational change once bound to glucose on the exofacial face to release glucose within the cell (17, 18). Inhibitors of glucose transport can competitively or noncompetitively inhibit transport by interacting with specific regions within the substrate binding domain on either the exofacial or endofacial domains. Efforts to develop HIV protease inhibitors devoid of GLUT4 affinity have demonstrated that the modified tripeptide oxybenzylcarbonyl-His-Phe-Phe-O-ethyl ester (Ki 26 μm) mimics the core structure of ritonavir and is sufficient to selectively inhibit GLUT4 (19). Our objective was to utilize knowledge of this structure-activity relationship to generate a more potent, noncompetitive, and reversible GLUT4 inhibitor.
Human GLUT1 and -4 share 68.7% amino acid identity as computed using the Biopolymer module of Tripos (20). To identify novel isoform-specific inhibitors of GLUT4, we generated an in silico homology model for this transporter isoform. This model was used to screen a drug-like small molecule library. Two compounds were identified that demonstrated selectivity for GLUT4 over GLUT1 and cytotoxicity in multiple myeloma cell lines. This approach provides the conceptual framework for the structural modeling and identification of other GLUT inhibitors with relevance for the development of novel disease therapeutics.
Experimental Procedures
Cell Culture
The JJN3, KMS11, and L363 cell lines were obtained from Dr. M. Kuehl (NCI, National Institutes of Health). KMS11-GFP- and -GLUT1-expressing cells were generated as described previously (10). All cells were cultured in RPMI 1640 medium (Invitrogen) supplemented with 10% fetal bovine serum (FBS), 100 units/ml penicillin, 100 mg/ml streptomycin, 2.5 μg/ml fungizone, and 0.5 μg/ml plasmocin (InvivoGen, San Diego) and maintained in a 37 °C incubator with 5% CO2.
Chemicals and Reagents
Ritonavir was purchased from Euroasia Inc. All other compounds used in screening were purchased from ChemBridge Corp., San Diego. Antibodies were obtained from the following sources: GLUT1 (Abcam), GLUT4 (Dr. P. Hruz), and GAPDH antibody (Chemicon, Temecula, CA).
Cell Proliferation Assays and Viability Assays
MTS Cell Titer Aqueous assay (Promega, Madison, WI) was used to determine cell growth. Cells, 5000 per well in RPMI 1640 medium containing 5 mm glucose and 2 mm glutamine, were cultured in 384-well plates, and an Echo 550 (Labcyte) was used to dispense the compounds. Absorbance at 490 nm (measured using a Biotek Synergy 4 multimode plate reader) is proportional to the number of live cells. IC50 studies were performed using the Cell Titer Glo assay (Promega). Briefly 20,000 cells were plated per well in 96-well plates, with a concentration range of individual compounds. Cell number was assessed after 72 h of incubation. For viability assessment, subsequent to specific drug treatments, cells were washed in PBS and stained with AnnexinV-FITC/APC according to the manufacturer's instructions (BD Biosciences). Samples were run on a BDFacsCantoTM II cell analyzer (BD Biosciences). Data analysis was performed with the FCS express version 3 (De Novo software, Los Angeles).
Myeloma Patient Sample Processing
Bone marrow aspirates or peripheral blood samples from consenting myeloma patients were diluted to 25 ml with 1× PBS and underlaid with lymphocyte separation media (Corning Glass). Following centrifugation, the buffy coat was collected, and the cells were washed with PBS, resuspended in culture medium, and stained with anti-CD38-phyocerythrin, anti-CD45-allophycocyanin-Cy7, and anti-CD138-fluorescein isothiocyanate antibodies (BD Biosciences) for analysis by fluorescence-activated cell sorter (Canto II, BD Biosciences). All samples were collected following an Emory University Institutional Review Board-approved protocol.
Photolabeling of Low Density Microsomes
3T3-L1 fibroblasts were differentiated into adipocytes as described previously (21). LDMs were obtained from fully differentiated adipocytes as reported previously (22). Inhibitors were added to LDM (200–400 μg) for 10 min at room temperature. Samples (final volume 110 μl) N-[2-[2-((N-biotinylcaproylamino)ethoxy)ethoxyl]-4-[2-(trifluoromethyl)-3H-diazirin-3-yl-[benzoyl]-1,3-bis(mannopyranosyl-4-yloxy)]-2-propylamine were then incubated for 10 min at room temperature with biotinylated ATB-BMPA (50 μm final concentration) and then placed on ice prior to UV irradiation. Reactions were transferred to a 24-well low protein retention culture dish (Costar, Corning, NY) and then irradiated at room temperature 5 cm from a Green Spot UV lamp for 1 min (30 s of light, followed by 30 s of darkness, followed by 30 s of light).
Isolation and Quantification of Labeled GLUT1 and GLUT4 Proteins from the LDM of 3T3-L1 Adipocytes
Photolabeling of GLUT1 and -4 in 3T3-L1 adipocytes was performed as described previously (23). Briefly, 20 μl of bovine serum albumin (1.5 mg/ml final concentration) was added to the UV-irradiated samples in a siliconized Eppendorf tube. Excess biotinylated ATB-BMPA label was removed using a 0.5-ml Zeba Spin Desalting Column (Pierce). Membranes were solubilized for 30 min at 4 °C with 2% Thesit detergent in 25 mm phosphate and 100 mm NaCl, pH 7.4, buffer containing protease inhibitors followed by the removal of insoluble material by centrifugation at 16,000 × g for 10 min. Biotinylated proteins were isolated from the Thesit-solubilized LDM using 50 μl of high capacity streptavidin-agarose resin (Pierce). Proteins were eluted from the washed resin with 2× Laemmli Sample Buffer. To remove the biotinylated proteins from the streptavidin resin, Laemmli buffer samples were heated at 95 °C for 20 min. Eluted proteins were analyzed by immunoblot analysis using GLUT1- and GLUT4-specific antibodies and quantified using an Odyssey Infrared Imaging System (LI-COR Biosciences, Lincoln, NE).
Expression of mycGLUT Transporters in HEK293 Cells
A Myc tag sequence (AEEQKLISEEDLLK) was incorporated into the first exofacial domain of both rat GLUT1 (after Ile-56) and rat GLUT4 (after Pro-60), and a 6-histidine sequence was inserted at the extreme C terminus of both transporters using a polymerase chain reaction (PCR)-based gene assembly approach as described previously (23). QuikChange II XL site-directed mutagenesis kit (Agilent Technologies) was used to generate mycGLUT4 P401L. mycGlut4, mycGlut1, and mycGLUT4 P401L mutants were subcloned into the ΔU3nlsLacZ retroviral mammalian expression vector (24) and transfected into HEK293 cells as reported previously (23).
2-Deoxyglucose Uptake Measurements in HEK293, KMS11, and JJN3 Cells
HEK293 cells overexpressing Myc-tagged GLUT1 or GLUT4 were grown to confluency in DMEM. To adhere the KMS11 and JJN3 cells to tissue culture plates, dishes were first pretreated with 25 μg/ml polyethyleneimine (Fluka, catalogue number P3143) in 150 mm NaCl for 20 min followed by the removal of the solution by vacuum. Cells were subsequently plated and grown to confluency in RPMI 1640 medium. All media were supplemented with 10% FBS, 2 mm glutamine, 100 units/ml penicillin, and 100 mg/ml streptomycin. The uptake of 2-[3H]deoxyglucose (50 μm) was measured in Krebs-Ringer phosphate buffer for 6 min at 37 °C as described previously (21). Compounds 3 and 17 (20 μm) were added 6 min prior to glucose.
Statistical Analyses
All data presented are derived from at least three independent determinations, unless otherwise noted. Two-tailed p values were calculated using paired or unpaired t-tests as indicated, with the GraphPad Prism software (San Diego). p values <0.05 were considered to be statistically significant. The IC50 value for compounds was determined using GraphPad Prism software.
Results
GLUT4 Homology Model Building
Using the primary amino acid sequence of GLUT4 as the query, relevant template structures were first identified by performing a homology search in the Protein Data Bank database for BLAST and PSI-BLAST. The search did not yield a single template with more than 30% sequence similarity to the GLUT4 query sequence. Hence, a multiple template technique utilizing GlpT (25) lactose permease (26) and EmrD (a multidrug transporter) (27) sequences were utilized. The templates were assigned to different regions of the query sequence of GLUT4. Therefore, each part of GLUT4 was built with the appropriate template structure. The Prime 3.1 module of the Schrodinger suite (28) was used for building the homology model of GLUT4. Prime 3.1 is a well validated protein structure prediction suite of programs that integrates comparative modeling and fold recognition into a single interface. The comparative modeling path incorporates complete protein structure prediction including template identification, alignment, and model building. Furthermore, Prime allows for refinement of the side-chain prediction, loop prediction, and minimization. The alignment steps were then used to align the templates with the query. Unfortunately, the alignment was not optimal and had several gaps. Secondary structure prediction tools were used to obtain better alignment. Using this integrated homology building tool, the N terminus, C terminus, and the extracellular (EC) loops along with all 12 TM helices were modeled. After building the model of GLUT4, it was validated using MolProbity software (29). The MolProbity analysis revealed that the GLUT4 model built in Prime and minimized using the OPLS-2005 force field had <3% clash score, <5% poor rotamers, <0.89% Ramachandran outliers, 94.02% favorable rotamers, and there were no residues with bad bonds and angles.
Because GLUT4 traverses through the lipid bilayer, the model structure was evaluated using molecular dynamic simulations (MDS) with Desmond software (30). The MDS of GLUT4 was performed using the structure embedded in a POPC lipid bilayer, a ubiquitous cell membrane phospholipid, to investigate the intrinsic dynamic behavior of the 12 TM along with the EC loops. A 20-ns MDS was carried out with a time step of 5 ps in an isotropic pressure coupling condition. A smooth particle mesh Ewald method for accurate long range electrostatic evaluation in an NTP ensemble attaching a Nose-Hoover thermostat was also applied (30). The stability of the GLUT4 model was assessed by plotting the graph of potential energy versus time, and the stable model is presented in Fig. 1. Because limited biochemical studies are available for GLUT4, experimental data available for GLUT1 was used as they both belong to the same class and have ∼68% sequence similarity (20). Of the 12 TMs, helices 1–6 form the N-terminal bundle, and helices 7–12 form the C-terminal bundle. While carrying out this work, a homology model of GLUT1 (1SKU.pdb) was available in the Protein Data Bank. We compared our GLUT4 model with the GLUT1 homology model to assess the quality of our model. The site identification (SITE-ID) module (20) implemented in Sybyl X1.3 was used to identify potential small molecule ligand-binding sites in both GLUT1 and GLUT4. This ligand-binding site is a continuation of the central solute channel as identified previously for GLUT1 (7). A comparison of the GLUT1 and GLUT4 pockets is shown in Fig. 2.
FIGURE 1.
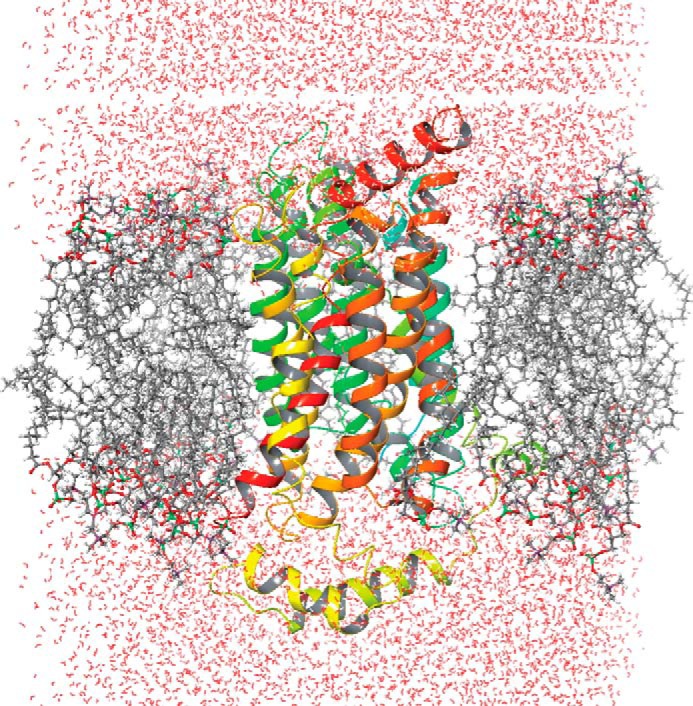
Desmond-simulated GLUT4 homology model in POPC and water molecules; color codes: oxygen, red; carbon, gray; phosphorous, green; GLUT4, multi color ribbon.
FIGURE 2.
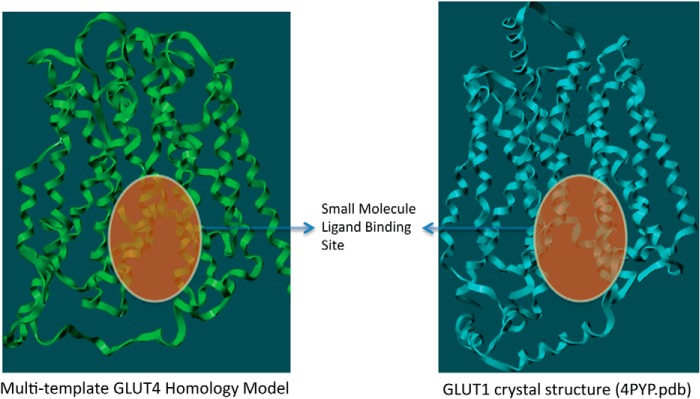
Comparison of the small molecule binding pockets of Glut4 and Glut1 as identified through SITE-ID.
In Silico Filtering of a Commercially Available Small Molecule Database
The ZINC database, which contained ∼18 million compounds at the time we carried out this work, was used for virtual high throughput screening (31). All compounds were subjected to a panel of PAINs and SMARTS filters (32, 33) to eliminate molecules with nondrug-like characteristics that interfere with functionality, including reactive functional groups and known toxophores. This filtering generated a list of ∼10 million drug-like commercially available compounds that were subjected to further screening.
In Silico Screening Workflow
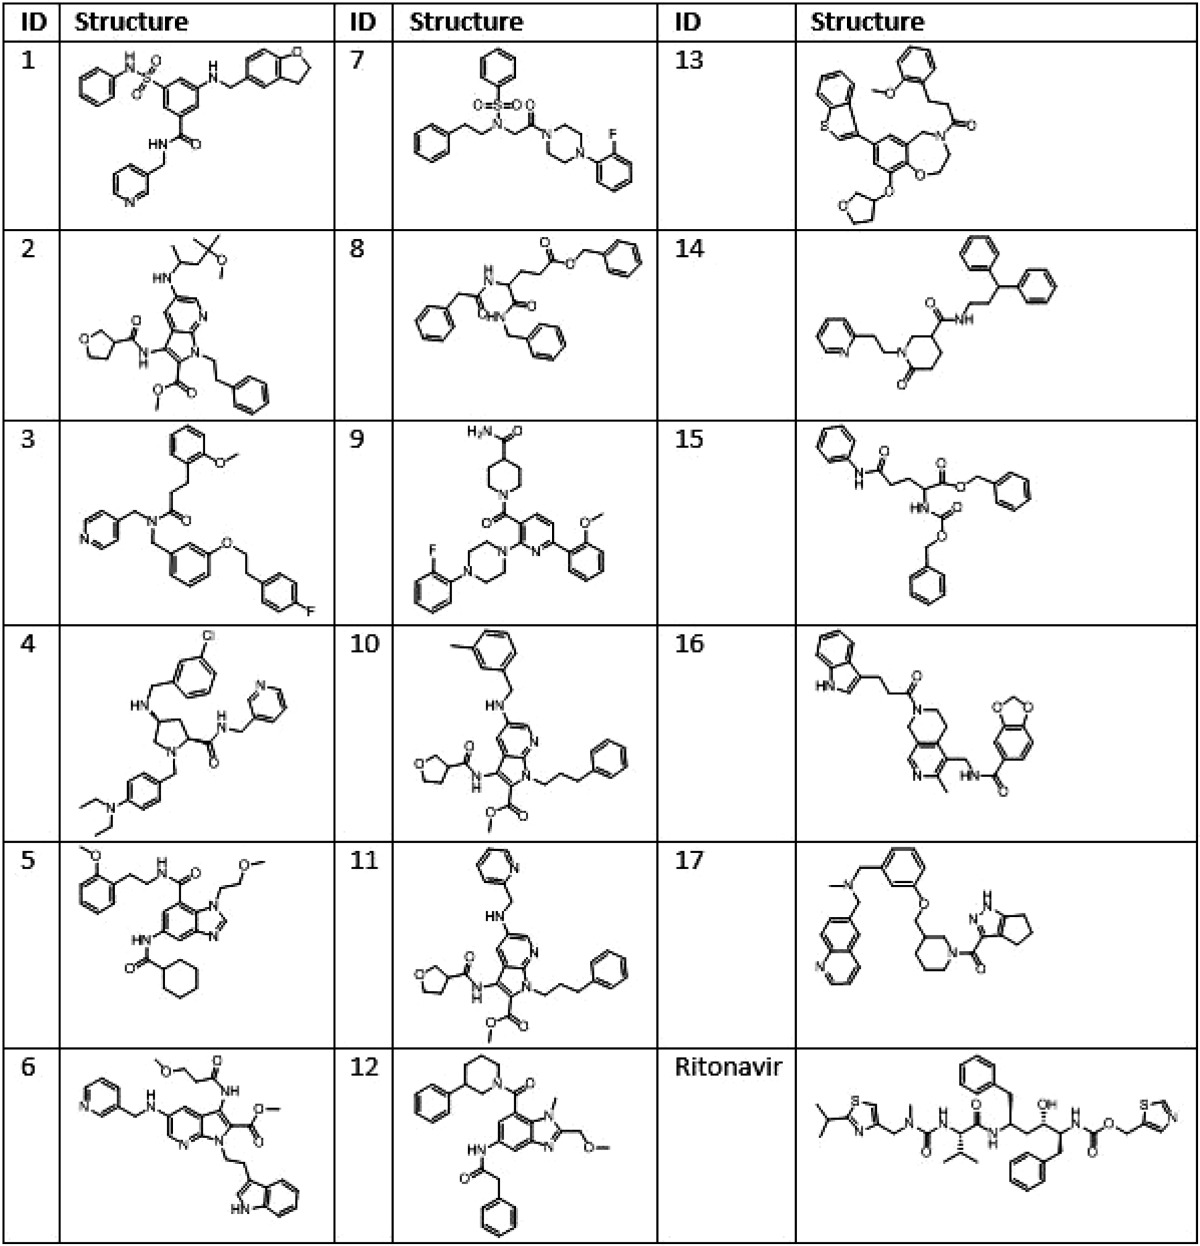
The Glide docking engine (34) implemented in Schrodinger suite was utilized to carry out the 10 million compound virtual high throughput screening. The Prime-generated and Desmond-simulated (34) GLUT4 model was prepared in the Optimized Potentials for Liquid Simulations (OPLS 2005) force field. The Glide docking engine is built on a grid-based algorithm. After preparing the GLUT4 model in OPLS-2005, the grid generating sub-module was used to create a 10 × 10 × 10 Å grid box centered on the small molecule ligand-binding site identified earlier using SITE-ID. The ligand preparation tool available in Schrodinger suite was used to protonate/de-protonate the 10 million compound set at pH = 7.4 ± 1 and to obtain the best initial geometry of the compounds. The ligand van der Waals radius was scaled to 0.80 Å with partial atomic charges <0.15 electrostatic units. The Glide screening workflow has a three-tier docking process consisting of virtual high throughput virtual screening, standard precision, and finally extra precision docking protocols. The three-tier docking engine generated 59 hits with Glide docking scores less than −7.0. The docking score is a function of the ligand-binding energy (28). All 59 structures were re-docked using a different docking engine to obtain consensus binding poses and scores for the hit molecules. The cross-validation used the Surflex docking engine, which is a tool built on a fragment-based algorithm implemented in Tripos software, and is therefore orthogonal to the grid-based algorithm used by Glide (20). Based on the consensus scores and the docked poses from both docking experiments, 32 in silico hits were selected. From this set, 17 compounds were purchased for screening in biological assays based on commercial availability, pricing, and synthetic tractability. The structures of these compounds are given in Table 1.
TABLE 1.
Structures of ritonavir and potential GLUT4-selective hits identified via in silico GLUT4 modeling and vHTS screening of an 18 million compound library
Testing Specificity of Potential GLUT4 Hits
Knockdown (KD) of GLUT4 in L363 cells or culture of L363 in glucose-free media or treatment with a GLUT4 inhibitor (ritonavir) leads to significant cell death (10). JJN3 cells, however, are resistant to similar treatments exhibiting cytostasis with reduced impact on viability upon GLUT4 KD, glucose deprivation, or ritonavir treatment. Despite differential effects on viability, GLUT4 KD is found to inhibit glucose transport in both L363 and JJN3 cells (10). Because the impact of targeting GLUT4 in L363 and JJN3 myeloma cell lines is well established, these cell lines were used to test the 17 in silico-generated potential GLUT4 inhibitors. The rationale was that a compound targeting GLUT4 would elicit selective cytotoxicity in L363 versus JJN3 cells, as detected previously upon GLUT4 suppression or ritonavir inhibition (10). The growth inhibitory effects of the 17 compounds were also assessed in two isogenic MM cell lines expressing GLUT1 or GFP as a control, i.e. KMS11-GLUT1 and KMS11-GFP. The rationale for testing the compounds in these two cell lines was that a GLUT4-targeting compound would be more effective in eliciting cell death in the KMS11-GFP cells as opposed to the KMS11-GLUT1-expressing cells, and likewise a compound with GLUT1 inhibitory properties would likely elicit cytotoxicity in the KMS11-GLUT1 cells.
Serial dilutions of all 17 compounds were tested for their impact on proliferation of the aforementioned MM cell lines in a 72-h MTS proliferation assay. Representative data are included in Fig. 3. Compound 18 is ritonavir, which served as a positive control for this assay. Compounds 3 and 17 were found to elicit a greater impact on proliferation in L363 compared with JJN3 cells and are more effective in KMS11-GFP compared with the KMS11-GLUT1 cells. These compounds were further evaluated for determination of their IC50 value for growth inhibition in MM cells. As shown in Fig. 4, A–C, the IC50 value for compound 3 was 5–12 μm, and for compound 17 it was 6–10 μm based on the cell line and displayed greater potency than ritonavir (40 μm). A separate evaluation of the impact of the compounds on cellular viability demonstrated JJN3 cells to be more resistant than L363 to compounds 3 and 17 and ritonavir (Fig. 4D). These results corroborate previous observations on the resistance of JJN3 cells to GLUT4 inhibition or KD (10). Finally, we evaluated the impact of compound 3 on myeloma patient sample viability. Primary myeloma/plasma cell leukemia cells isolated from bone marrow aspirates or peripheral blood, respectively, were treated with compound 3 with or without metformin. Compound 3 was indeed effective in inducing apoptosis and elicited greater cytotoxicity in combination with metformin as seen previously in GLUT4-inhibited MM patient samples (Fig. 4E) (13). In contrast, normal T cell and stromal cell populations associated with the myeloma cell harvest exhibited minimal cytotoxicity with the co-treatments (data not shown).
FIGURE 3.

Screening of 17 compounds for inhibition of MM cell proliferation. Serial dilutions of 17 compounds resuspended in DMSO were tested for their impact on proliferation of the L363, JJN3, KMS11-GFP, and KMS11-GLUT1 cell lines. 5000 cells in RPMI 1640 medium containing 5 mm glucose and 2 mm glutamine were dispensed per well into a 384-well plate in triplicate as described under “Experimental Procedures.” 2-Fold reducing serial dilutions of the compounds starting from a 25 μm stock, except for compounds 6, 10, and 17 where the starting stock was 12.5 μm due to difficulty in solubilization, were then distributed into the wells. Viable cell numbers were assessed at 72 h by measurement of absorbance at 490 nm utilizing an MTS kit (PromegaTM) and normalized to vehicle-treated samples. Data from one of two experiments is presented.
FIGURE 4.

Compounds 3 and 17 are more cytotoxic than ritonavir in multiple myeloma. The IC50 value of compound 3 (A), compound 17 (B), and ritonavir (C) was determined in L363, JJN3, and KMS11 cells by treatment with 0.39–50 μm compounds 3 or 17 or 1.25–100 μm ritonavir. Cell survival was examined after 72 h by Cell Titer-Glo luminescent cell viability assay. D, L363, JJN3, and KMS11 cells were cultured in the presence or absence of either ritonavir (40 μm), compound 3, or compound 17 (5, 10, 15, and 20 μm) in RPMI 1640 media containing 11 mm glucose and 2 mm glutamine for 72 h followed by assessment of viability by annexinV/DAPI staining. E, viability of CD38+ CD45− myeloma cells after a 48-h treatment with compound (Cmpd) 3 (10 μm) or metformin (Met) (1 mm) was assessed by annexinV DAPI staining. F, JJN3 and L363 cells were transduced with nontargeting or GLUT4-directed shRNA. Efficiency of KD was determined by quantitative PCR analysis of GLUT4 expression normalized to GAPDH expression. G, cells from F were utilized to determine impact on growth subsequent to indicated treatments after 72 h evaluated using trypan blue staining and an automated cell counter. Data, normalized to vehicle controls, represent the mean ± S.E. of three independent measurements.
To further establish the on-target efficacy of the identified GLUT4 inhibitors, we evaluated the impact of compounds 3 and 17 on proliferation of cells exhibiting a suppression of GLUT4 expression. Our hypothesis was that GLUT4-suppressed cells would not be further growth-inhibited with a GLUT4 inhibitor due to removal of the cognate target. Indeed, suppression of GLUT4 with a GLUT4-targeting shRNA (efficiency of KD demonstrated in Fig. 4F) led to suppression of growth as anticipated but no further suppression upon treatment with ritonavir or compounds 3 or 17 (Fig. 4G).
Compounds 3 and 17 Bind Selectively to GLUT4 Versus GLUT1
To confirm the ability of compounds 3 and 17 to bind selectively to GLUT4, a previously established competitive binding assay that allows targeting of the glucose-binding site of GLUTs from the cytoplasmic side was utilized (23). Specifically, the biotinylated membrane impermeant bis-mannose photolabel ATB-BMPA was used to label LDM in the presence or absence of inhibitor. The relatively low level of GLUT4 expression in myeloma cells precluded direct assessment of drug binding in these cells. The ability of compounds 3 and 17 to inhibit ATB-BMPA labeling of GLUT4 and GLUT1 was therefore tested in LDMs prepared from 3T3-L1 adipocytes that contain both GLUT4 and GLUT1 in an inverted orientation relative to that found in the plasma membrane. As demonstrated in Fig. 5, compounds 3 and 17 reduced ATB-BMPA binding to GLUT4 to a much greater extent than to GLUT1.
FIGURE 5.
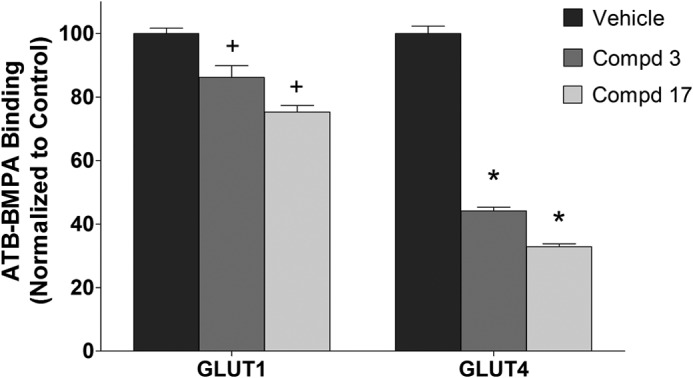
Selective inhibition of ATB-BMPA photolabeling by compounds 3 and 17. DMSO (vehicle control) or compounds (Cmpd) 3 and 17 (20 μm) were added to 200 μg of LDM prepared from 3T3-L1 adipocytes for 10 min at room temperature. Samples were then irradiated with biotinylated ATB-BMPA (50 μm final concentration) as described under “Experimental Procedures.” Biotinylated proteins, isolated from detergent-solubilized LDM using a high capacity streptavidin-agarose resin, were analyzed by immunoblot analysis using GLUT4 or GLUT1 antibodies. GLUT proteins were quantified using an Odyssey Infrared Imaging System. Data, normalized to vehicle controls, represent the mean ± S.E. of three independent measurements. + and *, p < 0.05 versus GLUT1 or GLUT4 control, respectively.
Compounds 3 and 17 Inhibit Glucose Transport through GLUT4
Compounds 3 and 17 were further evaluated in terms of their ability to inhibit glucose transport in HEK293 cells that exogenously express GLUT1, GLUT4, or a GLUT4 P401L dead transporter (Fig. 6A). 2-DOG uptake values of the P401L cell line were used to approximate the contribution of the endogenous transporters. Changing proline 401 to leucine is a dramatic change of an important amino acid residue that totally abolishes transport activity. Both compounds 3 and 17 statistically inhibit 2-DOG uptake by the endogenous transporters. 2-DOG uptake in cells expressing GLUT4 or GLUT1 was 3–4-fold higher than that of cells expressing GLUT4 P401L. Compounds 3 and 17 inhibited 2-DOG uptake in GLUT4-expressing cells to a greater extent than in GLUT1-expressing cells. The transport activity of the exogenously expressed protein after subtraction of 2-DOG uptake values of the P401L GLUT4 expressing cells (control and compounds 3 and 17) are shown in Fig. 6B. GLUT4 and GLUT1 were functionally active in terms of 2-DOG uptake. Both compounds 3 and 17 inhibited GLUT4 transporter activity ∼50% but had essentially no effect on GLUT1 (IC50 for inhibition of GLUT4 was 18.9 μm for compound 3 and 10.8 μm for compound 17). Interestingly, 2-DOG uptake and ATB-BMPA binding results are nearly identical in terms of the inhibition of GLUT1 and GLUT4 by these compounds (Figs. 6B and 5), which strongly support the isoform selectively of these compounds for GLUT4 over GLUT1.
FIGURE 6.
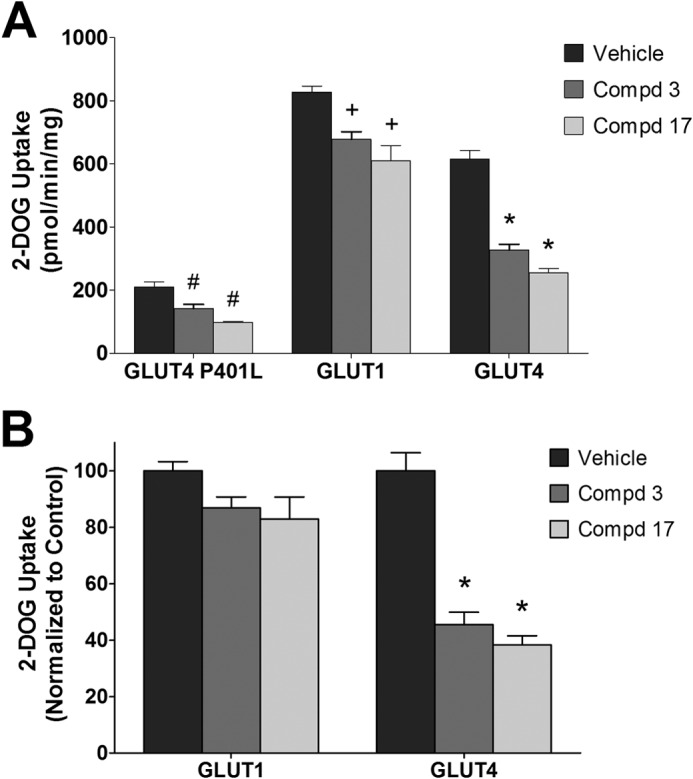
Inhibition of 2-deoxyglucose uptake of GLUT4 and GLUT1 by compounds 3 and 17 in 293 cells. A, 2-DOG uptake. Compounds (Cmpd) 3 and 17 (20 μm) were added 6 min prior to glucose uptake in 293 cells expressing GLUT1, GLUT4, and a GLUT4 transporter dead mutant P401L. 2-[3H]Deoxyglucose uptake was measured at 37 °C for 6 min as described under “Experimental Procedures.” Data are shown as mean uptakes ± S.E. relative to control, n = 3; #, +, and *, p < 0.05 versus GLUT4 P401L, GLUT1, or GLUT4 control, respectively. B, specific GLUT4 and GLUT1 uptakes. Uptake from the GLUT4 P401L cells (control and compounds 3/17) was subtracted from the corresponding GLUT1 and GLUT4 data shown in A. *, p < 0.05 versus GLUT4 control.
Glucose transport in the JJN3 and KMS11-GFP cells was then evaluated. Compounds 3 and 17 inhibited glucose transport in both cell lines with compound 17 having the more potent effect (Fig. 7). These results are consistent with the proposition that the growth inhibitory effects of compounds 3 and 17 in L363 versus JJN3 and KMS11-GFP- versus KMS11-GLUT1-expressing cells are due to inhibition of GLUT4-mediated glucose transport.
FIGURE 7.
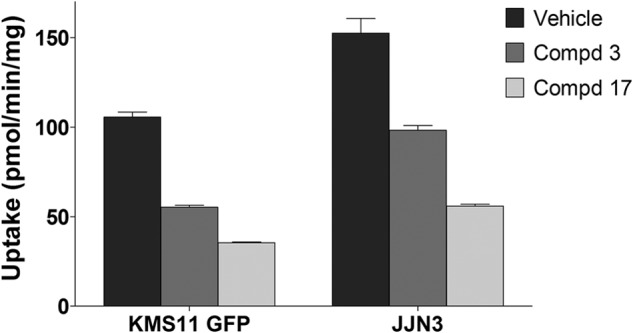
Inhibition of 2-deoxyglucose uptake of JJN3 and KMS11-GFP cells by compounds 3 and 17. Compounds 3 and 17 (20 μm) were added 6 min prior to glucose uptake. 2-[3H]Deoxyglucose uptake was measured at 37 °C for 6 min as described under “Experimental Procedures.” Data shown as mean uptakes ± S.E. relative to control, n = 3; *, p < 0.05 versus control.
Structural Analogues of Compounds 3 and 17 Impact Glucose Transport and Viability of MM Cells
To further determine whether both compounds 3 and 17 were amenable to modification, we tested a set of their close structural analogues. Some of these analogues displayed lower IC50 values for inhibition of proliferation than compounds 3 and 17 (IC50 values for growth inhibition of all analogues are included in Table 2). Data on two derivatives of compounds 3 and 17 are included in Fig. 8. The impact on L363 and JJN3 viability is demonstrated in Fig. 8A and the impact on glucose transport in Fig. 8B. Compound 26, a structural analogue of compound 3, has an IC50 value for inhibition of glucose transport through GLUT4 at 3.5 μm and for GLUT1 >100 μm. Compound 39, a structural analogue for compound 17, exhibits an IC50 value for inhibition of glucose transport through GLUT1 and GLUT4 at around 30 μm with loss of selectivity toward GLUT4. These data indicate that our two hit series represent promising candidates for further structural modification to increase potency and selectivity as potential GLUT4-directed MM therapeutics.
TABLE 2.
IC50 evaluation of structural derivatives of Compounds 3 and 17 with 72 h of treatment in the KMS11 cell line
| Compound ID | IC50 (for growth inhibition) |
|---|---|
| μm | |
| 19 | 20.48 |
| 21 | 13.16 |
| 23 | 20.58 |
| 24 | 8.82 |
| 25 | 35.31 |
| 26 | 6.67 |
| 27 | 9.7 |
| 29 | 13.98 |
| 31 | 21.19 |
| 33 | 15.44 |
| 35 | 7.11 |
| 36 | 17.00 |
| 38 | 9145 |
| 39 | 3.31 |
| 40 | 30.97 |
| 41 | 8.68 |
FIGURE 8.
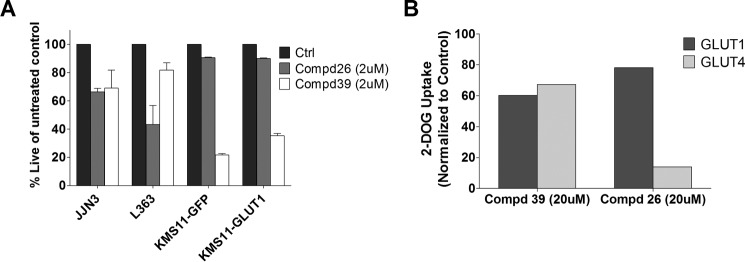
Structural derivatives of compounds 3 and 17 exhibit altered efficacy and selectivity. A, impact of analogues compounds (Cmpd) 26 and 39 (2 μm) on viability of MM cell lines after 72 h of treatment assessed by annexinV/DAPI staining. B, inhibition of 2-deoxyglucose uptake of GLUT4 and GLUT1 by compounds 26 and 39 in 293 cells. Compounds 26 and 39 (20 μm) were added 6 min prior to glucose uptake in 293 cells expressing GLUT1, GLUT4, and a GLUT4 transporter dead mutant P401L. 2-[3H]Deoxyglucose uptake was measured at 37 °C for 6 min as described under “Experimental Procedures.” Uptake from the GLUT4 P401L cells was subtracted from the corresponding GLUT1 and GLUT4 data and then normalized to vehicle control (Ctrl). Data shown as mean uptakes ± S.E. relative to control, n = 3; #, +, and *, p < 0.05.
Homology Model Building of GLUT4 with the GLUT1 Crystal Structure
Subsequent to our work in identifying a set of selective GLUT4 inhibitors using a model built by using a multitemplate method, the crystal structure of GLUT1 was published (35). To compare the GLUT4 model that we generated using a multitemplate approach with that obtained from a single template, we built a comparative homology model of GLUT4 using the published GLUT1 crystal structure. Because the homology between GLUT1 and GLUT4 isoforms is very high (68.7%), the single template method would be expected to provide an accurate GLUT4 model.
The comparative homology model using a single template (model 2) was constructed using the same Prime 3.1 homology building tool with the GLUT1 crystal structure as in our previous GLUT4 model (model 1). Model 2 was then subjected to MolProbity (29) to validate the quality of the model. MolProbity analysis showed that model 2 had <1% clash score, <2% poor rotamers, <0.56% Ramachandran outliers, and 98% favorable rotamers, and there were no residues with bad bonds and angles. This model was again subjected to MDS with Desmond software (30). The MDS of GLUT4 model 2 was performed using the structure embedded in a POPC lipid bilayer, to investigate the intrinsic dynamic behavior of the 12 TM along with the EC loops. A 20-ns MDS was carried out with a time step of 5 ps in an isotropic pressure coupling condition. After obtaining a stable model from the MDS, the model was compared with the earlier model constructed using multiple templates (model 1). The overlap between the two models is shown in Fig. 9. Comparison of both models demonstrated minimal variation in the central solute channel Cα chain (r.m.s.d. <2.5 Å), and the overall r.m.s.d. between the two models was 5.2 Å. The deviation was mostly observed in the loop domains of the two models. We also overlaid GLUT4 models 1 and 2 with the GLUT1 crystal structure. Model 1 has an r.m.s.d. deviation of 5.8 Å, and model 2 has a deviation of 2.5 Å with GLUT1. It is important to note that the deviation observed between the two GLUT4 models was mostly in the extracellular loop domains, areas that are known to be challenging in homology model building. As pointed out above, the deviations in the ligand-binding sites between model 1 and 2 was minimal supporting the robustness of model 1 in our screening strategy.
FIGURE 9.

Overlap of the ribbon structures of model 1 (ribbon color, cyan) and model 2 (ribbon color, green). The overall r.m.s.d. between the models is 5.2 Å and the ligand-binding site TM r.m.s.d. is 2.2 Å.
Interactions of Compounds 3 and 17 with GLUT4 and GLUT1
After defining the ligand-binding site using the SITE-ID tool for model 2 in the same manner as we described for model 1, we carried out docking of the two hits (compound 3 and 17) using similar protocols as stated earlier for Glide- and Surflex-based docking. Both compounds docked well in Glide and Surflex and showed consensus scores and poses. Analyzing the docked poses of the two hits, we found that compound 3 shows a strong hydrogen bond interaction with Asn-176 and Gln-177 residues (Fig. 10). Moreover, the phenyl ring of the fluorobenzene group is in a hydrophobic enclosure contributing to strong hydrophobic interactions with Phe-307, Trp-428, Phe-38, and Ile-42 residues as shown in Fig. 10. The docked pose of compound 17 (Fig. 11) shows hydrogen bond interactions with Asn-176, and the quinoline ring of compound 17 has a hydrophobic interaction with Phe-307. The central phenyl ring of the compound demonstrates strong π-π interactions with Trp-404. Importantly, Asn-176 and Ile-42 are the same residues that were identified as participating in the selective binding of the HIV protease inhibitors to GLUT4 and preventing binding to GLUT1 (23).
FIGURE 10.

Compound 3 (magenta) interacting with GLUT4 residues. The black dotted lines are the potential hydrogen bonds. The docked pose of compound 3 also shows a π-staking with Phe-307.
FIGURE 11.

Compound 17 (orange) interacting with GLUT4 residues. The black dotted lines are the potential hydrogen bonds. The docked pose shows a π staking of the compound with Trp-404.
Discussion
Multiple myeloma is a plasma cell malignancy accounting for 10% of deaths from all hematological malignancies with ∼24,000 new diagnoses annually in the United States (36–38). Although a number of novel combinatorial treatment regimens in addition to autologous stem cell transplantation have improved long term survival, the majority of patients succumb to the disease due to development of resistance. Targeting abnormal tumor cell metabolism can provide a novel means to broadly target genetically heterogeneic-resistant clonal subpopulations characteristic of this malignancy. In addition, we and others have shown that targeting glucose metabolism chemosensitizes to a number of anti-cancer agents and radiotherapy (12, 13, 39–42). Metabolic pathways exhibit a significant amount of plasticity; therefore, identifying key rate-limiting proximal checkpoints will be ideal to overcome potential resistance-promoting secondary metabolic pathways. Glucose transporters provide one such key rate-limiting proximal checkpoint (5) that can be targeted for MM and potentially other glucose- or insulin-dependent cancers.
Glucose entry into a cell is largely mediated by the SLC2A family of facilitative transporters (protein symbol GLUT) (8). Among the 14 SLC2A family members GLUT1, -3, and -4 exhibit the highest affinity and lowest Km value for glucose (8).
A number of nonselective glucose transporter inhibitors such as cytochalasin B, phloretin, phlorezin, fasentin, genistein, apigenin, or compounds that have off-target GLUT inhibitory effects, such as indinavir and ritonavir, have been used over the years to perturb cellular glucose transport. More recently, modification of existing glucose transporter inhibitors in concert with the knowledge of structural elements of the transporter have enabled identification of isoform-selective inhibitors. This strategy has been applied to target the SGLT Na+/ATP-dependent glucose transporters (43). SGLT2 plays a key role in the active resorption of glucose in the proximal convoluted tubules of the kidney (44). Inhibitors selective for SGLT2 over SGLT1, such as canagliflozin and dapagliflozin, have been derived by adding a C-glycoside linkage modification to phlorizin (9, 35). These compounds block re-absorption of glucose in the kidney, and both molecules are now in clinical use for the treatment of type 2 diabetes (45–47). Food and Drug Administration-approved dapagliflozin is 1200 times more selective for SGLT2 than SGLT1, and its clinical applicability is proof of principle that isoform-specific glucose transporter inhibitors can be identified and applied for disease therapy (48). Expression levels of GLUTs have been investigated in cancer with GLUT1 demonstrating elevated expression in a number of cancers (6). The STI series of compounds have been identified as GLUT1-selective inhibitors with efficacy in VHL-dependent renal cell cancers (4). GLUT1, however, is the most ubiquitously expressed GLUT, a major glucose transporter in erythrocytes, and is also responsible for glucose transport in epithelial and endothelial cells accounting for glucose transport across the blood-brain barrier (49). Therefore, transporters that are more selectively expressed, playing a critical role in maintaining tumor cell survival, may prove to be better targets for cancer therapy.
We have previously identified a unique dependence of MM cells on the insulin-responsive transporter GLUT4 (10). GLUT4 exhibits more limited expression profiles than GLUT1 and is abundantly expressed in insulin-responsive tissues such as the muscle and adipose tissue. In lieu of a GLUT4 crystal structure, we have effectively designed an in silico model of GLUT4 and successfully utilized it for screening a library of diverse drug-like compounds. Our initial screen identified 17 molecules that we subsequently narrowed down first based on their impact on cell viability. As a first level screen, evaluation of the cytotoxicity of the potential inhibitors in our four cell line panel was robust enough to detect compounds that act as GLUT4-selective antagonists of glucose transport. The L363 versus JJN3 cell lines (exhibiting sensitivity and resistance, respectively, to GLUT4 KD) allowed screening and selection of potential GLUT4 inhibitors based on the levels of cytotoxicity elicited. In addition, screening against the KMS11-GFP and GLUT1 pair allowed selecting for compounds that are more effective in the GFP-expressing cells. Although GLUT1-associated increases in glucose transport could account for resistance, the compounds are not targeting GLUT1 as we have selected for compounds exhibiting increased efficacy in the KMS11-GFP cell line. Specificity for GLUT4 over GLUT1 was confirmed through evaluation of inhibitor binding using a previously established ATB-BMPA photolabeling assay (50). As expected, the ability of these compounds to bind to GLUT4 correlates with effects on glucose transport activity when measured in cells engineered to selectively overexpress the glucose transporter. Specificity for the effects on the proliferation being mediated by GLUT4 inhibition was confirmed by evaluation of the efficacy of compounds 3 and 17 in GLUT4-suppressed MM cells. The administration of ritonavir in GLUT4 knock-out mice also demonstrates that the primary effect of ritonavir on modulation of peripheral glucose disposal is mediated by direct inhibition of GLUT4 and not other glucose transporters (51). These results further confirm the ability to generate GLUT-specific inhibitors.
We recently demonstrated that inhibition of GLUT4 with ritonavir in combination with metformin elicits potent cytotoxicity in MM, chronic lymphocytic leukemia, diffuse large B cell lymphoma, breast, melanoma, and ovarian cancers (12, 13). However, as a cancer therapeutic, a compound with greater potency is desirable to limit off-target effects. We demonstrated that compound 3 is cytotoxic and efficacious in the context of metformin in MM at far lower concentrations than previously demonstrated with ritonavir (12, 13). We believe our studies demonstrate that the activity of compounds 3 and 17 is tied to specific structural residues and suggest that we have promising leads for further optimization.
Although this study specifically focused on selective inhibition of GLUT4 over GLUT1, the power of this approach can be used to expand the characterization of isoform selectivity for each of the known GLUT isoforms. Myeloma cells are known to up-regulate expression of GLUT8 and GLUT11, and shRNA knockdown of these transporters also affects cell viability (10). Further investigation of the role of these transporter isoforms in both health and disease is clearly warranted and may provide novel insights into their roles in other cancers.
For future modifications and screening, HIV protease inhibitors such as ritonavir and indinavir that have off-target inhibitory effects on GLUT4 administered to chronically ill patients and are proof of principle that GLUT4-targeting agents can be tolerated in clinical use. We believe that short term reversible and isoform-selective inhibition of glucose transport can be beneficial for the treatment and chemo-sensitization of MM. Our study thus provides the platform for further modification and identification of GLUT isoform-selective inhibitors that can be used to target glucose transport-driven disease states. Further progress in the elucidation of the tertiary structure of the mammalian glucose transporters and characterization of the dynamic changes in protein conformation that occur during the full glucose transport cycle will aid in effective targeting. This structure-based approach will significantly aid in the development of novel drugs with even greater potency, selectivity, and favorable pharmacokinetic profiles.
This work was supported by American Cancer Society Research Scholar Grant RSG-11-254-01-CSM (to M. S.) and a research award from the Richard Silverman-Center for Molecular Innovation and Drug Discovery (to M. S.). Part of this work was performed by the Northwestern University Medicinal and Synthetic Chemistry Core (ChemCore) at the Center for Molecular Innovation and Drug Discovery, which is funded by the Chicago Biomedical Consortium with support from The Searle Funds at The Chicago Community Trust. This work was supported in part by National Institutes of Health Grant P30 CA060553 from the NCI (to the Robert H. Lurie Comprehensive Cancer Center).
- MM
- multiple myeloma
- MDS
- molecular dynamic simulation
- TM
- transmembrane
- LDM
- low density microsome
- EC
- extracellular
- POPC
- 1-palmitoyl-2-oleoyl-sn-glycero-3-phosphatidylcholine
- r.m.s.d.
- root mean square deviation
- GLUT
- glucose transporter
- 2-DOG
- 2-[3H]deoxyglucose
- MTS
- 3-(4,5-dimethylthiazol-2-yl)-5-(3-carboxymethoxyphenyl)-2-(4-sulfophenyl)-2H-tetrazolium inner salt.
References
- 1. Durie B. G., Waxman A. D., D'Agnolo A., Williams C. M. (2002) Whole-body (18)F-FDG PET identifies high-risk myeloma. J. Nucl. Med. 43, 1457–1463 [PubMed] [Google Scholar]
- 2. Bredella M. A., Steinbach L., Caputo G., Segall G., Hawkins R. (2005) Value of FDG PET in the assessment of patients with multiple myeloma. AJR Am. J. Roentgenol. 184, 1199–1204 [DOI] [PubMed] [Google Scholar]
- 3. Bartel T. B., Haessler J., Brown T. L., Shaughnessy J. D., Jr., van Rhee F., Anaissie E., Alpe T., Angtuaco E., Walker R., Epstein J., Crowley J., Barlogie B. (2009) F18-fluorodeoxyglucose positron emission tomography in the context of other imaging techniques and prognostic factors in multiple myeloma. Blood 114, 2068–2076 [DOI] [PMC free article] [PubMed] [Google Scholar]
- 4. Castellani M., Carletto M., Baldini L., Calori R., Longari V., Soligo D., Dellavedova L., Gerundini P. (2010) The prognostic value of F-18 fluorodeoxyglucose bone marrow uptake in patients with recent diagnosis of multiple myeloma: a comparative study with Tc-99m sestamibi. Clin. Nucl. Med. 35, 1–5 [DOI] [PubMed] [Google Scholar]
- 5. Rodríguez-Enríquez S., Marín-Hernández A., Gallardo-Pérez J. C., Moreno-Sánchez R. (2009) Kinetics of transport and phosphorylation of glucose in cancer cells. J. Cell. Physiol. 221, 552–559 [DOI] [PubMed] [Google Scholar]
- 6. Macheda M. L., Rogers S., Best J. D. (2005) Molecular and cellular regulation of glucose transporter (GLUT) proteins in cancer. J. Cell. Physiol. 202, 654–662 [DOI] [PubMed] [Google Scholar]
- 7. Chan D. A., Sutphin P. D., Nguyen P., Turcotte S., Lai E. W., Banh A., Reynolds G. E., Chi J. T., Wu J., Solow Cordero D. E., Bonnet M., Flanagan J. U., Bouley D. M., Graves E. E., Denny W. A., et al. (2011) Targeting GLUT1 and the Warburg effect in renal cell carcinoma by chemical synthetic lethality. Sci. Transl. Med. 3, 94ra70. [DOI] [PMC free article] [PubMed] [Google Scholar]
- 8. Manolescu A. R., Witkowska K., Kinnaird A., Cessford T., Cheeseman C. (2007) Facilitated hexose transporters: new perspectives on form and function. Physiology 22, 234–240 [DOI] [PubMed] [Google Scholar]
- 9. Maratou E., Dimitriadis G., Kollias A., Boutati E., Lambadiari V., Mitrou P., Raptis S. A. (2007) Glucose transporter expression on the plasma membrane of resting and activated white blood cells. Eur. J. Clin. Invest. 37, 282–290 [DOI] [PubMed] [Google Scholar]
- 10. McBrayer S. K., Cheng J. C., Singhal S., Krett N. L., Rosen S. T., Shanmugam M. (2012) Multiple myeloma exhibits novel dependence on GLUT4, GLUT8, and GLUT11: implications for glucose transporter-directed therapy. Blood 119, 4686–4897 [DOI] [PMC free article] [PubMed] [Google Scholar]
- 11. Murata H., Hruz P. W., Mueckler M. (2000) The mechanism of insulin resistance caused by HIV protease inhibitor therapy. J. Biol. Chem. 275, 20251–20254 [DOI] [PubMed] [Google Scholar]
- 12. Adekola K. U., Dalva Aydemir S., Ma S., Zhou Z., Rosen S. T., Shanmugam M. (2015) Investigating and targeting chronic lymphocytic leukemia metabolism with the HIV protease inhibitor ritonavir and metformin. Leuk. Lymphoma 56, 450–459 [DOI] [PMC free article] [PubMed] [Google Scholar]
- 13. Dalva-Aydemir S., Bajpai R., Martinez M., Adekola K. U., Kandela I., Wei C., Singhal S., Koblinski J. E., Raje N. S., Rosen S. T., Shanmugam M. (2015) Targeting the metabolic plasticity of multiple myeloma with FDA approved ritonavir and metformin. Clin. Cancer Res. 21, 1161–1171 [DOI] [PMC free article] [PubMed] [Google Scholar]
- 14. Birnbaum M. J. (1989) Identification of a novel gene encoding an insulin-responsive glucose transporter protein. Cell 57, 305–315 [DOI] [PubMed] [Google Scholar]
- 15. Mueckler M., Caruso C., Baldwin S. A., Panico M., Blench I., Morris H. R., Allard W. J., Lienhard G. E., Lodish H. F. (1985) Sequence and structure of a human glucose transporter. Science 229, 941–945 [DOI] [PubMed] [Google Scholar]
- 16. Corvera S., Chawla A., Chakrabarti R., Joly M., Buxton J., Czech M. P. (1994) A double leucine within the Glut4 glucose-transporter cooh-terminal domain functions as an endocytosis signal. J. Cell Biol. 126, 979–989 [DOI] [PMC free article] [PubMed] [Google Scholar]
- 17. Oka Y., Asano T., Shibasaki Y., Lin J. L., Tsukuda K., Katagiri H., Akanuma Y., Takaku F. (1990) C-terminal truncated glucose transporter is locked into an inward-facing form without transport activity. Nature 345, 550–553 [DOI] [PubMed] [Google Scholar]
- 18. Hebert D. N., Carruthers A. (1992) Glucose transporter oligomeric structure determines transporter function. Reversible redox-dependent interconversions of tetrameric and dimeric GLUT1. J. Biol. Chem. 267, 23829–23838 [PubMed] [Google Scholar]
- 19. Hertel J., Struthers H., Horj C. B., Hruz P. W. (2004) A structural basis for the acute effects of HIV protease inhibitors on GLUT4 intrinsic activity. J. Biol. Chem. 279, 55147–55152 [DOI] [PMC free article] [PubMed] [Google Scholar]
- 20. Tripos (2011) SYBYL-X, Version 1.3, Tripos, St. Louis [Google Scholar]
- 21. Tordjman K. M., Leingang K. A., James D. E., Mueckler M. M. (1989) Differential regulation of two distinct glucose transporter species expressed in 3T3-L1 adipocytes: effect of chronic insulin and tolbutamide treatment. Proc. Natl. Acad. Sci. U.S.A. 86, 7761–7765 [DOI] [PMC free article] [PubMed] [Google Scholar]
- 22. Piper R. C., Hess L. J., James D. E. (1991) Differential sorting of two glucose transporters expressed in insulin-sensitive cells. Am. J. Physiol. 260, C570–C580 [DOI] [PubMed] [Google Scholar]
- 23. Hresko R. C., Kraft T. E., Tzekov A., Wildman S. A., Hruz P. W. (2014) Isoform-selective inhibition of facilitative glucose transporters: elucidation of the molecular mechanism of HIV protease inhibitor binding. J. Biol. Chem. 289, 16100–16113 [DOI] [PMC free article] [PubMed] [Google Scholar]
- 24. Ory D. S., Neugeboren B. A., Mulligan R. C. (1996) A stable human-derived packaging cell line for production of high titer retrovirus/vesicular stomatitis virus G pseudotypes. Proc. Natl. Acad. Sci. U.S.A. 93, 11400–11406 [DOI] [PMC free article] [PubMed] [Google Scholar]
- 25. Lemieux M. J., Huang Y. F., Wang D. N. (2005) Crystal structure and mechanism of GlpT, the glycerol-3-phosphate transporter from E. coli. J. Electron Microsc. 54, 43–46 [DOI] [PubMed] [Google Scholar]
- 26. Guan L., Mirza O., Verner G., Iwata S., Kaback H. R. (2007) Structural determination of wild-type lactose permease. Proc. Natl. Acad. Sci. U.S.A. 104, 15294–15298 [DOI] [PMC free article] [PubMed] [Google Scholar]
- 27. Yin Y., He X., Szewczyk P., Nguyen T., Chang G. (2006) Structure of the multidrug transporter EmrD from Escherichia coli. Science 312, 741–744 [DOI] [PMC free article] [PubMed] [Google Scholar]
- 28. Schrödinger (2013) Maestro, Version 9.6, Prime 3.1, Schrödinger, LLC, New York [Google Scholar]
- 29. Chen V. B., Arendall W. B., 3rd, Headd J. J., Keedy D. A., Immormino R. M., Kapral G. J., Murray L. W., Richardson J. S., Richardson D. C. (2010) MolProbity: all-atom structure validation for macromolecular crystallography. Acta Crystallogr. D Biol. Crystallogr. 66, 12–21 [DOI] [PMC free article] [PubMed] [Google Scholar]
- 30. Davis I. W., Murray L. W., Richardson J. S., Richardson D. C. (2004) MolProbity: structure analysis and all-atom contact analysis for nucleic acids and their complexes. Nucleic Acids Res. 32, W615–W619 [DOI] [PMC free article] [PubMed] [Google Scholar]
- 31. Irwin J. J., Sterling T., Mysinger M. M., Bolstad E. S., Coleman R. G. (2012) ZINC: a free tool to discover chemistry for biology. J. Chem. Inf. Model. 52, 1757–1768 [DOI] [PMC free article] [PubMed] [Google Scholar]
- 32. Hann M. M., Oprea T. I. (2004) Pursuing the leadlikeness concept in pharmaceutical research. Curr. Opin. Chem. Biol. 8, 255–263 [DOI] [PubMed] [Google Scholar]
- 33. Baell J. B. (2013) Broad coverage of commercially available lead-like screening space with fewer than 350,000 compounds. J. Chem. Inf. Model. 53, 39–55 [DOI] [PubMed] [Google Scholar]
- 34. Schrödinger (2011) Glide, Version 5.7, Schrödinger, LLC, New York [Google Scholar]
- 35. Deng D., Xu C., Sun P., Wu J., Yan C., Hu M., Yan N. (2014) Crystal structure of the human glucose transporter GLUT1. Nature 510, 121–125 [DOI] [PubMed] [Google Scholar]
- 36. Kyle R. A., Rajkumar S. V. (2004) Multiple myeloma. N. Engl. J. Med. 351, 1860–1873 [DOI] [PubMed] [Google Scholar]
- 37. Richardson P. G., Schlossman R., Hideshima T., Anderson K. C. (2005) New treatments for multiple myeloma. Oncology 19, 1781–1792 [PubMed] [Google Scholar]
- 38. Munshi N. (2008) Plasma cell disorders: an historical perspective. Hematology 2008, 297. [DOI] [PubMed] [Google Scholar]
- 39. Xu R. H., Pelicano H., Zhang H., Giles F. J., Keating M. J., Huang P. (2005) Synergistic effect of targeting mTOR by rapamycin and depleting ATP by inhibition of glycolysis in lymphoma and leukemia cells. Leukemia 19, 2153–2158 [DOI] [PubMed] [Google Scholar]
- 40. Maschek G., Savaraj N., Priebe W., Braunschweiger P., Hamilton K., Tidmarsh G. F., De Young L. R., Lampidis T. J. (2004) 2-Deoxy-d-glucose increases the efficacy of adriamycin and paclitaxel in human osteosarcoma and non-small cell lung cancers in vivo. Cancer Res. 64, 31–34 [DOI] [PubMed] [Google Scholar]
- 41. Mohanti B. K., Rath G. K., Anantha N., Kannan V., Das B. S., Chandramouli B. A., Banerjee A. K., Das S., Jena A., Ravichandran R., Sahi U. P., Kumar R., Kapoor N., Kalia V. K., Dwarakanath B. S., Jain V. (1996) Improving cancer radiotherapy with 2-deoxy-d-glucose: phase I/II clinical trials on human cerebral gliomas. Int. J. Radiat. Oncol. Biol. Phys. 35, 103–111 [DOI] [PubMed] [Google Scholar]
- 42. Cao X., Fang L., Gibbs S., Huang Y., Dai Z., Wen P., Zheng X., Sadee W., Sun D. (2007) Glucose uptake inhibitor sensitizes cancer cells to daunorubicin and overcomes drug resistance in hypoxia. Cancer Chemother. Pharmacol. 59, 495–505 [DOI] [PubMed] [Google Scholar]
- 43. Wright E. M., Loo D. D., Panayotova-Heiermann M., Lostao M. P., Hirayama B. H., Mackenzie B., Boorer K., Zampighi G. (1994) “Active” sugar transport in eukaryotes. J. Exp. Biol. 196, 197–212 [DOI] [PubMed] [Google Scholar]
- 44. Wright E. M. (2001) Renal Na(+)-glucose cotransporters. Am. J. Physiol. Renal Physiol. 280, F10–F18 [DOI] [PubMed] [Google Scholar]
- 45. Ji L., Ma J., Li H., Mansfield T. A., T'joen C. L., Iqbal N., Ptaszynska A., List J. F. (2014) Dapagliflozin as monotherapy in drug-naive Asian patients with type 2 diabetes mellitus: a randomized, blinded, prospective phase III study. Clin. Ther. 36, 84–100 [DOI] [PubMed] [Google Scholar]
- 46. Ptaszynska A., Johnsson K. M., Parikh S. J., de Bruin T. W., Apanovitch A. M., List J. F. (2014) Safety profile of dapagliflozin for type 2 diabetes: pooled analysis of clinical studies for overall safety and rare events. Drug Saf. 37, 815–829 [DOI] [PubMed] [Google Scholar]
- 47. Yang X. P., Lai D., Zhong X. Y., Shen H. P., Huang Y. L. (2014) Efficacy and safety of canagliflozin in subjects with type 2 diabetes: systematic review and meta-analysis. Eur. J. Clin. Pharmacol. 70, 1149–1158 [DOI] [PubMed] [Google Scholar]
- 48. Han S., Hagan D. L., Taylor J. R., Xin L., Meng W., Biller S. A., Wetterau J. R., Washburn W. N., Whaley J. M. (2008) Dapagliflozin, a selective SGLT2 inhibitor, improves glucose homeostasis in normal and diabetic rats. Diabetes 57, 1723–1729 [DOI] [PubMed] [Google Scholar]
- 49. Zhao F. Q., Keating A. F. (2007) Functional properties and genomics of glucose transporters. Curr. Genomics 8, 113–128 [DOI] [PMC free article] [PubMed] [Google Scholar]
- 50. Hresko R. C., Hruz P. W. (2011) HIV protease inhibitors act as competitive inhibitors of the cytoplasmic glucose-binding site of GLUTs with differing affinities for GLUT1 and GLUT4. PLoS One 6, e25237. [DOI] [PMC free article] [PubMed] [Google Scholar]
- 51. Vyas A. K., Koster J. C., Tzekov A., Hruz P. W. (2010) Effects of the HIV protease inhibitor ritonavir on GLUT4 knock-out mice. J. Biol. Chem. 285, 36395–36400 [DOI] [PMC free article] [PubMed] [Google Scholar]