

Background: Molecular determinants for activation of Slo2.1 K+ channels by intracellular Na+ have not been identified.
Results: Charge reversal of Asp757 of Slo2.1 prevented activation of channels by intracellular Na+, whereas activation by niflumic acid was unaffected.
Conclusion: Asp757 is the primary residue responsible for sensing [Na+]i in Slo2.1.
Significance: The molecular basis of Na+ sensing is conserved in Slo2.1 and Slo2.2 channels.
Keywords: biophysics, gating, patch clamp, potassium channel, Xenopus, Slick, Slo2.1
Abstract
Slo2 potassium channels have a very low open probability under normal physiological conditions, but are readily activated in response to an elevated [Na+]i (e.g. during ischemia). An intracellular Na+ coordination motif (DX(R/K)XXH) was previously identified in Kir3.2, Kir3.4, Kir5.1, and Slo2.2 channel subunits. Based loosely on this sequence, we identified five potential Na+ coordination motifs in the C terminus of the Slo2.1 subunit. The Asp residue in each sequence was substituted with Arg, and single mutant channels were heterologously expressed in Xenopus oocytes. The Na+ sensitivity of each of the mutant channels was assessed by voltage clamp of oocytes using micropipettes filled with 2 m NaCl. Wild-type channels and four of the mutant Slo2.1 channels were rapidly activated by leakage of NaCl solution into the cytoplasm. D757R Slo2.1 channels were not activated by NaCl, but were activated by the fenamate niflumic acid, confirming their functional expression. In whole cell voltage clamp recordings of HEK293 cells, wild-type but not D757R Slo2.1 channels were activated by a [NaCl]i of 70 mm. Thus, a single Asp residue can account for the sensitivity of Slo2.1 channels to intracellular Na+. In excised inside-out macropatches of HEK293 cells, activation of wild-type Slo2.1 currents by 3 mm niflumic acid was 14-fold greater than activation achieved by increasing [NaCl]i from 3 to 100 mm. Thus, relative to fenamates, intracellular Na+ is a poor activator of Slo2.1.
Introduction
Intracellular Na+-activated K+ (KNa)2 channels were first described in isolated cardiomyocytes (1) and trigeminal ganglion neurons (2). Under normal physiological conditions, KNa channels are primarily in a closed state and are only activated when [Na+]i is elevated as can occur in cardiomyocytes during ischemia (3) or due to enhanced Na+/Ca2+ exchange and accumulation of intracellular Na+ in a restricted space near the sarcolemma during rapid pulsing (4). In excised patches from cardiomyocytes, the EC50 for intracellular Na+ activation of KNa was estimated to be 35 mm (1). Using 23Na NMR, [Na+]i can rise by a factor of 4 or 5 during 20–60 min of ischemia in the heart (5, 6) to a level of 25–40 mm (3). It has also been estimated by electron probe microanalysis that the [Na+] in highly restricted spaces just inside the sarcolemma of isolated cardiomyocytes can rise to 40 mm during rapid electrical stimulation (4). In neurons, KNa channels are activated during bursts of activity or in response to a small, but persistent inward Na+ current (7).
Two genes encoding KNa channels were cloned in 2003 and named Slo2.1 (or “Slick” for “sequence like an intermediate conductance K+”) and Slo2.2 (or “Slack” for “sequence like a calcium-activated K+”) (8, 9). Heterologous expression of mammalian Slo2.1 and Slo2.2 channels revealed that in addition to Na+ (EC50 = 67 mm for Slo2.2 (10), 89 mm for Slo2.1 (9)), these channels are also activated by intracellular Cl− in a Na+-dependent manner (8, 9).
G-protein-sensitive inwardly rectifying Kir3.2 and Kir3.4 channels are also activated by intracellular Na+ (11, 12). The proximal region of the cytoplasmic C-terminal domain of Kir channels contains a Na+ coordination motif with the sequence DXRXXH. Together, these six residues form a loop structure with a single Na+ ion coordinated by the side chain carbonyl of Asp, the imidazole side chain of His, and the backbone carbonyls of two other residues (13). Mutation of the Asp in this motif abolishes Na+ activation of Kir3.2, Kir3.3 (11, 12), and Kir5.1 (13) channels. Slo2.2 channels have a similar motif, DXKXXH located in the RCK2 (regulators of conductance of K+ 2) domain of the cytoplasmic C terminus, and mutation of the initial Asp greatly attenuates intracellular Na+-mediated channel activation (10). Mutation of the His residue in the Slo2.2 motif can also decrease the potency of Na+, but to a far lesser extent than mutating Asp. Based on the presumed importance of the Asp, Lys, and His residues in the Na+ coordination motifs in Kir3.2, Kir3.4, Kir5.1, and Slo2.2 channels, we identified five sequences in the cytoplasmic C-terminal domain of Slo2.1 as potential Na+ coordination sites. Here we used site-directed mutagenesis and functional characterization of mutant channels to show that the Asp residue most responsible for channel activation by intracellular Na+ is conserved in Slo2.1 and Slo2.2 channels.
Experimental Procedures
Oocyte Isolation
Procedures used to harvest oocytes from Xenopus laevis (purchased from Xenopus 1) were approved by the University of Utah Institutional Animal Care and Use Committee and were the same as described previously (14). Oocytes were incubated in Barths' solution at 17 °C. Barths' contained (in mm): 88 NaCl, 1 KCl, 0.41 CaCl2, 0.33 Ca(NO3)2, 1 MgSO4, 2.4 NaHCO3, 10 HEPES and 1 pyruvate plus gentamycin (50 mg/liter), amikacin (50 mg/liter), and ciprofloxacin (25 mg/liter); pH was adjusted to 7.4 with NaOH.
Molecular Biology
Human Slo2.1 (KCNT2) cDNA in pTRACER was kindly provided by L. Kaczmarek, Yale University, and subcloned into psGEM as described previously (15). Point mutations in WT Slo2.1 in psGEM were introduced via primers containing the desired mutation using a standard PCR approach and confirmed by sequencing at the University of Utah Core Sequencing Facility. Plasmid cDNA was linearized with SfiI and Slo2.1 cRNA was transcribed using the T7 mMESSAGE mMACHINE RNA kit from Ambion (Life Technologies). For HEK293 cell studies, WT and mutant Slo2.1 channel sequences were subcloned into the bicistronic pIRES2-AcEGFP1 vector (Clontech Laboratories, Inc.) via enzymatic digestion and ligation.
Oocyte Electrophysiology
Oocytes were injected with 1–2 ng of either WT or mutant Slo2.1 cRNA, and recordings were performed 2–4 days after injection. Whole cell currents were recorded from oocytes by using a standard two-electrode voltage clamp (TEVC) technique (16). Data acquisition was performed using a Dell personal computer, a GeneClamp 500 amplifier, and a Digidata 1322A digitizer (Molecular Devices, Inc.) that was controlled with pCLAMP 8.2 software (Molecular Devices, Inc.). An Axopatch 200B amplifier (Molecular Devices, Inc.) was used for recording whole cell and macropatch currents from HEK293FT cells as described below.
Micropipettes were fabricated from 1-mm outer diameter borosilicate glass and had a resistance of 0.5–1 megaohms when filled with 2 m KCl. In some experiments, micropipettes were filled with 2 m NaCl or LiCl. Use of low resistance micropipettes, when tips are not plugged with agarose (17), allows the filling solution to slowly leak into the interior of the oocyte. The resulting intracellular loading of oocytes with salt solution has several limitations, including an undefined and non-uniform intracellular salt concentration that eventually causes cell swelling (18), but is useful for screening mutant channels for their sensitivity to activation by elevated [NaCl]i. Current-voltage (I-V) relationships for Slo2.1 current (ISlo2.1) were determined by applying 0.3-s pulses to test potentials (Vt) ranging from −140 mV to +80 mV, in 20-mV increments. Pulses were applied once every 3 s from a holding potential of −90 mV.
Whole Cell Voltage Clamp of HEK293 Cells
HEK293FT cells were maintained in DMEM (Gibco) supplemented with 10% FBS, 1% penicillin/streptomycin, and 1% G418 at 37 °C in a 5% CO2 incubator. Cells were transfected using Lipofectamine 2000 (Life Technologies) with either WT or mutant Slo2.1 cDNA cloned into the pIRES2-AcEGFP1 vector. Before use in whole cell voltage clamp experiments at 16–28 h after transfection, cells were replated onto coverslips. Pipette (internal) solution contained in mm: 70 KCl, 70 NaCl, 1 MgCl, 5 HEPES, 5 EGTA, pH 7.2. Bath (external) solution contained in mm: 4 KCl, 140 NaCl, 1.2 MgCl, 1.8 CaCl, 10 glucose, 5 HEPES, pH 7.4. Activation of ISlo2.1 was assessed by pulsing to a Vt of 0 mV for 250 ms, once every 3 s from a holding potential of −70 mV. Current magnitude was measured at the end of the 250-ms pulse.
Inside-out Macropatch Recordings of HEK293 Cells
ISlo2.1 in macropatches excised from HEK293FT cells was recorded 2 days after cell transfection. Recording pipettes were made from borosilicate glass (catalog number BF150-86-15, Sutter Instrument Co, Novato, CA) that was pulled and heat-polished to achieve a tip resistance of 3–5 megaohms when the electrode was filled with an extracellular solution containing (in mm): 4 KCl, 110 NaCl, 2 MgCl, 2 CaCl, 10 HEPES, pH 7.2. Bath (internal) solution contained(in mm): 120 KCl, 3 or 100 NaCl, 2 MgCl, 100 nm CaCl, 10 HEPES, pH 7.2. Currents were elicited by first applying a voltage step to +80 mV for 250 ms followed by a voltage ramp from +80 to −120 mV over 1 s. The step/ramp pulses were applied once every 3 s from a holding potential of −80 mV. Linear leak currents were leak-subtracted offline.
Data Analysis
Data acquisition and off-line analysis of currents were performed using pClamp 10.0 software (Molecular Devices). Figures were generated using Prism 6.0 software (Graph Pad). Data are presented as average ± S.E. (n = number of cells). Datasets were compared by Student's t test, and differences were considered significant at p < 0.05.
Results
Intracellular NaCl Activates Slo2.1 in Xenopus Oocytes
The open probability of Slo2.1 channels heterologously expressed in Xenopus oocytes is extremely low, and whole cell currents are difficult to record unless channels are activated by elevation of [Na+]i. We previously reported (18) that [Na+]i can be elevated by allowing the solution (2 m NaCl) used to fill low resistance microelectrodes to leak into the cell during TEVC. Activation of Slo2.1 by NaCl leaked from pipette tips could result from the effects of Na+ alone, Cl− alone, the combined effects of Na+ and Cl−, or a nonspecific effect resulting from cell swelling (19). To distinguish between these possibilities, we compared the ability of pipettes filled with 2 m solutions of NaCl, LiCl, or KCl to activate Slo2.1 channels. We first characterized the time-dependent changes in ionic current induced by loading oocytes with the three different salt solutions. Immediately after impalement of a cell with the two electrodes, the transmembrane potential was clamped to −80 mV, and 0.5-s voltage steps to 0 mV were applied repetitively once every 10 s. The peak amplitudes of outward current measured immediately after impalement (t = 0 min) and after 6 min of repetitive pulsing for representative oocytes clamped with pipettes containing NaCl, LiCl, or KCl are shown in Fig. 1A. The time course of NaCl loading-induced increase in current that developed over time for multiple cells is summarized in Fig. 1B. The peak response to NaCl was attained in ∼6 min. Longer recording times resulted in significant cell swelling and a slow onset of current decline due to pore block of outward current by the increasing [Na+]i (not shown). These findings indicate that in the absence of Na+, an increase in [Cl−]i is insufficient to activate Slo2.1 channels.
FIGURE 1.

WT Slo2.1 channels heterologously expressed in Xenopus oocytes are activated when impaled with micropipettes containing 2 m solutions of NaCl, but not KCl or LiCl. A, representative whole cell currents recorded from oocytes expressing WT Slo2.1 channels within the first minute after impalement of the oocyte with both electrodes (t = 0 min), and again after 6 min of repetitive pulsing (Loading). Currents were recorded using TEVC with the voltage pulse protocol shown in the upper left inset and microelectrodes filled with the indicated (NaCl, LiCl, or KCl) 2 m salt solution. Small arrows indicate zero current. B, time course of currents at 0 mV recorded from oocytes clamped with microelectrodes containing the indicated salt solutions (n = 4). Error bars indicate ± S.E. C, representative whole cell currents recorded over a range of Vt indicated in the upper left inset at the time of peak response to NaCl loading, and then again after additional activation by 1 mm NFA. D, normalized mean I-V relationships obtained immediately after microelectrode impalement (t = 0 min), after peak response to NaCl loading, and after the addition of 1 mm NFA (n = 7). Error bars indicate ± S.E. E, representative current traces after LiCl loading and after subsequent activation by 1 mm NFA. F, normalized mean I-V relationships obtained immediately after microelectrode impalement (t = 0 min at 0 mV only), after peak response to LiCl loading, and after the addition of 1 mm NFA (n = 4). Error bars indicate S.E. G, representative current traces after KCl loading and after subsequent activation by 1 mm NFA. H, normalized mean I-V relationships obtained immediately after microelectrode impalement (t = 0 min), after peak response to KCl loading, and after the addition of 1 mm NFA (n = 9). Error bars indicate ± S.E.
Slo2.1 channels can also be activated by fenamates such as niflumic acid (NFA) (15, 18, 20). Currents were measured over a wide range of voltages when NaCl loading-induced activation of ISlo2.1 in oocytes reached its peak effect (Fig. 1C, left panel), and again after further activation by the extracellular application of 1 mm NFA (Fig. 1C, right panel). The resulting I-V relationships are plotted in Fig. 1D and illustrate that the slope conductance was negative when Vt ≥ +20 mV (due to block of outward currents by the elevated [NaCl]i) and that NFA increased ISlo2.1 by a factor of 2.5 when compared with that achieved with NaCl loading alone. ISlo2.1 was not activated in oocytes loaded with LiCl, but currents were activated by the addition of 1 mm NFA to the extracellular solution, and the slope conductance was progressively reduced for Vt > +20 mV (Fig. 1E), presumably caused by block of outward currents by intracellular Li+. Loading of cells with KCl did not increase currents at any potential, and currents activated by 1 mm NFA exhibited outward rectification (Fig. 1H), indicating that elevated [K+]i did not block outward currents. Thus, when impaled with microelectrodes, leakage of NaCl, but not LiCl or KCl filling solutions into the cytoplasm of oocytes induces a submaximal activation of ISlo2.1.
Screen of Potential Na+ Binding Sites
In Kir3 and Slo2.2 channels, intracellular Na+ interacts with, and presumably binds to a conserved motif (DX(R/K)XXH) located in the RCK2 domain of the cytosolic C terminus of each of the four subunits in a complete channel. In Slo2.2, the motif is DNKPDH where Asp and His in positions 1 and 6 were shown to be the most important residues to confer sensitivity to intracellular Na+ (10). In the homologous position, Slo2.1 subunits have the sequence DNPPDM, where the first D is Asp757. In this sequence, the underlined residues are conserved between Slo2.1 and Slo2.2. Although not examined in the previous mutagenesis study, the Slo2.2 motif has an additional His in the 7 position (DNKPDHH), and this is conserved in the Slo2.1 sequence: DNPPDMH. Thus, Slo2.1 and Slo2.2 share five of the seven residues in common. We also searched for other sequences within the C terminus of So2.1 that had some similarity to the DNKPDHH motif in Slo2.2. Four additional sequences were selected for analysis. These sequences had in common with the Slo2.2 motif the initial Asp and either a Lys in position 3 or a His in position 6 or 7 (indicated by underlining), including 391DRTSSDH, 700DKSCQH, 982DTKDSK, and 1071DEMNDH (superscript numbers indicate the position of the initial Asp residue in the sequence).
To examine whether one or more of the putative Na+ coordination motifs has a role in sensing [Na+]i, the initial Asp residue in each sequence was mutated to Arg. The sensitivity to elevated [Na+]i of channels containing a single Asp to Arg substitution (or double Arg substitution for the 1071DEMNDH sequence) was determined using the I-V pulse protocol, where test potentials ranged from −140 to +80 mV. To reduce variability caused by different levels of channel expression, currents were recorded from the same batch of oocytes for each mutant channel type. ISlo2.1 recorded from an oocyte expressing WT channels immediately after impalement with microelectrodes filled with 2 m NaCl (Fig. 2A) was dramatically increased and reached a peak in 5 min (Fig. 2B). This experiment was repeated in multiple oocytes, and the average I-V relationship is plotted in Fig. 2C. Outward currents were maximal at +20 mV and declined at more positive potentials. In contrast, the I-V relationship for multiple uninjected oocytes (Fig. 2D) indicates a lack of response to elevated [NaCl]i in oocytes not expressing Slo2.1 channels. Four of the five mutant channels, including D391R, D700R, D982R, and the double mutant D1071R, E1072R were all activated by NaCl loading using 2 m NaCl recording electrodes (Fig. 2, E–H). In contrast, D757R Slo2.1 channel currents were not activated by elevated [NaCl]i (Fig. 3, A and B). To rule out the possibility that the Na+ insensitivity of D757R Slo2.1 channels was simply due to lack of functional channels in the plasma membrane, we show that ISlo2.1 was activated normally by extracellular application of 1 mm NFA (Fig. 3, C and D). The negative slope conductance of the I-V relationship at positive potentials (Fig. 3D) also confirms that these cells were loaded with NaCl.
FIGURE 2.
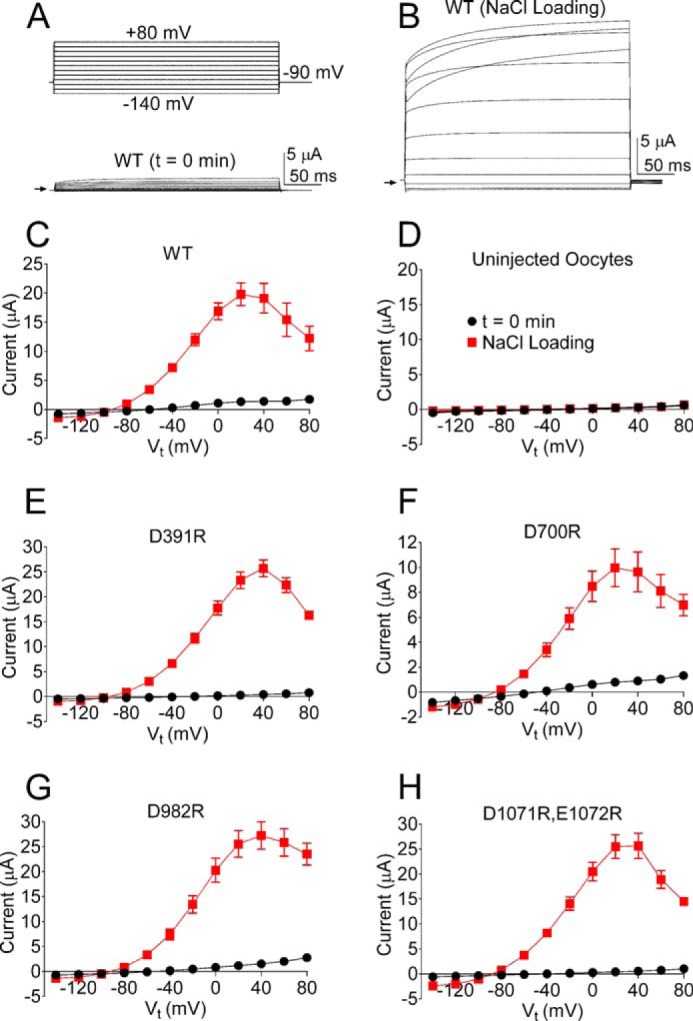
NaCl loading during TEVC recordings of Xenopus oocytes activates WT Slo2.1 and four of the mutant channels harboring charge reversing substitutions of an Asp in the C terminus. A, representative whole cell currents recorded from an oocyte immediately after impalement with microelectrodes. Voltage pulse protocol is indicated above the current trace. Arrow indicates zero current. B, currents recorded from the same oocyte as in panel A at the peak of the response to NaCl loading. C, mean I-V relationships for WT Slo2.1 channels (n = 8). D, mean I-V relationships for uninjected oocytes (n = 13). E–H, mean I-V relationships for D391R (n = 5), D700R (n = 8), D982R (n = 8), and D1071R,E1072R (n = 7) mutant Slo2.1 channels. Error bars indicate ± S.E. in panels C–H.
FIGURE 3.
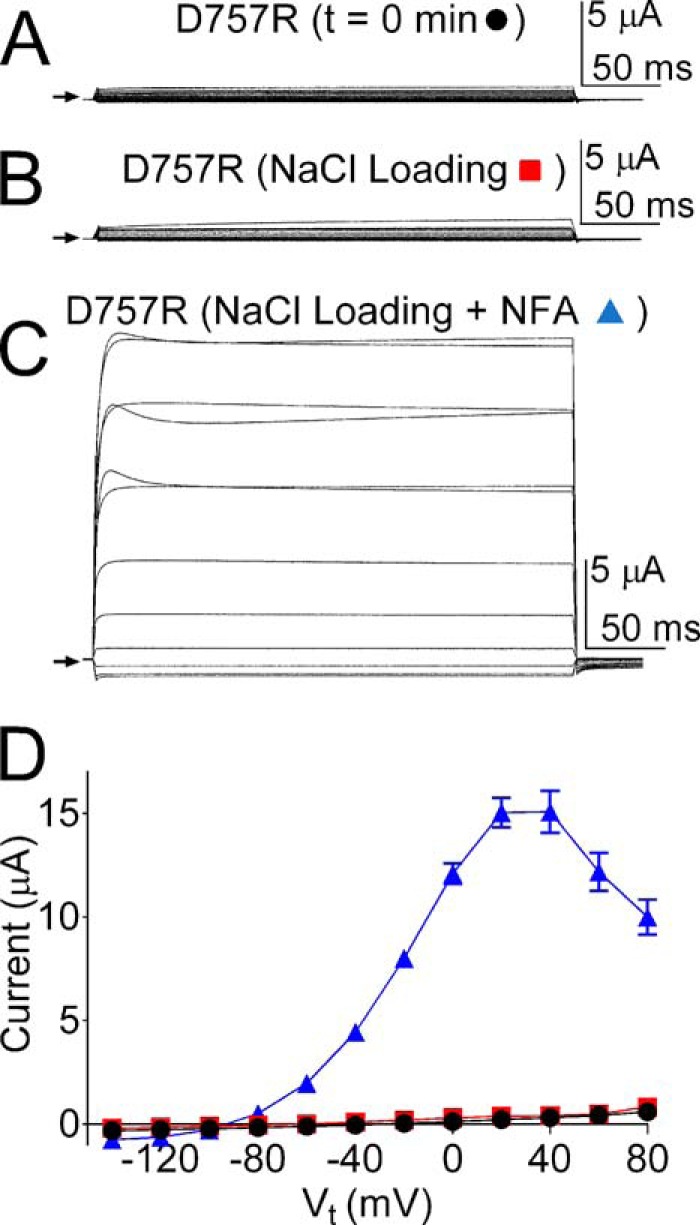
NaCl loading during TEVC recordings of Xenopus oocytes does not activates D757R Slo2.1 channels. A, representative whole cell currents recorded from an oocyte expressing D757R Slo2.1 channels immediately after impalement with microelectrodes (t = 0 min). The voltage protocol used was the same I-V protocol illustrated as an inset in Fig. 2A. Arrow indicates zero current. B and C, currents recorded from the same oocyte as in panel A after 10 min of NaCl loading (B) and after the addition of 1 mm NFA (C). D, mean I-V relationships for the currents at t = 0 min, after NaCl loading, and after the addition of 1 mm NFA (n = 8). Error bars indicate ± S.E.
D757R Slo2.1 Currents Are Not Activated by High [Na+]i in HEK293 Cells
Although NaCl loading of oocytes during TEVC recordings was able to activate robust ISlo2.1, the average and spatial variation of elevated [Na+]i achieved with this approach is unknown. We therefore performed whole cell patch clamp recordings from HEK293 cells that were transfected with WT Slo2.1/GFP, D757R Slo2.1/GFP, or GFP cDNA. Recording of currents was commenced immediately after rupturing of the membrane patch to obtain a basal level of current before significant diffusion into the cell of the pipette solution containing 70 mm NaCl. Cells were voltage-clamped at −70 mV and repetitively stepped to 0 mV for 250 ms every 3 s to monitor changes in current. ISlo2.1 in cells expressing WT Slo2.1 channels was increased ∼30-fold within 5 min of activation by Na+ (Fig. 4, A and B). ISlo2.1 was further increased by the addition of 0.5 mm NFA to the bathing solution to a level 150-fold larger than basal currents and 7-fold larger than the current activated by Na+ alone (Fig. 4A). In contrast, the current measured in cells expressing D757R Slo2.1 was unchanged after 8–10 min of recording with 70 mm NaCl in the pipette solution, and the subsequent addition of 1 mm NFA to the bath solution activated large currents, confirming the presences of functional Slo2.1 channels (Fig. 4, C and D). Control (GFP-transfected) cells showed no increase in current after 8–10 min of recording with 70 mm Na+ in the pipette or after the addition of 1 mm NFA (Fig. 4E). The average currents measured at 0 mV in multiple cells expressing WT Slo2.1/GFP, D757R Slo2.1/GFP, or GFP alone are summarized in Fig. 4F.
FIGURE 4.
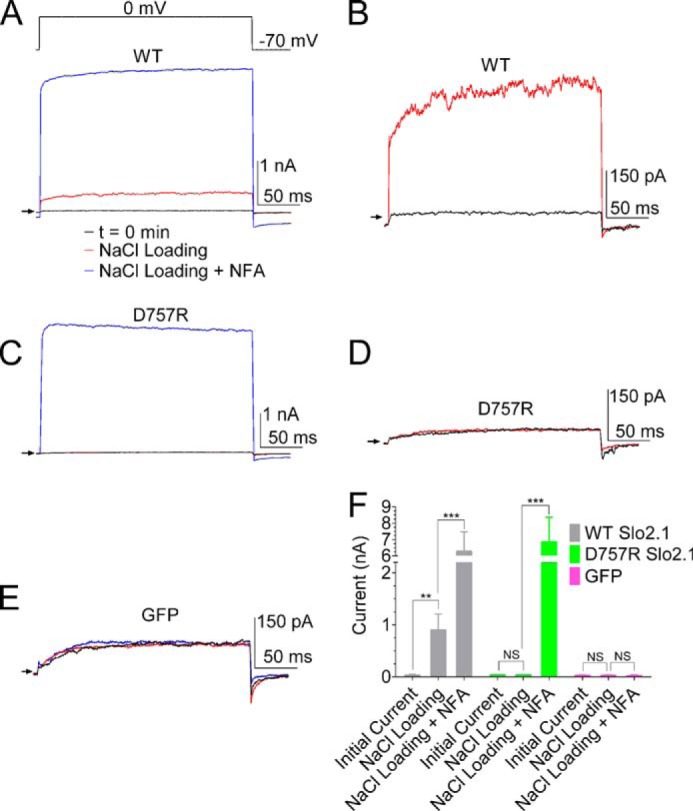
Elevated [Na+]i activates WT but not D757R Slo2.1 channels in whole cell patch-clamped HEK293 cells. A, currents recorded in a single cell immediately after initiation of whole cell patch clamp configuration (t = 0 min, black trace), after 5 min of recording (red trace), and after bath application of 0.5 mm NFA (blue trace). The patch pipette contained 70 mm NaCl. The voltage protocol used is shown above the current trace. Arrow indicates zero current. B, black and red traces from panel A plotted at higher gain. C, D757R Slo2.1 channel currents with color coding as in panel A. [NFA] was 1 mm. D, black and red traces from panel C plotted at higher gain. E, currents from a cell transfected with GFP. Color coding of traces is as in panel A. [NFA] was 0.5 mm. F, mean currents recorded at 0 mV for cells transfected with WT Slo2.1/GFP, D757R Slo2.1/GFP, and GFP alone. Average peak currents were as follows: for WT Slo2.1, initial current 0.04 ± 0.01 nA, after NaCl loading 0.91 ± 0.3 nA, after NFA 6.28 ± 1.20 nA (n = 10); for D757R Slo2.1, initial current 0.04 ± 0.01 nA, after NaCl loading 0.03 ± 0.01 nA, and after NFA application 6.85 ± 1.50 nA (n = 9); for GFP alone, initial current 0.03 ± 0.01 nA, after NaCl loading 0.03 ± 0.01 nA, and after NFA application 0.02 ± 0.01 nA (n = 8). **, p < 0.01, ***, p < 0.001. NS, not significant. Error bars indicate ± S.E.
Slo2.1 Currents Recorded from Inside-out Macropatches of HEK293 Cells
The response of Slo2.1 channels to elevated [NaCl]i was also assessed by measuring currents in excised inside-out macropatches. The cytoplasmic side of a membrane patch pulled from the cells was first exposed to a bathing solution containing 3 mm NaCl. Currents were recorded in response to a 250-ms step to +80 mV that was followed by a 1-s ramp to −120 mV (Fig. 5A, inset). As expected, in cells transfected with WT Slo2.1 cDNA, this voltage clamp protocol only elicited a very small leak current. The recording chamber was then perfused with a bathing solution containing a high concentration (100 mm) of NaCl, and currents were again measured with the voltage ramp protocol. The response to the change in [NaCl]i varied considerably between different macropatches. In 12 out of 19 patches, increasing [NaCl]i from 3 to 100 mm had little or no discernible effect on currents during the voltage ramp. For these patches, the peak outward current measured during the voltage ramp was 0.6 ± 0.6 pA for 3 mm Na+ and 1.4 ± 0.7 pA for 100 mm NaCl (n = 12). However, the addition of 3 mm NFA in the continued presence of 100 mm NaCl increased peak current to 719 ± 214 pA in this set of macropatch recordings. The robust response to NFA indicated that these macropatches contained functional Slo2.1 channels. In 7 out of the 19 patches, elevation of [NaCl]i gave the expected increase in current magnitude, and 3 mm NFA enhanced the current even further (Fig. 5A). In these macropatches, average peak outward currents were increased from 1.2 ± 0.3 pA, to 35.5 ± 12.2 pA, by 100 mm NaCl, and were increased another 14-fold, to 490 ± 98 pA by 3 mm NFA (Fig. 5B). As observed for Slo2.1 channels expressed in oocytes, ISlo2.1 activated by elevated [NaCl]i in HEK293FT cells was progressively reduced at potentials between +25 and +80 mV due to voltage-dependent pore block by the high [Na+]i. For all 19 of the macropatches containing D757R Slo2.1 channels, increasing [NaCl]i from 3 to 100 mm NaCl had no effect, whereas ISlo2.1 was strongly increased by 3 mm NFA. An example of one of these macropatch recordings is presented in Fig. 5C, and the average peak outward currents were 1.2 ± 0.5 pA for 3 mm NaCl, 1.3 ± 0.5 pA for 100 mm NaCl, and 973 ± 370 pA for 100 mm NaCl plus 3 mm NFA (Fig. 5D, n = 19). Cells transfected with GFP alone did not respond to either 100 mm NaCl or 3 mm NFA (Fig. 5E). The finding that D757R channels are insensitive to elevated [NaCl]i indicates that Asp757 is the key structural determinant of intracellular Na+ sensing in Slo2.1 channels. At a concentration of 3 mm, NFA induces near maximal activation of ISlo2.1 in excised membrane macropatches (Fig. 5F). Assuming an approximate EC50 of 90 mm for intracellular Na+-mediated activation ISlo2.1 (9), the peak current response to NFA was approximately seven times greater than the estimated peak response to Na+.
FIGURE 5.
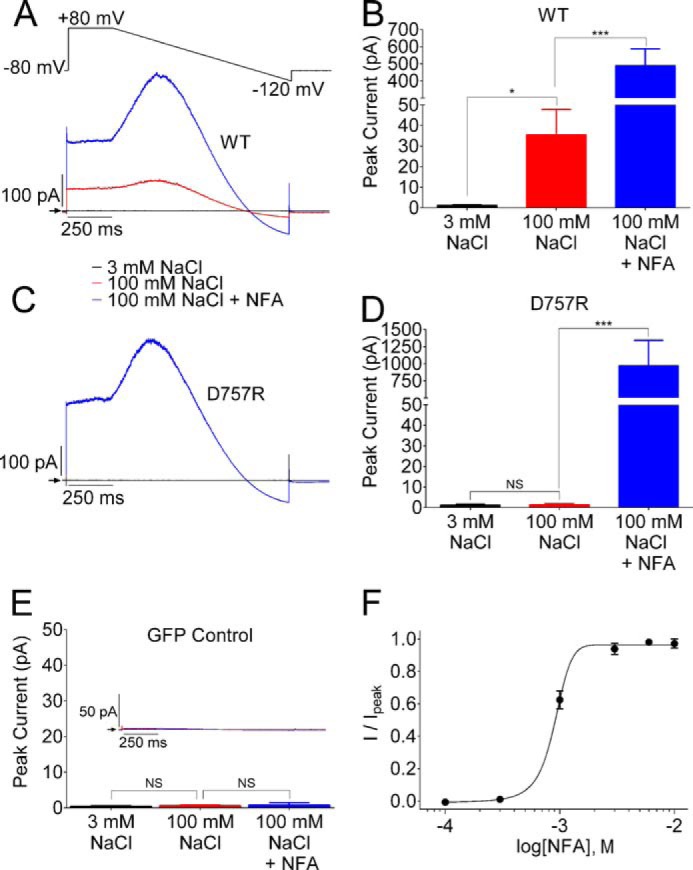
Elevated [Na+]i activates WT but not D757R Slo2.1 channels in inside-out macropatches of HEK293 cells. A, representative currents recorded from an inside-out macropatch of a cell expressing WT Slo2.1 channels. The voltage ramp protocol used to record currents is shown above the current traces. Currents were recorded with a bath solution containing 3 mm NaCl (black trace), 100 mm NaCl (red trace), and 3 mm NFA in the continued presence of 100 mm NaCl (blue trace). All current traces are averages of 8–15 sweeps. B, mean peak currents recorded at +25 mV during the voltage ramp for cells expressing WT Slo2.1 channels. Currents (average ± S.E.) for 3 mm NaCl were 1.2 ± 0.3 pA, currents for 100 mm NaCl were 35.5 ± 12.2 pA, and currents for 100 mm NaCl + 3 mm NFA were 490 ± 98 pA (n = 7). C, inside-out macropatch currents recorded from a cell expressing D757R Slo2.1 channels. Color coding of traces is as in panel A. D, currents (average ± S.E.) for 3 mm NaCl were 1.2 ± 0.5 pA, currents for 100 mm NaCl were 1.3 ± 0.5 pA, and currents for 100 mm NaCl + 3 mm NFA were 973 ± 370 pA (n = 19). NS, not significant. E, upper, inset traces are inside-out macropatch currents recorded from a cell expressing GFP alone. Bar graph: currents (average ± S.E.) for 3 mm NaCl were 0.4 ± 0.3 pA; for 100 mm NaCl, currents were 0.6 ± 0.2 pA; and for 100 mm NaCl + 3 mm NFA, currents were 0.8 ± 0.6 pA (n = 5). *, p < 0.05, ***, p < 0.001, when compared with 3 mm NaCl. F, concentration-response relationship for NFA activation of WT ISlo2.1 from inside-out macropatch recordings (n = 3). Data were fitted with a logistic equation to estimate EC50 (0.91 mm) and Hill coefficient (3.4). Error bars indicate ± S.E.
Discussion
The intracellular Na+ binding motif of Kir3.2, Kir3.4, Kir5.1, and Slo2.2 channel subunits is DX(R/K)XXH. In rat Slo2.2 channels, this motif is located in RCK2 of the C terminus, and mutation of the initial acidic residue to Arg (D818R) increased the EC50 for channel activation by intracellular Na+ by 13-fold, from 67 to 866 mm (10). Based on sequence alignment, the equivalent residue in the RCK2 domain of Slo2.1 is Asp757. We found that the D757R mutation abolished the response of Slo2.1 channels to 70 mm intracellular NaCl in whole cell recordings and to 100 mm NaCl in inside-out macropatch recordings. In this study, we did not evaluate the effect of [Na+]i >100 mm on mutant channels because higher levels would not be encountered under normal or pathophysiological conditions in a live cell.
Asp818 in rat Slo2.2 is the first residue in the sequence 818DNKPDHH824. Asp757 in human Slo2.1 is the first residue in the sequence 757DNPPDMH763. Unlike the intracellular Na+ binding motif DX(R/K)XXH of the several Kir and Slo2.2 channel subunits, the Slo2.1 sequence does not contain a basic residue in the third position, and the His residue is in position 7 rather than position 6. The role of the single His residue in the intracellular Na+ binding motif of Kir3.1 channels was investigated. In these channels, the Asp and Arg form a salt bridge in the absence of Na+. In the presence of Na+, the salt bridge is interrupted, and the Arg residue is then free to interact with phosphatidylinositol 4,5-bisphosphate, whereas the Asp and His contribute to the coordination site for Na+ (13). In rat Slo2.2, mutation of Lys820 to Ala did not alter the ability of Na+ to activate the channel (10). Thus, the basic residue in the DXRXXH motif does not affect Na+ binding, and presumably, its absence in the Slo2.1 motif is unimportant. In addition, mutation of Asp822 in rat Slo2.2 did not affect Na+ sensitivity of the channel, indicating that the second acidic residue in this motif is not an important component of the Na+ binding site.
In 12 of the 19 inside-out macropatch recordings of WT Slo2.1 channels, we found that elevating [NaCl]i from 3 to 100 mm did not increase ISlo2.1. Moreover, in a previous study, we found that ISlo2.1 recorded from inside-out patches and activated by NFA exhibited a gradual decrease (“run-down”) that could be slowed by including phosphatidylinositol 4,5-bisphosphate in the intracellular solution (21). Run-down of KNa channel activity with a variable time course, but sometimes in less than 1 min, was reported to occur in excised membrane patches of rat olfactory bulb neurons and attributed to loss of an unknown diffusible substance (22). Run-down has not been described for Slo2.2 channels (23) nor for single KNa channel activity recorded from isolated cardiomyocytes (1). Current run-down, and in some patches, the complete absence of response to elevated [NaCl]i makes it extremely difficult to accurately determine a [Na+]i-response relationship. Thus, the previously determined EC50 values for Slo2.1 (89 mm) may be overestimated (9).
It was previously reported that Slo2 channels can be activated by elevating [Cl−]i (9). For example, single channel open probability was increased 2- and 5-fold for Slo2.2 and Slo2.1 respectively, when [Cl−]i was elevated from 3 to 130 mm (with [Na+]i constant at 5 mm) (9). In our TEVC experiments, ISlo2.1 was readily activated when cells were impaled with microelectrodes filled with NaCl, but not microelectrodes filled with LiCl or KCl. This finding is similar to previous findings where 1 m concentrations of CsCl, NH4Cl, or RbCl did not activate Slo2.2 in inside-out patches of HEK293 cells (10). Initial studies indicated that Slo2.2 channels (8) and native KNa channels (24) were not activated by Li+. However, later studies indicate that Li+ is just less sensitive than Na+. For example, Slo2.2 channels are activated by Li+ with a K½ of 294 mm, about six times less effective than Na+ (K½ = 54 mm) (23). We did not observe activation of ISlo2.1 with LiCl micropipettes, but this was probably because [LiCl]i did not reach high enough levels. Together, these finding indicate that Cl− alone cannot activate Slo2.1 channels, but it is unclear whether Cl− modifies the response to Na+. For Slo2.2, Cl− can only activate channels when in the presence of Na+ (8). In Caenorhabditis elegans, intracellular Cl− and Ca2+ act synergistically to activate Slo-2 channels, and mutation of multiple basic residues to Asn or Gln in the putative “chloride bowl,” a C-terminal domain containing multiple basic residues, reduces sensitivity to both ions (25).
It is unclear exactly how interaction of Na+ with Asp757 in the C-terminal of Slo2.1 results in activation of the channel gate, believed to be at the selectivity filter (18). The C-terminal regions of Slo channel subunits each contain an RCK1 domain paired with an RCK2 domain via a flexible linker. The RCK1 domain from one subunit interacts with an RCK2 domain of an adjacent subunit, and together all eight RCK domains form a structure called the gating ring. In Slo1, a single Ca2+ ion binds to the “Ca2+ bowl,” a looped structure (amino acid sequence QFLDQDDDD) that is located in each RCK2 domain at the interface with the RCK1 domain of an adjacent subunit (26). Presumably, coordination of Ca2+ at these sites causes a rearrangement of the gating ring that is transmitted via the C-linker to S6 and the selectivity filter, which together with membrane depolarization increases the open probability of the Slo1 channel. Slo2.1 channels do not have a functional voltage sensor (15) and are gated by intracellular Na+ with only minimal voltage dependence. Homotetrameric Slo2 channels have four identical putative Na+ binding sites, one in each C-terminal domain, and the Hill coefficient for Na+ activation of Slo2.2 is 4 (10), implying strong cooperative interactions between subunits mediate Na+-dependent activation of the channel.
The putative Na+ binding site in Slo2 channels is located in a different region of the RCK2 domain than the Ca2+ bowl of Slo1. The amino acid sequences of a portion of the RCK2 domain for the four known human Slo channels are aligned in Fig. 6A. Inspection of these sequences indicates that Slo1 (Ca2+-sensitive) and Slo3 (pH-sensitive) are more homologous to one another than to either of the Na+-sensitive Slo2 channels. In Slo1 and Slo3, a Ser residue is located in the position equivalent to Asp757 in human Slo2.1 and Asp839 in human Slo2.2. The location of this Ser as well as the Ca2+ bowl in the RCK2 is illustrated in Fig. 6B for a single Slo1 subunit. The Ca2+ ion is located at a distance of ∼30 Å from Ser759 (equivalent to Asp757 in Slo2.1). In Slo1, Ca2+ binds to a site that faces the outer perimeter of the gating ring (26). The equivalent sites in the tetrameric gating ring structure of Slo3 are shown in Fig. 6C, where it can also be seen that Ser756 residues (equivalent to Asp757 in Slo2.1) are located at the inner perimeter of the gating ring, ∼20 Å from one another. A side view of two adjacent subunits of the gating ring structure of Slo3 (Fig. 6D) provides a complete picture of the relative locations of the Ca2+ and Na+ binding sites in Slo channels. Thus, although the putative binding sites for Ca2+ (Slo1) and Na+ (Slo2.1) in Slo channels do not overlap, both ion binding sites are located at the interface of the RCK2 domain of one subunit and the RCK1 domain of an adjacent subunit. Future studies are needed to determine how the binding of Na+ to the inner perimeter of the gating ring structure leads to opening of Slo2 channels.
FIGURE 6.

Structural models of the Slo1 C-terminal domain and the gating ring of the Slo3 channel mapping the location of residues located in the position of Asp757 of Slo2.1. A, sequence alignment of a portion of the RCK2 domains from human Slo1, Slo3, Slo2.2, and Slo2.1 channels. The location of specific α-helices and β-sheets determined from crystal structures of the C-terminal domains of human Slo1 (hSlo1) (26) and human Slo3 (hSlo3) (27) are indicated above the sequences. Amino acid numbers are indicated to the right of each sequence. B, structure of the C-terminal domain of human Slo1 channel. RCK1 structure (Protein Data Bank (PDB) ID code 3MT5) is colored blue, and RCK2 structure is colored red. A Ca2+ ion (yellow sphere) is shown bound to the calcium bowl, coordinated by the side chains of Asp895 (colored yellow) and Asp897 (colored green). The N-terminal residue (Lys343) that connects to the C-linker is shown as cyan balls. Ser759 (orange balls) is in a position corresponding to Asp757 in Slo2.1. C, human Slo3 gating ring structure (PDB ID code 4HPF) viewed from the top, down the four-fold axis. Each C-terminal domain is colored differently, and each highlights the location of Ser756 (red balls, corresponding to Asp757 in Slo2.1), Ser883 (yellow balls), and Glu881 (green balls) that correspond to the Ca2+ bowl residues Asp895 and Asp897 of Slo1, and the N-terminal residue Leu331 (cyan balls) that connects RCK1 to the C-linker. D, side view of two of the C-terminal domains of Slo3 with residue highlights as described in panel C. In panels B–D, small spheres indicate regions of disordered structure.
This work was supported by National Institutes of Health NHLBI Grant R01 HL103877 (to M. C. S.).
- KNa
- Na+-activated K+
- ISlo2.1
- Slo2.1 current
- NFA
- niflumic acid
- RCK2
- regulators of conductance of K+ 2
- TEVC
- two-electrode voltage clamp
- Vt
- test voltage.
References
- 1. Kameyama M., Kakei M., Sato R. (1984) Intracellular Na+ activates a K+ channel in mammalian cardiac cells. Nature 309, 354–356 [DOI] [PubMed] [Google Scholar]
- 2. Bader C. R., Bernheim L., Bertrand D. (1985) Sodium-activated potassium current in cultured avian neurones. Nature 317, 540–542 [DOI] [PubMed] [Google Scholar]
- 3. Murphy E., Eisner D. A. (2009) Regulation of intracellular and mitochondrial sodium in health and disease. Circ. Res. 104, 292–303 [DOI] [PMC free article] [PubMed] [Google Scholar]
- 4. Wendt-Gallitelli M. F., Voigt T., Isenberg G. (1993) Microheterogeneity of subsarcolemmal sodium gradients: electron probe microanalysis in guinea-pig ventricular myocytes. J. Physiol. 472, 33–44 [DOI] [PMC free article] [PubMed] [Google Scholar]
- 5. Pike M. M., Kitakaze M., Marban E. (1990) 23Na-NMR measurements of intracellular sodium in intact perfused ferret hearts during ischemia and reperfusion. Am. J. Physiol. 259, H1767–H1773 [DOI] [PubMed] [Google Scholar]
- 6. Anderson S. E., Dickinson C. Z., Liu H., Cala P. M. (1996) Effects of Na-K-2Cl cotransport inhibition on myocardial Na and Ca during ischemia and reperfusion. Am. J. Physiol. 270, C608-C618 [DOI] [PubMed] [Google Scholar]
- 7. Budelli G., Hage T. A., Wei A., Rojas P., Jong Y. J., O'Malley K., Salkoff L. (2009) Na+-activated K+ channels express a large delayed outward current in neurons during normal physiology. Nat. Neurosci. 12, 745–750 [DOI] [PMC free article] [PubMed] [Google Scholar]
- 8. Yuan A., Santi C. M., Wei A., Wang Z. W., Pollak K., Nonet M., Kaczmarek L., Crowder C. M., Salkoff L. (2003) The sodium-activated potassium channel is encoded by a member of the Slo gene family. Neuron 37, 765–773 [DOI] [PubMed] [Google Scholar]
- 9. Bhattacharjee A., Joiner W. J., Wu M., Yang Y., Sigworth F. J., Kaczmarek L. K. (2003) Slick (Slo2.1), a rapidly-gating sodium-activated potassium channel inhibited by ATP. J. Neurosci. 23, 11681–11691 [DOI] [PMC free article] [PubMed] [Google Scholar]
- 10. Zhang Z., Rosenhouse-Dantsker A., Tang Q. Y., Noskov S., Logothetis D. E. (2010) The RCK2 domain uses a coordination site present in Kir channels to confer sodium sensitivity to Slo2.2 channels. J. Neurosci. 30, 7554–7562 [DOI] [PMC free article] [PubMed] [Google Scholar]
- 11. Ho I. H., Murrell-Lagnado R. D. (1999) Molecular determinants for sodium-dependent activation of G protein-gated K+ channels. J. Biol. Chem. 274, 8639–8648 [DOI] [PubMed] [Google Scholar]
- 12. Zhang H., He C., Yan X., Mirshahi T., Logothetis D. E. (1999) Activation of inwardly rectifying K+ channels by distinct PtdIns(4,5)P2 interactions. Nature Cell Biol. 1, 183–188 [DOI] [PubMed] [Google Scholar]
- 13. Rosenhouse-Dantsker A., Sui J. L., Zhao Q., Rusinova R., Rodríguez-Menchaca A. A., Zhang Z., Logothetis D. E. (2008) A sodium-mediated structural switch that controls the sensitivity of Kir channels to PtdIns(4,5)P2. Nat. Chem. Biol. 4, 624–631 [DOI] [PMC free article] [PubMed] [Google Scholar]
- 14. Thomson S. J., Hansen A., Sanguinetti M. C. (2014) Concerted all-or-none subunit interactions mediate slow deactivation of human ether-a-go-go-related gene K+ channels. J. Biol. Chem. 289, 23428–23436 [DOI] [PMC free article] [PubMed] [Google Scholar] [Retracted]
- 15. Dai L., Garg V., Sanguinetti M. C. (2010) Activation of Slo2.1 channels by niflumic acid. J. Gen Physiol. 135, 275–295 [DOI] [PMC free article] [PubMed] [Google Scholar]
- 16. Stühmer W. (1992) Electrophysiological recording from Xenopus oocytes. Methods Enzymol. 207, 319–339 [DOI] [PubMed] [Google Scholar]
- 17. Schreibmayer W., Lester H. A., Dascal N. (1994) Voltage clamping of Xenopus laevis oocytes utilizing agarose-cushion electrodes. Pflugers Arch. 426, 453–458 [DOI] [PubMed] [Google Scholar]
- 18. Garg P., Gardner A., Garg V., Sanguinetti M. C. (2013) Structural basis of ion permeation gating in Slo2.1 K+ channels. J. Gen Physiol. 142, 523–542 [DOI] [PMC free article] [PubMed] [Google Scholar]
- 19. Tejada M. A., Stople K., Hammami Bomholtz S., Meinild A. K., Poulsen A. N., Klaerke D. A. (2014). Cell volume changes regulate Slick (Slo2.1), but not Slack (Slo2.2) K+ channels. PLoS ONE 9, e110833. [DOI] [PMC free article] [PubMed] [Google Scholar]
- 20. Garg P., Sanguinetti M. C. (2012) Structure-activity relationship of fenamates as Slo2.1 channel activators. Mol. Pharmacol. 82, 795–802 [DOI] [PMC free article] [PubMed] [Google Scholar]
- 21. Garg P., Sanguinetti M. C. (2014) Intracellular ATP does not inhibit Slo2.1 K+ channels. Physiol. Rep. 2, e12118. [DOI] [PMC free article] [PubMed] [Google Scholar]
- 22. Egan T. M., Dagan D., Kupper J., Levitan I. B. (1992) Properties and rundown of sodium-activated potassium channels in rat olfactory bulb neurons. J. Neurosci. 12, 1964–1976 [DOI] [PMC free article] [PubMed] [Google Scholar]
- 23. Yan Y., Yang Y., Bian S., Sigworth F. J. (2012) Expression, purification and functional reconstitution of slack sodium-activated potassium channels. J. Membr. Biol. 245, 667–674 [DOI] [PMC free article] [PubMed] [Google Scholar]
- 24. Dryer S. E. (1994) Na+-activated K+ channels: a new family of large-conductance ion channels. Trends Neurosci. 17, 155–160 [DOI] [PubMed] [Google Scholar]
- 25. Yuan A., Dourado M., Butler A., Walton N., Wei A., Salkoff L. (2000) SLO-2, a K+ channel with an unusual Cl− dependence. Nat. Neurosci. 3, 771–779 [DOI] [PubMed] [Google Scholar]
- 26. Yuan P., Leonetti M. D., Pico A. R., Hsiung Y., MacKinnon R. (2010) Structure of the human BK channel Ca2+-activation apparatus at 3.0 Å resolution. Science 329, 182–186 [DOI] [PMC free article] [PubMed] [Google Scholar]
- 27. Leonetti M. D., Yuan P., Hsiung Y., Mackinnon R. (2012) Functional and structural analysis of the human SLO3 pH- and voltage-gated K+ channel. Proc. Natl. Acad. Sci. U.S.A. 109, 19274–19279 [DOI] [PMC free article] [PubMed] [Google Scholar]