

Background: The role of myeloid cells in maintaining lean adipose tissue homeostasis is unclear.
Results: Adipose tissue dendritic cells suppress normal adipose tissue expansion by secreting fibronectin and matrix metalloproteinase 12.
Conclusion: Adipose tissue dendritic cells participate in maintaining normal adipose tissue homeostasis by preventing uncontrolled adipose tissue expansion.
Significance: Under normal physiology, dendritic cells participate in adipose tissue development.
Keywords: mice, GM-CSF, dendritic cells, adipose tissue
Abstract
The physiological roles of macrophages and dendritic cells (DCs) in lean white adipose tissue homeostasis have received little attention. Because DCs are generated from bone marrow progenitors in the presence of granulocyte/macrophage colony-stimulating factor (GM-CSF), we used GM-CSF-deficient (Csf2−/−) mice fed a low fat diet to test the hypothesis that adipose tissue DCs regulate the development of adipose tissue. At 4 weeks of age, Csf2−/− mice had 75% fewer CD45+Cd11b+Cd11c+MHCII+ F4/80− DCs in white adipose tissue than did wild-type controls. Furthermore, the Csf2−/− mice showed a 30% increase in whole body adiposity, which persisted to adulthood. Adipocytes from Csf2−/− mice were 50% larger by volume and contained higher levels of adipogenesis gene transcripts, indicating enhanced adipocyte differentiation. In contrast, adipogenesis/adipocyte lipid accumulation was inhibited when preadipocytes were co-cultured with CD45+Cd11b+Cd11c+MHCII+F4/80− DCs. Medium conditioned by DCs, but not by macrophages, also inhibited adipocyte lipid accumulation. Proteomic analysis revealed that matrix metalloproteinase 12 and fibronectin 1 were greatly enriched in the medium conditioned by DCs compared with that conditioned by macrophages. Silencing fibronectin or genetic deletion of matrix metalloproteinase 12 in DCs partially reversed the inhibition of adipocyte lipid accumulation. Our observations indicate that DCs residing in adipose tissue play a critical role in suppressing normal adipose tissue expansion.
Introduction
In addition to adipocytes, white adipose tissue contains the stromal vascular fraction (SVF),2 which includes vascular endothelial cells, fibroblasts, and several types of immune cells. Adipogenesis, the formation of new adipocytes from preadipocytes, is believed to be orchestrated by all of these cell types (1). However, adipogenesis must be closely regulated because both expansion (obesity) and shrinkage (lypodystrophy) associate with an array of metabolic consequences, such as diabetes, cardiovascular disease, and immunosuppression.
Adipogenesis is the continuous process of formation of new adipocytes from precursor cells responsible for maintaining a healthy adipose tissue. Impaired adipogenesis is associated with the pathogenesis of obesity-associated conditions, such as insulin resistance, hyperlipidemia, and type 2 diabetes (2–5). One of many factors controlling adipogenesis is Pref-1 (preadipocyte factor-1), which is highly expressed in preadipocytes and maintains these cells in an undifferentiated state during development (6). Pref-1 inhibits adipocyte differentiation through preventing down-regulation of SOX9 and the associated activation of SCD-1 (stearoyl-CoA desaturase-1) and FABP4 (fatty acid binding protein-4), leading to triacylglycerol accumulation (7, 8). In this study, we measured expression of Pref-1 and its downstream mediators as well as triacylglycerol accumulation to assess adipocyte differentiation and adipogenesis.
Non-lymphoid dendritic cells (DCs), a heterogeneous collection of cells derived from bone marrow, localize in most tissues in the steady state condition to help maintain tissue homeostasis (9, 10). Phenotypically, DCs express the hematopoietic marker CD45 and the integrin CD11c, and they constitutively express major histocompatibility complex class II (MHCII) (11).
DC maturation is stimulated by granulocyte/macrophage colony-stimulating factor (GM-CSF), which is produced by various cell types (12, 13). Consistently, in vitro GM-CSF prompts bone marrow cells to generate bone marrow-derived DCs (BM-DCs) (14, 15). GM-CSF-induced BM-DCs express CD11b, CD11c, and MHCII at higher levels than bone marrow-derived macrophages (BM-DMs; also found in white adipose tissue), both at the plasma membrane (16) and the mRNA level (17). Furthermore, mice lacking GM-CSF (Csf2−/− mice) have fewer CD11c+ cells in their atherosclerotic plaques, indicating that GM-CSF modulates tissue levels of CD11c+ cells in vivo (18).
In this study, we focus on the interaction between DCs and preadipocytes in adipose tissue and interrogate the involvement of GM-CSF-dependent DCs in adipose tissue homeostasis under steady state physiology.
Experimental Procedures
Mice
All studies were approved by the Animal Care and Use Committee of the University of Washington. Control (Csf2+/+) and Csf2−/− mice (kind gift from Randy Seeley), both on a C57BL/6 background for more than 10 generations, were housed (3–5 mice/cage) in a specific pathogen-free barrier facility in a temperature-controlled room (22 °C) with a 12-h light/dark cycle and given free access to food and water. The mice were fed a low fat diet (Wayne Rodent BLOX 8604, Harlan Teklad Laboratory, Madison, WI) and were analyzed at 4, 15, and 25 weeks of age. Before necropsy, they were fasted for 4 h in the morning, bled from the retro-orbital sinus into tubes containing 1 mm EDTA, and killed by isofluorane inhalation. Tissues were collected and stored at −80 °C until analysis. Whole or remaining epididymal adipose depots were isolated and digested immediately for flow cytometry experiments.
Body Composition Analysis
The body fat content of immobilized male mice, 4 or 25 weeks of age, was determined by the Rodent Energy Metabolism and Body Composition Core (Nutrition Obesity Research Center, University of Washington). Adipose tissue mass was estimated by magnetic resonance spectroscopy (Echo Medical Systems, Houston, TX) from the area under the curve of the lipid peak at 200.1 MHz (19).
Insulin and Glucose Tolerance Testing
Insulin and glucose tolerance tests were performed after a 4-h fast. Mice were injected intraperitoneally with human insulin (1.0 unit/kg body weight; Lilly) or glucose (1 mg/g body weight) (20).
Body Composition, Food Intake, Locomotor Activity, and Indirect Calorimetry
Age- and sex-matched mice of each strain (5 mice/strain) were individually housed and acclimated to metabolic cages for 7 days. Food intake, physical activity, and calorimetric measurements were continuously recorded over a 24-h period during which food was available ad libitum.
Locomotor activity was assessed by the infrared beam break method, using an Opto-Varimetrix-3 sensor system, whereas food and water intake were measured with the Feed Scale System (Columbus Instruments, Columbus, OH). Rates of oxygen consumption (VO2) and carbon dioxide production (VCO2) were calculated, respectively, as the difference in air content between in-flow (room air) and out-flow (animals' expired air), with the known flow rate of ambient air. The rates were normalized to lean body mass (ml/kg lean mass/h). The respiratory quotient (RQ) was calculated as the ratio of CO2 production (liters/min) over O2 consumption (liters/min). Heat production (kcal/h) was presented as a surrogate for total energy expenditure; it was calculated using the standard Lusk formula (TEE (kcal/h) = 3.815 + 1.232 × RQ) × VO2 (liters/min)) (21, 22). Respirometric parameters for each mouse were measured for 2 min and recorded at 20-min intervals. After each batch of four mice, ambient air (used as reference air) was measured for 2 min.
Plasma Glucose, Insulin, and Lipid Measurements
Food was withheld from mice for 16 h before blood was collected from the retro-orbital plexus into tubes containing EDTA. Then fasting glucose levels were measured. At the time of sacrifice, blood was collected after a 4-h fast, and insulin, triglyceride, and cholesterol levels were determined, using an ultrasensitive insulin ELISA (Linco, Billerica, MA), L-type TG M assay (Wako Diagnostics), and Amplex Red cholesterol assay kit (Invitrogen).
Tissue Triacylglycerol (TG) and Glycogen Measurements
Equal portions of liver (0.3 mg) and the entire hind limb femoris muscles were homogenized in either water (glycogen) or phosphate-buffered saline (triglycerides). Glycogen was measured with a colorimetric glycogen assay kit (Abcam ab65620) per the manufacturer's guidelines. After lipid was extracted by the chloroform-free lipid extraction method (STA-612, Cell Biolabs, Inc.), total triglycerides were measured, using the same assay as for the plasma samples.
Adipose Tissue Fractionation
Under sterile conditions, adipose tissue was extracted and separated into stromal vascular cell and adipocyte fractions (23). Minced tissue in digestion buffer (Dulbecco's PBS supplemented by calcium and magnesium, Thermo Scientific) was incubated with 2 mg/ml type I collagenase (Worthington) for 45 min at 37 °C on an orbital shaker, filtered through 250-μm nylon mesh, and centrifuged at 500 × g for 5 min. The pellet was resuspended in erythrocyte lysis buffer (Cell Signaling), incubated at room temperature for 5 min, and then filtered through a 70-μm nylon mesh and washed by centrifugation as above.
Quantitative Real-time PCR
Total RNA was extracted from frozen adipose tissue (100 mg), using acid-phenol reagent (Qiazol; Qiagen) and the RNeasy lipid tissue minikit (Qiagen, CA). All PCRs used SYBR Green, and mRNA was quantified using the ΔΔCt method (24) with 18S and L32 ribosomal RNA as controls. The primers/probes were ordered from PrimerBank. An RT2-Profiler PCR array for mouse extracellular matrix and adhesion molecules (PAMM-013Z, Qiagen) was used to quantify relative mRNA levels in adipose tissue (25). Data were analyzed by software on the SABiosciences Web site.
Immunohistochemical and Morphometric Analyses
Adipose tissue was fixed in 10% buffered formalin overnight, dehydrated, and embedded in paraffin at 60 °C. The sections were counterstained with hematoxylin. Adipocyte area was determined from three high power (×200) fields/animal (7 mice/group), using a digital imaging system (ImagePro Plus, Media Cybernetics, Bethesda, MD).
Nuclei Counts
Two slides per mouse (n = 3 mice/genotype) were scanned in bright field at ×20 magnification, using the Hamamatsu NanoZoomer Digital Pathology System. The digital images were then imported into Visiopharm software for quantitative analysis. Using the Visiopharm image analysis module, regions of interest were manually detected and sampled at 100% around the adipose tissue. The areas around vessels were manually excluded. The software converted the initial digital imaging into grayscale values, using two features, RGB-B and IHS-S. Visiopharm was then trained to label nuclei and adipose tissue, using a configuration based on a threshold of pixel values. Using this configuration, we processed images in batch mode to generate the desired outputs. All studies were performed by an observer blinded to animal genotype.
BM-DMs and BM-DCs
Bone marrow harvested from femurs and tibias of 16-week-old mice was gently suspended in RPMI. Cells were collected by centrifugation (300 × g, 5 min), plated (2 × 10⁶) in 6-well plates, and cultured for 7 days in RPMI supplemented with 10% FBS, 1% penicillin, and either 30 ng/ml mouse recombinant M-CSF or 10 ng/ml GM-CSF (R&D Systems, Minneapolis, MN). Medium was replaced on days 4 and 6. Conditioned medium was prepared by overnight incubation with serum-free medium and was concentrated 20 times by centrifugation (300 × g, 20 min) with centrifugal filter units (Amicon Ultra 3K, Millipore). Protein concentration was measured by the BCA protein assay (Pierce), and the medium was than rediluted with fresh medium to obtain 1× concentration. RNA was harvested from cells, using the RNeasy mini kit (Qiagen) (14, 15).
Flow Cytometry and Cell Sorting
After isolation of SVF from the epididymal fat pads, the SVF pellet was incubated with an Fc receptor blocker (CD16/32) and a mixture of monoclonal antibodies. Propidium iodide was used to eliminate dead cells from the analysis. A list of antibodies used is provided in supplemental Table 2. Cells were sorted on a FACSCanto II cell analyzer, and the leukocyte population was identified on side scatter versus forward scatter plots followed by a propidium iodide (PI−) and CD45+ selection (26). A dump gate for CD80, CD86, CD103, CD4, CD8, and DEC205 under FITC was used to verify that Cd45+Cd11b+Cd11c+MHCII+ do not express any of these proteins included.
Antigen Presentation Assay
Relevant cell populations isolated from 10 mice were pooled and seeded into a 96-well plate, at least in duplicate, at 7,500 cells/well. Following overnight incubation, the cells were exposed to ovalbumin (200 μg/ml) overnight and incubated for 4 days with 105 ovalbumin-specific T cell receptor transgenic (OT-I) cells labeled with cell tracer, proliferation marker, carboxyfluorescein diacetate, and succinimidyl ester. T cell proliferation was assessed by loss of intensity of succinimidyl ester of the CD44- (activation marker) and CD8-positive cells (27).
Antibodies
Antibodies were purchased from eBioscience: Cd45 (48-0451), Cd11b (25-0112), Cd11c (12-0114), F4/80 (11-24801), MHCII (11-5980), Cd80 (11-0801), Cd86 (11-0862), Cd205 (17-2051), Cd4 (11-0041), Cd8 (11-0083), Cd44 (48-0441), PI (00-6990), Fcblock (14-0161).
Culture of 3T3-L1 Cells
3T3-L1 cells (ATCC, Manassas, VA) were cultured in DMEM with 10% calf serum and 1% penicillin-streptomycin in the required plate format. For 96-well plates, the cells were seeded at 10,000/well. For 24-well plates, they were seeded at 25,000 cells/well. Following overnight culture, the medium was supplemented with 1 μm dexamethasone, 0.25 μm isobutylmethylxanthine, and 2 μm insulin for the first 3 days and 2 μm insulin for the remaining 2 days. Differentiation was assessed by measuring TG accumulation at day 5, using AdipoRed adipogenesis assay reagent (Lonza). Oil Red O staining was used to image neutral lipid accumulation in the cells. Briefly, formalin-fixed cells were washed with 60% isopropyl alcohol, stained with oil red O for 10 min, and then washed extensively with water prior to imaging (28).
Statistical Analyses
Data represent means ± S.E. Unpaired two-tailed Student's t test and one-way analysis of variance followed by Tukey correction were used for statistical analysis. p < 0.05 was considered significant.
Results
GM-CSF Induces Increased Fat Mass in Young Mice, and the Effect Is Maintained throughout Adulthood
Two previous studies showed that adult Csf2−/− mice have either normal body weight when fed a low fat diet or increased body weight when fed a high fat diet compared with wild-type littermate controls (29, 30). However, both reports failed to report adiposity. We were interested in the possibility that GM-CSF could also help to regulate normal adipogenesis and adipose tissue expansion from a young age. To study its contribution to adipose tissue expansion in young mice, we fed 3–4-week-old mice a low fat diet and assessed their adiposity. Young Csf2−/− mice showed a significant 20% increase in adiposity, whereas their body weights and lean mass were comparable with those of wild-type mice (Fig. 1, A, C, and E). We next evaluated adiposity in low fat-fed adult Csf2−/− mice at 15 and 25 weeks of age. Data from both time points yielded similar results (data not shown). The differences at 25 weeks of age are shown in Fig. 1. Body weight and lean mass of the adult Csf2−/− mice were 12% lower than those of the wild-type mice. However, fat pad weight, as a percentage of total body weight, was 2.5 times higher (Fig. 1, B, D, and F), which was consistent with the results from the 3–4-week-old mice.
FIGURE 1.
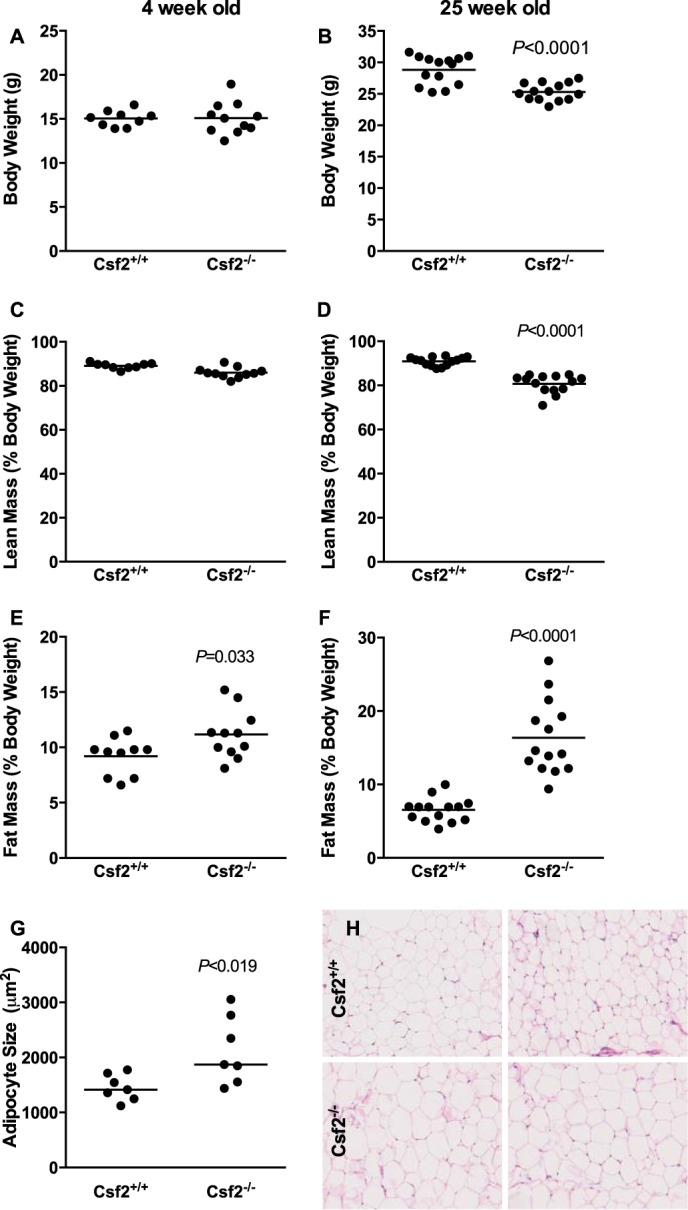
Csf2−/− mice exhibit increased adiposity when fed a low fat diet. A and B, body weight. Body composition is presented as lean mass (C and D) and fat mass (E and F) normalized to body weight. Adipose tissue morphology mean adipocyte area (G) and images showing the morphology of the adipose tissue by H&E staining (H).
Increased adiposity is characterized by larger adipocytes that accumulate more triglyceride and/or by increased adipocyte number. We confirmed that adiposity was greater by quantifying the mean adipocyte area in hematoxylin-stained sections. The adipocyte area was 50% larger in the Csf2−/− mice than in the wild-type controls (Fig. 1, G and H). The strains had comparable numbers of nuclei per adipose-only tissue area (0.0019 ± 0.0000025 versus 0.0016 ± 0.00011 nuclei/μm2, n = 3, p = 0.20 in Csf2+/+ versus Csf2−/− mice, respectively). However, the Csf2−/− mice had 50% more adipose tissue weight than the control mice (Fig. 1F). It is therefore possible that mice lacking GM-CSF harbor more adipocytes per adipose depot. Overall, these findings demonstrate that, despite modestly reduced body weight, GM-CSF deficiency results in a robust increase in body fat content that is manifested as early as 3–4 weeks of age and is maintained through adulthood. It is possible that the main effect of GM-CSF is on adipose tissue hypertrophy, with a smaller contribution to adipogenesis.
Csf2−/− Mice Exhibit Favorable Glucose Homeostasis
To assess whether increased adiposity had a metabolic impact, we also measured fasting plasma glucose, triglycerides, total cholesterol levels, liver triacylglycerides and glycogen, and muscle triacylglycerides and glycogen in lean adult mice (Table 1). Despite increased adiposity, the fasting glucose levels of the adult Csf2−/− mice were more favorable than those of the control mice. Furthermore, plasma triglyceride levels were elevated although liver and skeletal muscle TG and glycogen levels remained unchanged.
TABLE 1.
Plasma and tissue parameters for Csf2+/+and Csf2−/− mice
Triglycerol and total cholesterol were measured following a 4-h fast.
| Parameters | Csf2+/+ | Csf2−/− | p value |
|---|---|---|---|
| 4-h fasting glucose (mg/dl) | 120.8 ± 6.6 | 90.6 ± 13.8 | <0.0001 |
| Overnight fasting glucose (mg/dl) | 148.7 ± 41.8 | 102.5 ± 30.4 | <0.0001 |
| TG (mg/dl) | 36.1 ± 13.5 | 65.2 ± 18.2 | 0.0002 |
| Total cholesterol (mg/dl) | 119.5 ± 51.1 | 129.6 ± 18.2 | 0.52 |
| Liver TG (μg/mg protein/g tissue weight) | 15.57 ± 13.87 | 18.81 ± 6.22 | 0.64 |
| Muscle TG (μg/mg protein/g tissue weight) | 13.81 ± 7.53 | 12.27 ± 5.18 | 0.71 |
| Liver glycogen (μg/mg protein/g tissue weight) | 0.154 ± 0.079 | 0.215 ± 0.023 | 0.48 |
| Muscle glycogen (μg/mg protein/g tissue weight) | 0.411 ± 0.058 | 0.81 ± 0.25 | 0.16 |
In rodents and humans, increased adiposity and larger adipocytes are usually associated with a decline in peripheral insulin sensitivity (31, 32). However, the adult Csf2−/− mice, despite increased adiposity, had greater glucose tolerance and insulin sensitivity (Fig. 2, A and B) in response to glucose tolerance and insulin sensitivity tests. Consistently, the Csf2−/− mice required less insulin to maintain blood glucose levels than the wild-type mice, as shown by the 50% reduction in plasma insulin levels (Fig. 2C). Short term and overnight fasting plasma glucose levels were also reduced in the Csf2−/− mice, confirming better glucose homeostasis than in the wild-type controls (Table 1).
FIGURE 2.

Characterization of glucose metabolism and energy homeostasis. Glucose tolerance (A) and insulin tolerance (B) tests were performed with adult male mice (n = 12–17; *, p < 0.01; **, p < 0.001). Plasma insulin levels were measured following a 4-h fast (C). Energy homeostasis was assessed by indirect calorimetry for five adult male mice. Ambulatory activity (D), oxygen consumption VO2 (E), and heat production (F) are shown.
Csf2−/− Mice Exhibit Increased Energy Expenditure
To understand the contribution of DCs to energy metabolism, we measured food intake, ambulatory activity (Fig. 2D), heat production (Fig. 2F), and oxygen consumption (Fig. 2E). Csf2−/− mice ate significantly more during the light cycle (1.14 ± 0.10 versus 2.11 ± 0.25 g; n = 5, p = 0.0071, Csf2+/+ versus Csf2−/−, respectively). However, the groups had comparable 24-h cumulative food intake. Compared with the Csf2+/+ mice, dark cycle ambulatory activity was 50% lower for the Csf2−/− mice (Fig. 2D). Both oxygen consumption (Fig. 2E) and heat production (Fig. 2F) increased by ∼15% during the light cycle and also over 24 h in the Csf2−/− mice, suggesting increased metabolic rate. Meanwhile, the strains had comparable respiratory quotients in both the light and dark cycles, suggesting similar basal metabolic rates. Overall, when compared with the Csf2+/+ mice, the Csf2−/− mice ingested a comparable number of calories over the 24-h cycle but had higher energy expenditure. These observations are discordant with the increased body adiposity of the Csf2−/− mice. This suggests that mechanisms other than energy expenditure contribute to the increased adiposity observed in Csf2−/− mice.
Adipose Tissue of Csf2−/− Mice Contains Fewer GM-CSF-dependent DCs
GM-CSF is required for the maturation of non-lymphoid DCs in vivo (33). In vitro, GM-CSF treatment consistently promotes the differentiation of bone marrow progenitor cells into immature BM-DCs, and this system serves as a model for generating monocyte-derived DCs that share several characteristics with their in vivo DC counterparts (14, 15). Specifically, BM-DCs produce TNF and iNOS and exhibit higher levels of the cell surface markers CD11c and MHCII and lower levels of F4/80, as compared with BM-DMs (16).
To examine the effect of GM-CSF deprivation on myeloid cell populations in adipose tissue, we assessed myeloid cell populations in isolated SVF. Four-week-old Csf2−/− mice had a profound reduction in their CD45+CD11b+CD11c+ cell population compared with their wild-type littermates: 4.8% versus 18.7% as a percentage of CD45+ cells (Fig. 3A). Furthermore, this B+C+ cell population was F4/80-negative and MHCII-positive (Fig. 3, B and C). Consistently, SVF from adult Csf2−/− mice had lower Cd11b and Cd11c gene expression (Fig. 3I). For example, adipose tissue from adult 25-week-old Csf2−/− mice showed a decrease in CD45+CD11b−CD11c+ (B−C+) and CD45+Cd11b+Cd11c+ (B+C+) leukocyte subpopulations (Fig. 2, D, G, and H). Both subpopulations expressed low levels of F4/80; however, the CD45+Cd11b+Cd11c+ B+C+ but not CD45+CD11b−CD11c+ (B−C+) population expressed high levels of MHCII (Fig. 3, E and F). Furthermore, these cells did not express several lymphocyte and plasmacytoid DC markers, including CD4, CD8, CD103, DEC 205, CD80, and CD86 (data not shown), indicating that the CD45+CD11b−CD11c+ (B−C+) and CD45+Cd11b+Cd11c+ (B+C+) cells were not lymphocytes, plasmacytoid DCs, skin DCs, or mature DCs. CD11c and MHCII are abundantly present on the DC surface (16, 34). Under physiological conditions, 20% of all myeloid cells in adipose tissue are GM-CSF-dependent DCs.
FIGURE 3.

Characterization of adipose tissue myeloid populations by surface markers, gene expression, and antigen presentation. Representative FACS plots showing CD11b- and CD11c-expressing CD45+ cells and subpopulations in 4-week-old mice (A, pooled from 10 mice) and 25-week-old mice (D, n = 12). F4/80 and MHCII expression by CD45+CD11b-CD11c+ (B−C+) and CD45+CD11b+CD11c+ (B+C+) subpopulations was measured in 4-week-old mice (B and C) and 25-week-old mice (E and F). The myeloid subpopulations were quantified for 25-week-old mice as a percentage of CD45+ cells (G) and per g of adipose tissue (H). CD11b and CD11c gene expression in the SVF of epididymal adipose depot was quantified for 25-week-old mice (I, n = 12). A T cell proliferation assay was performed to assess the antigen presentation capability of B−C+ and B+C+ myeloid subpopulations (J). Myeloid subpopulations were isolated from pooled SVF from 10 adult wild-type mice.
MHCII plays an important role in antigen presentation, a major function of DCs (11, 35, 36). Once mature, DCs contribute to antigen presentation and T cell priming (37) and activation (35).
To test the antigen-presenting capabilities of CD45+Cd11b+Cd11c+ B+C+ and CD45+Cd11b−Cd11c+ B−C+ cells isolated from adipose tissue, we compared those cell populations with BM-DCs generated in vitro. Only the CD45+Cd11b+Cd11c+ B+C+ subpopulation was functionally comparable with GM-CSF-dependent BM-DCs generated in vitro (Fig. 3J).
In summary, Csf2−/− mice exhibit increased adiposity, and their adipose tissue has a dramatically reduced CD45+CD11b+CD11c+MHCII+F480− DC population from an early age and throughout adulthood. These observations suggest that DCs derived from GM-CSF-dependent monocytes play a critical role in restricting adipose tissue homeostasis and development.
The Membrane Proteome and Secretome of Myeloid Cells Derived from M-CSF- and GM-CSF-stimulated Bone Marrow Display Wide Polarity
To evaluate the possibility that adipose tissue DCs secrete factors that inhibit adipose tissue expansion, we first performed gene expression and mass spectrometric analyses of cell surface proteins and proteins secreted from (a) BM-DMs differentiated in vitro by M-CSF (macrophage colony-stimulating factor) and (b) BM-DCs differentiated in vitro by GM-CSF. The gene expression panel (Fig. 4A) demonstrated that BM-DCs express several genes, including Arg 1, Cd11c, Ym1, and iNOS (Nos2), at higher levels than BM-DMs. The relative increase in iNOS expression in BM-DCs is consistent with recent characterization of the DC cell surface proteome (16). Thus, Nos2 gene expression is 4-fold higher in BM-DCs than in BM-DMs (Fig. 4A). It is 70% lower in SVF from Csf2−/− mice than in SVF from controls (Fig. 4C). Consistently, Nos2 gene expression is arbitrarily increased 100-fold in CD45+CD11b+Cd11c− B+C+ cells (the BM-DC in vivo counterparts) compared with CD45+CD11b−Cd11c− B−C− cells, which do not express detectable Nos2 (34–36 cycle number) (Fig. 4E). Because IL-12β is a marker for DC maturation (38), it was 2-fold higher in the BM-DCs and 30-fold higher in the CD45+CD11b+Cd11c+ cells than in the CD45+CD11b+Cd11c− population (Fig. 3, A and D). Conversely, levels of Il10 (Fig. 4E) and Tnfa (Fig. 4G) gene transcripts in the CD45+CD11b+Cd11c+ and CD45+CD11b+Cd11c− B+C+ subpopulations were comparable, although transcript levels of both genes were significantly higher in the BM-DCs than in the BM-DMs (Fig. 4A). Furthermore, the BM-DCs also secreted large amounts of matrix metalloproteinase (MMP12) and fibronectin (Fn1) (Fig. 4B). The full spectrum of secreted proteins is presented in supplemental Table 1. SVF from Csf2−/− mice had 2-fold lower transcript levels for Fn1 and Mmp12 (Fig. 4C), whereas CD45+CD11b+Cd11c+ B+C+ cells had 5-fold higher Mmp12 gene expression (Fig. 4I) and 10-fold higher Fn1 (Fig. 4H) gene expression than the CD45+CD11b+Cd11c− B−C− population. These results support the conclusion that the CD45+CD11b+Cd11c+ DCs isolated from adipose tissue are comparable in their cell surface markers with the GM-CSF-dependent BM-DCs generated in vitro (Cd45, CD11b, CD11c, MHCII, F4/80), secreted proteins (MMP12 and FN1), and gene expression (Nos2 and IL12b). They also appear to be functionally comparable when assessed by antigen presentation (Fig. 4J).
FIGURE 4.

Characterization and comparison of BM-DCs and in vivo CD45+CD11b+CD11c+ counterparts. A, gene expression profile of expressed normalized BM-DM. Dotted line, BM-DMs; black bars, BM-DCs differentiated in vitro (from 6 sets of experiments). B, secreted proteome determined by proteomic analysis of conditioned medium from BM-DMs and BM-DCs (n = 6). C, DC-specific gene expression in SVF (n = 6). D–H, gene expression profiles for the isolated myeloid cell populations generated in vivo (n = 12).
DC-conditioned Medium Inhibits Adipocyte Differentiation in Vitro
We next treated differentiating preadipocytes (3T3-L1 cells) with different concentrations of conditioned medium from BM-DMs or BM-DCs that had differentiated in vitro. Although conditioned medium from BM-DMs had no effect on preadipocyte differentiation, BM-DC-conditioned medium dramatically inhibited preadipocyte differentiation and lipogenesis (measured as adipocyte neutral lipid accumulation) in a concentration- dependent manner (Fig. 5, A and B). At 50 μg/ml, BM-DC-conditioned medium also modified several genes involved in adipogenesis and lipid accumulation. Thus, Pparγ, Cebpα, Cebpδ, Cebpγ, Scd1, and Fabp4 were significantly down-regulated, and the preadipocyte factor 1 (Dlk1 or Pref-1) was significantly up-regulated (6-fold) when compared with cells treated with BM-DM-conditioned medium at the same concentration (Fig. 5D). Pref-1 is secreted from preadipocytes and inhibits adipocyte differentiation (39). We therefore showed that exposure to BM-DC-conditioned medium impairs preadipocyte to adipocyte differentiation.
FIGURE 5.

Inhibition of adipocyte differentiation by BM-DCs. A, visualization of inhibition of adipocyte differentiation. B, quantification of dose-dependent inhibition of adipocyte differentiation. C, quantification of adipocyte differentiation after GM-CSF treatment (mean of 4 experiments is presented). D, adipogenesis gene expression profile for preadipocytes treated with BM-DM-conditioned medium (dotted line) and BM-DC-conditioned medium (white bars). E, adipogenesis gene expression profile in epididymal fat pad of wild-type (dotted line) and Csf2−/− mice (n = 12).
Importantly, recombinant GM-CSF had no effect on adipocyte differentiation, confirming that factors secreted from DCs, rather than GM-CSF itself, is responsible for the inhibitory effect we observed (Fig. 5C). Thus, the increased adiposity and enlargement of adipocytes that we found in the Csf2−/− mice was associated with significantly increased expression of genes involved in adipogenesis and a 2-fold reduction in Pref-1 levels in the adipose tissue (Fig. 5E). These observations suggest that, under physiological conditions, DCs limit adipocyte differentiation by their secreted products and that the reduction in adipose tissue DCs allows increased adiposity.
Mice deficient in GM-CSF display alterations in their vascular extracellular matrix (40). Increased adipocyte differentiation and enlarged adipocytes might alter adipose tissue extracellular composition. We tested that hypothesis by measuring levels of extracellular matrix gene transcripts in whole adipose tissue from wild-type and Csf2−/− mice, using a superarray. We concluded that the extracellular matrix was altered because levels of several extracellular matrix genes (Col2a1, Entpd1, Hc, Lamc1, Sparc, Timp2, Vcam1) were modified in a statistically significant manner (Table 2).
TABLE 2.
Differentially expressed extracellular matrix and adhesion molecule genes in adipose tissue
Gene transcripts were measured by an extracellular matrix superarray in epididymal adipose tissue from six Csf2+/+ and Csf2−/− mice. CI, confidence interval.
| Gene | Change from control | 95% CI | p value |
|---|---|---|---|
| -fold | |||
| Col2a1 | 2.1314 | (0.97, 3.30) | 0.043576 |
| Entpd1 | 1.4685 | (1.07, 1.86) | 0.034928 |
| Hc | 2.6183 | (0.67, 4.56) | 0.021171 |
| Lamc1 | 4.0793 | (1.53, 6.63) | 0.001754 |
| SIparc | 0.6997 | (0.49, 0.90) | 0.026548 |
| Timp2 | 3.1314 | (0.83, 5.43) | 0.018904 |
| Vcam1 | 2.1279 | (1.24, 3.02) | 0.009766 |
MMP12 and Fn1 Are Mediators of DC-dependent Inhibition of Adipogenesis
Our observation that medium conditioned by BM-DCs inhibits adipogenesis in a concentration-dependent manner suggests that factors secreted from DCs are responsible. As shown by the secretome proteomics (Fig. 4B), MMP12 and FN1 are abundantly secreted proteins from BM-DCs. Moreover, gene expression of Mmp12 and Fn1 is significantly up-regulated in CD45+CD11b+Cd11c+ B+C+ cells (3- and 5-fold, respectively) compared with CD45+CD11b+Cd11c− B−C+ cells (Fig. 4, H and I). Fibronectin has been shown to inhibit adipocyte differentiation (41) by interacting with Pref-1 (8).
To determine whether MMP12 secreted by DCs affects adipocyte differentiation, we used bone marrow from Mmp12−/− mice. Lack of MMP12 significantly improved adipogenesis by 30% (Fig. 6A). To explore the role of Fn-1, we silenced Fn-1 gene expression in BM-DCs and determined how the resulting conditioned medium affected adipogenesis. Lack of Fn-1 significantly improved adipocyte differentiation and triglyceride accumulation by 20% (Fig. 6B). Taken together, our results suggest that the MMP12 and fibronectin proteins secreted from DCs contribute to inhibition of adipocyte differentiation.
FIGURE 6.
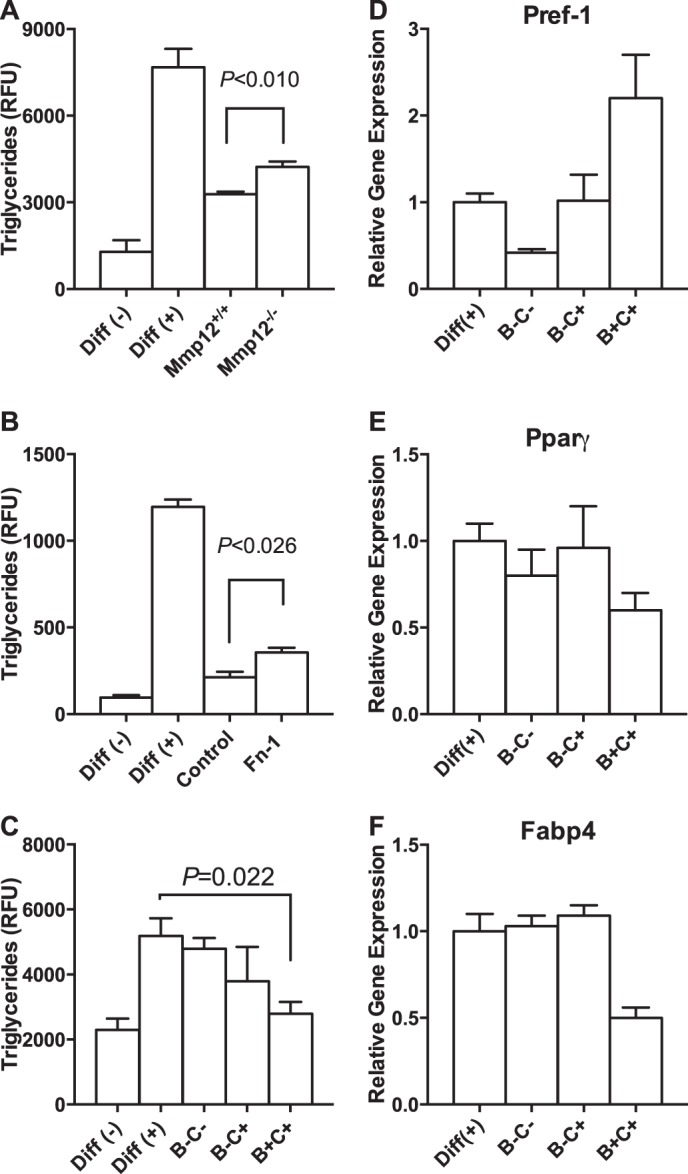
Inhibition of adipocyte differentiation by CD45+CD11b+CD11c+ myeloid cells. A, increased adipogenesis in preadipocytes treated with BM-DC-conditioned medium from Mmp12−/− mice. B, increased adipogenesis in preadipocytes treated with conditioned medium from BM-DCs in which Fn1 had been silenced. Both experiments were repeated four times, and representative experiments are presented. C, inhibition of adipogenesis when preadipocytes are co-cultured with CD45+CD11b+CD11c+ cells. The experiment was repeated three times. D–F, panel of adipogenesis genes for the CD45+CD11b+CD11c+ co-culture experiments.
The secretome of BM-DCs is also enriched in S100A8 and S100A9, two calcium-binding proteins in the S100 family (Fig. 4B). We assessed the role of secreted S100A8 and S100A9 on adipocyte differentiation, using S100a9−/− mice that were also deficient in S100A8 protein (42). Lack of S100A8 and S100A9 improved adipogenesis by 30% at 50 ng/ml concentration measured by triglyceride accumulation (163.55 ± 9.870 and 272.5 ± 4.010, n = 4, p < 0.0001 for wild-type versus S100a9−/− dendritic cells).
However, levels of S100A8 and S100A9 did not appear to be low in the SVF fraction of adipose tissue from the Csf2−/− mice (data not shown). Furthermore, S100a9−/− mice do not exhibit increased adiposity (42). Hence, it is not clear whether S100A8 and S100A9 secreted by DCs also help to inhibit adipocyte differentiation.
DCs from Adipose Tissue Inhibit Adipocyte Differentiation
To confirm our in vitro findings, we isolated CD45+CD11b+Cd11c+ B+C+ cells from adipose tissue of 10 wild-type mice and co-cultured those cells with preadipocytes in the presence of differentiation medium. The presence of CD45+CD11b+Cd11c+ cells inhibited adipocyte differentiation, whereas CD45+CD11b−Cd11c− and CD45+CD11b+Cd11c− cells had no effect, as measured by triglyceride accumulation (Fig. 6C) and gene expression (Fig. 6, D–F). Pref-1 was 2-fold higher, whereas PPARg and Fabp4 were down-regulated. We repeated these experiments twice and therefore did not calculate statistical significance. Thus, CD45+CD11b+Cd11c+ DCs isolated from adipose tissue inhibit both adipogenesis and triacylglycerol accumulation.
Discussion
Increased Adiposity in Csf2−/− Mice Is Not Explained by Changes in Energy Homeostasis, but It Might Promote Insulin Sensitivity
Adipose tissue contains most of the energy stores in healthy mammals (2). These stores participate in energy homeostasis by regulating both food intake and energy expenditure (43). Despite increased energy expenditure (measured as VO2 consumption and heat production) and comparable food intake, the mice lacking GM-CSF-dependent DCs had increased adipose tissue mass. This observation strongly suggests that DCs participate locally in regulating adipose tissue physiology. Conversely, Csf2−/− mice exhibited no differences in skeletal muscle or liver TG or glycogen levels, indicating that adipose tissue does not expand at the expense of substrate availability in other tissues targeted by insulin. Although an effect of Csf2 on other tissues cannot be ruled out, our results strongly suggest that DCs limit adipose tissue expansion. The effects of adipose tissue DCs on plasma triglyceride levels, adipocyte metabolism, and fatty acid oxidation warrant further investigation.
Lean Csf2−/− mice fed a low fat diet showed a 2-fold increase in percentage of fat mass while maintaining comparable body weight. They also had favorable glucose profiles in response to glucose and insulin challenges. These findings support the adipose tissue expandability hypothesis, which states that the adipose tissue's capacity to expand, determined by both genetic and environmental factors, prevents lipid overspill and protects against peripheral insulin resistance (44). It is important to note that bold phenotypic changes are observed when lean mice receive a low fat diet. Therefore, the Csf2−/− mouse appears to be a unique model for understanding the relationships among adipose tissue expansion, immunity, and glucose homeostasis. Further work is required to understand whether the contribution of DCs to glucose homeostasis is a direct effect or the result of adipose tissue expansion.
Adipose Tissue DCs, but Not Macrophages, Suppress Adipose Tissue Expansion and Adipogenesis
Monocytes continuously enter peripheral tissues, where they can differentiate into DCs in the presence of GM-CSF (45, 46). DC differentiation also occurs during trans-endothelial monocyte trafficking (46). A tissue's content of DCs is maintained in a steady state at sites of potential pathogen entry, where these cells patrol the environment for invading pathogens. However, our work strongly suggests a novel function for resident white adipose tissue DCs: controlling normal adipose tissue development and adipogenesis to prevent uncontrolled expansion of the tissue.
White adipose tissue cannot be detected macroscopically during embryonic development in rodents, but it becomes visible 2–3 weeks after birth (47), when the Csf2−/− adipose tissue phenotype also becomes detectable. We show that white adipose tissue CD45+CD11b+Cd11c+ DCs are markedly reduced in very young Csf2−/− mice (3–4 weeks of age) and that low levels are maintained in adult (25 weeks of age) mice. Loss of adipose tissue DCs is associated with a clear increase in white adipose tissue mass and adipocyte cell size. Furthermore, we show that DCs isolated from adipose tissue have the ability to suppress adipocyte TG accumulation, most likely by secreting certain proteins. Together, our data provide strong evidence that white adipose tissue DCs suppress adipose tissue expansion.
There were clear differences between the abilities of DCs and macrophages to suppress adipogenesis. Medium conditioned by BM-DMs had no effect on adipogenesis in vitro, whereas medium conditioned by BM-DCs was dramatically inhibitory. We obtained similar results when we compared CD45+CD11b+Cd11c+ DCs with non-DC populations isolated from adipose tissue.
Although conditioned medium from macrophage cell lines was previously shown to inhibit adipocyte differentiation (48–50), the physiological relevance of those cell lines is unclear, and we were unable to repeat these results with bone marrow-derived macrophage-conditioned medium. Furthermore, the previous studies did not establish a concentration-dependent effect of macrophage-conditioned media on adipocyte differentiation. Our thorough study examined the effect of several myeloid-derived populations on adipogenesis under physiological conditions by using in vitro models, in vivo isolated cells, and knock-out animal models.
In the lean state, there are very few (∼1% of CD45+ cells) resident macrophages (CD45+CD11b+CD11c+F4/80+MHCIIlow) in adipose tissue. Although they could play a role in adipogenesis, such a small population might have too small an effect to remodel adipose tissue in vivo.
Adipose Tissue DCs Secrete Proteins, Including MMP12 and Fibronectin, That Directly Suppress Adipocyte TG Accumulation
This study shows that adipose tissue DCs probably suppress adipogenesis by releasing inhibitory proteins. Mass spectrometric analysis of the secretome of DCs combined with gene knock-out and gene silencing experiments identified MMP12 and fibronectin as two such secreted proteins. Both can remodel the extracellular matrix, as required for adipogenesis. However, they accounted only modestly (though significantly) for the inhibitory effects of DCs on adipogenesis. Moreover, their absence did not fully reverse the inhibition of adipogenesis induced by DC-conditioned medium. This suggests that additional factors secreted from DCs help keep adipogenesis and adipose tissue expansion in check.
Although lack of MMP12 improved adipogenesis by only 30%, the involvement of this enzyme in adipose tissue regulation is consistent with observations of Mmp12−/− mice, which are prone to obesity (26). This phenotype suggests that MMP12 helps suppress adipose tissue expansion and that adipose tissue DCs could be a major source of that enzyme.
Other studies support the concept that Pref-1 and fibronectin inhibit preadipocyte differentiation in vitro (8). For example, Pref-1 is highly expressed by preadipocytes. Moreover, treating preadipocytes with soluble Pref-1 inhibits adipogenesis by activating the MEK/ERK pathway (51, 52). Adiposity increases in Pref-1 knock-out mice, as does adipogenesis (39). It was recently shown that Pref-1 exerts its inhibitory function by binding to the C-terminal region of fibronectin, which in turn activates the MEK/ERK pathway (8, 52). Thus, the interaction of fibronectin with Pref-1 could inhibit adipogenesis directly. However, treating human preadipocytes with either macrophage- or monocyte-conditioned media decreased fibronectin levels in preadipocytes and increased collagen I and III levels (49). Therefore, it is possible that fibronectin inhibits adipogenesis indirectly by modulating the extracellular matrix. However, we did not detect significant changes in Itgam and Itg2 expression levels in wild type or Csf2−/− adipose tissue, although fibronectin has been shown to interact with integrins to form extracellular matrix (53). Thus, further work is required to determine how fibronectin secreted from DCs can suppress adipogenesis and extracellular matrix and participate in adipose tissue remodeling.
In addition to the factors we identified, other proteins are likely to inhibit adipogenesis and adipose tissue expansion by forming a coordinated network that prevents unwanted adipogenesis. For example, TNF-α, which is also secreted by BM-DCs, was shown to inhibit adipogenesis in 3T3-L1 cells via a β-catenin/TCF4-dependent pathway (54).
In summary, our observations demonstrate that DCs play an important role in white adipose tissue because they suppress adipogenesis and adipose tissue expansion. We also determined that fibronectin and MMP12, which are secreted from DCs, contribute to that inhibition.
Supplementary Material
This work was supported, in whole or in part, by National Institutes of Health Grants HL092969, HL097365, HL062887, P30 DK035816, P30 DK017047, HL108897, and HL112625. This work was also supported in part by the Quantitative and Functional Proteomics Core of the Diabetes Research Center (University of Washington), the NORC Energy Balance and Glucose Metabolism Core, and American Heart Association Grant 11POST7390072.

This article contains supplemental Table 1.
- SVF
- stromal vascular fraction
- DC
- dendritic cell
- BM-DC
- bone marrow-derived DC
- BM-DM
- bone marrow-derived macrophage
- TG
- triacylglycerol
- iNOS
- inducible nitric-oxide synthase.
References
- 1. Nishimura S., Manabe I., Nagasaki M., Hosoya Y., Yamashita H., Fujita H., Ohsugi M., Tobe K., Kadowaki T., Nagai R., Sugiura S. (2007) Adipogenesis in obesity requires close interplay between differentiating adipocytes, stromal cells, and blood vessels. Diabetes 56, 1517–1526 [DOI] [PubMed] [Google Scholar]
- 2. Rosen E. D., Spiegelman B. M. (2006) Adipocytes as regulators of energy balance and glucose homeostasis. Nature 444, 847–853 [DOI] [PMC free article] [PubMed] [Google Scholar]
- 3. Rosenson R. S., Brewer H. B., Jr., Chapman M. J., Fazio S., Hussain M. M., Kontush A., Krauss R. M., Otvos J. D., Remaley A. T., Schaefer E. J. (2011) HDL measures, particle heterogeneity, proposed nomenclature, and relation to atherosclerotic cardiovascular events. Clin. Chem. 57, 392–410 [DOI] [PubMed] [Google Scholar]
- 4. Morrison R. F., Farmer S. R. (2000) Hormonal signaling and transcriptional control of adipocyte differentiation. J. Nutr. 130, 3116S–3121S [DOI] [PubMed] [Google Scholar]
- 5. O'Connell J., Lynch L., Hogan A., Cawood T. J., O'Shea D. (2011) Preadipocyte factor-1 is associated with metabolic profile in severe obesity. J. Clin. Endocrinol. Metab. 96, E680–E684 [DOI] [PubMed] [Google Scholar]
- 6. Sul H. S. (2009) Minireview: Pref-1: role in adipogenesis and mesenchymal cell fate. Mol. Endocrinol. 23, 1717–1725 [DOI] [PMC free article] [PubMed] [Google Scholar]
- 7. Lee K., Villena J. A., Moon Y. S., Kim K.-H., Lee S., Kang C., Sul H. S. (2003) Inhibition of adipogenesis and development of glucose intolerance by soluble preadipocyte factor-1 (Pref-1). J. Clin. Invest. 111, 453–461 [DOI] [PMC free article] [PubMed] [Google Scholar]
- 8. Wang Y., Hudak C., Sul H. S. (2010) Role of preadipocyte factor 1 in adipocyte differentiation. Clin. Lipidol. 5, 109–115 [DOI] [PMC free article] [PubMed] [Google Scholar]
- 9. Banchereau J., Steinman R. M. (1998) Dendritic cells and the control of immunity. Nature 392, 245–252 [DOI] [PubMed] [Google Scholar]
- 10. Heath W. R., Carbone F. R. (2009) Dendritic cell subsets in primary and secondary T cell responses at body surfaces. Nat. Immunol. 10, 1237–1244 [DOI] [PubMed] [Google Scholar]
- 11. Helft J., Ginhoux F., Bogunovic M., Merad M. (2010) Origin and functional heterogeneity of non-lymphoid tissue dendritic cells in mice. Immunol. Rev. 234, 55–75 [DOI] [PubMed] [Google Scholar]
- 12. Hamilton J. A. (2008) Colony-stimulating factors in inflammation and autoimmunity. Nat. Rev. Immunol. 8, 533–544 [DOI] [PubMed] [Google Scholar]
- 13. van de Laar L., Coffer P. J., Woltman A. M. (2012) Regulation of dendritic cell development by GM-CSF: molecular control and implications for immune homeostasis and therapy. Blood 119, 3383–3393 [DOI] [PubMed] [Google Scholar]
- 14. Lutz M. B., Kukutsch N., Ogilvie A. L., Rössner S., Koch F., Romani N., Schuler G. (1999) An advanced culture method for generating large quantities of highly pure dendritic cells from mouse bone marrow. J. Immunol. Methods 223, 77–92 [DOI] [PubMed] [Google Scholar]
- 15. Inaba K., Inaba M., Romani N., Aya H., Deguchi M., Ikehara S., Muramatsu S., Steinman R. M. (1992) Generation of large numbers of dendritic cells from mouse bone marrow cultures supplemented with granulocyte/macrophage colony-stimulating factor. J. Exp. Med. 176, 1693–1702 [DOI] [PMC free article] [PubMed] [Google Scholar]
- 16. Becker L., Liu N.-C., Averill M. M., Yuan W., Pamir N., Peng Y., Irwin A. D., Fu X., Bornfeldt K. E., Heinecke J. W. (2012) Unique proteomic signatures distinguish macrophages and dendritic cells. PLoS One 7, e33297. [DOI] [PMC free article] [PubMed] [Google Scholar]
- 17. Mabbott N. A., Kenneth Baillie J., Hume D. A., Freeman T. C. (2010) Meta-analysis of lineage-specific gene expression signatures in mouse leukocyte populations. Immunobiology 215, 724–736 [DOI] [PubMed] [Google Scholar]
- 18. Zhu S. N., Chen M., Jongstra-Bilen J., Cybulsky M. I. (2009) GM-CSF regulates intimal cell proliferation in nascent atherosclerotic lesions. J. Exp. Med. 206, 2141–2149 [DOI] [PMC free article] [PubMed] [Google Scholar]
- 19. Mystkowski P., Shankland E., Schreyer S. A., LeBoeuf R. C., Schwartz R. S., Cummings D. E., Kushmerick M., Schwartz M. W. (2000) Validation of whole-body magnetic resonance spectroscopy as a tool to assess murine body composition. Int. J. Obes. Relat. Metab. Disord. 24, 719–724 [DOI] [PubMed] [Google Scholar]
- 20. Pamir N., McMillen T. S., Edgel K. A., Kim F., LeBoeuf R. C. (2012) Deficiency of lymphotoxin-α does not exacerbate high-fat diet-induced obesity but does enhance inflammation in mice. Am. J. Physiol. Endocrinol. Metab. 302, E961–E971 [DOI] [PMC free article] [PubMed] [Google Scholar]
- 21. McLean J. A., Tobin G. (1987) Human and Animal Calorimetry, pp. 52–54, Cambridge University Press, New York [Google Scholar]
- 22. Pamir N., McMillen T. S., Kaiyala K. J., Schwartz M. W., LeBoeuf R. C. (2009) Receptors for tumor necrosis factor-α play a protective role against obesity and alter adipose tissue macrophage status. Endocrinology 150, 4124–4134 [DOI] [PMC free article] [PubMed] [Google Scholar]
- 23. Soukas A., Socci N. D., Saatkamp B. D., Novelli S., Friedman J. M. (2001) Distinct transcriptional profiles of adipogenesis in vivo and in vitro. J. Biol. Chem. 276, 34167–34174 [DOI] [PubMed] [Google Scholar]
- 24. Livak K. J., Schmittgen T. D. (2001) Analysis of relative gene expression data using real-time quantitative PCR and the 2(−ΔΔC(T)) method. Methods 25, 402–408 [DOI] [PubMed] [Google Scholar]
- 25. Ingraham C. A., Park G. C., Makarenkova H. P., Crossin K. L. (2011) Matrix metalloproteinase (MMP)-9 induced by Wnt signaling increases the proliferation and migration of embryonic neural stem cells at low O2 levels. J. Biol. Chem. 286, 17649–17657 [DOI] [PMC free article] [PubMed] [Google Scholar]
- 26. Lee J.-T., Pamir N., Liu N.-C., Kirk E. A., Averill M. M., Becker L., Larson I., Hagman D. K., Foster-Schubert K. E., van Yserloo B., Bornfeldt K. E., LeBoeuf R. C., Kratz M., Heinecke J. W. (2014) Macrophage metalloelastase (MMP12) regulates adipose tissue expansion, insulin sensitivity, and expression of inducible nitric oxide synthase. Endocrinology 155, 3409–3420 [DOI] [PMC free article] [PubMed] [Google Scholar]
- 27. Peng Y., Elkon K. B. (2011) Autoimmunity in MFG-E8-deficient mice is associated with altered trafficking and enhanced cross-presentation of apoptotic cell antigens. J. Clin. Invest. 121, 2221–2241 [DOI] [PMC free article] [PubMed] [Google Scholar]
- 28. Schreyer S. A., Peschon J. J., LeBoeuf R. C. (1996) Accelerated atherosclerosis in mice lacking tumor necrosis factor receptor p55. J. Biol. Chem. 271, 26174–26178 [DOI] [PubMed] [Google Scholar]
- 29. Hamilton J. A., Davis J., Pobjoy J., Cook A. D. (2012) GM-CSF is not essential for optimal fertility or for weight control. Cytokine 57, 30–31 [DOI] [PubMed] [Google Scholar]
- 30. Kim D.-H., Sandoval D., Reed J. A., Matter E. K., Tolod E. G., Woods S. C., Seeley R. J. (2008) The role of GM-CSF in adipose tissue inflammation. Am. J. Physiol. Endocrinol. Metab. 295, E1038–E1046 [DOI] [PMC free article] [PubMed] [Google Scholar]
- 31. Kahn B. B., Flier J. S. (2000) Obesity and insulin resistance. J. Clin. Invest. 106, 473–481 [DOI] [PMC free article] [PubMed] [Google Scholar]
- 32. Sun K., Kusminski C. M., Scherer P. E. (2011) Adipose tissue remodeling and obesity. J. Clin. Invest. 121, 2094–2101 [DOI] [PMC free article] [PubMed] [Google Scholar]
- 33. Kingston D., Schmid M. A., Onai N., Obata-Onai A., Baumjohann D., Manz M. G. (2009) The concerted action of GM-CSF and Flt3-ligand on in vivo dendritic cell homeostasis. 114, 835–843 [DOI] [PubMed] [Google Scholar]
- 34. Hume D. A. (2008) Differentiation and heterogeneity in the mononuclear phagocyte system. Mucosal Immunol. 1, 432–441 [DOI] [PubMed] [Google Scholar]
- 35. Cheong C., Matos I., Choi J.-H., Dandamudi D. B., Shrestha E., Longhi M. P., Jeffrey K. L., Anthony R. M., Kluger C., Nchinda G., Koh H., Rodriguez A., Idoyaga J., Pack M., Velinzon K., Park C. G., Steinman R. M. (2010) Microbial stimulation fully differentiates monocytes to DC-SIGN/CD209(+) dendritic cells for immune T cell areas. Cell 143, 416–429 [DOI] [PMC free article] [PubMed] [Google Scholar]
- 36. Merad M., Manz M. G. (2009) Dendritic cell homeostasis. Blood 113, 3418–3427 [DOI] [PMC free article] [PubMed] [Google Scholar]
- 37. Serbina N. V., Salazar-Mather T. P., Biron C. A., Kuziel W. A., Pamer E. G. (2003) TNF/iNOS-producing dendritic cells mediate innate immune defense against bacterial infection. Immunity 19, 59–70 [DOI] [PubMed] [Google Scholar]
- 38. de Jong E. C., Smits H. H., Kapsenberg M. L. (2005) Dendritic cell-mediated T cell polarization. Springer Semin. Immunopathol. 26, 289–307 [DOI] [PubMed] [Google Scholar]
- 39. Moon Y. S., Smas C. M., Lee K., Villena J. A. (2002) Mice lacking paternally expressed Pref-1/Dlk1 display growth retardation and accelerated adiposity. Mol. Cell. Biol. 22, 5585–5592 [DOI] [PMC free article] [PubMed] [Google Scholar]
- 40. Plenz G., Eschert H., Beissert S., Arps V., Sindermann J. R., Robenek H., Völker W. (2003) Alterations in the vascular extracellular matrix of granulocyte macrophage colony-stimulating factor (GM-CSF)-deficient mice. FASEB J. 17, 1451–1457 [DOI] [PubMed] [Google Scholar]
- 41. Spiegelman B. M., Ginty C. A. (1983) Fibronectin modulation of cell-shape and lipogenic gene-expression in 3t3-adipocytes. Cell 35, 657–666 [DOI] [PubMed] [Google Scholar]
- 42. Averill M. M., Kerkhoff C., Bornfeldt K. E. (2012) S100A8 and S100A9 in cardiovascular biology and disease. Arterioscler. Thromb. Vasc. Biol. 32, 223–229 [DOI] [PMC free article] [PubMed] [Google Scholar]
- 43. Guyenet S. J., Schwartz M. W. (2012) Clinical review: Regulation of food intake, energy balance, and body fat mass: implications for the pathogenesis and treatment of obesity. J. Clin. Endocrinol. Metab. 97, 745–755 [DOI] [PMC free article] [PubMed] [Google Scholar]
- 44. Virtue S., Vidal-Puig A. (2008) It's not how fat you are, it's what you do with it that counts. PLoS Biol. 6, e237. [DOI] [PMC free article] [PubMed] [Google Scholar]
- 45. Gordon S., Taylor P. R. (2005) Monocyte and macrophage heterogeneity. Nat. Rev. Immunol. 5, 953–964 [DOI] [PubMed] [Google Scholar]
- 46. Randolph G. J., Inaba K., Robbiani D. F., Steinman R. M., Muller W. A. (1999) Differentiation of phagocytic monocytes into lymph node dendritic cells in vivo. Immunity 11, 753–761 [DOI] [PubMed] [Google Scholar]
- 47. Ailhaud G., Grimaldi P., Négrel R. (1992) Cellular and molecular aspects of adipose tissue development. Annu. Rev. Nutr. 12, 207–233 [DOI] [PubMed] [Google Scholar]
- 48. Lu C., Kumar P. A., Fan Y., Sperling M. A., Menon R. K. (2010) A novel effect of growth hormone on macrophage modulates macrophage-dependent adipocyte differentiation. Endocrinology 151, 2189–2199 [DOI] [PMC free article] [PubMed] [Google Scholar]
- 49. Gagnon A., Yarmo M. N., Landry A., Sorisky A. (2012) Macrophages alter the differentiation-dependent decreases in fibronectin and collagen I/III protein levels in human preadipocytes. Lipids 47, 873–880 [DOI] [PubMed] [Google Scholar]
- 50. Bilkovski R., Schulte D. M., Oberhauser F., Mauer J., Hampel B., Gutschow C., Krone W., Laudes M. (2011) Adipose tissue macrophages inhibit adipogenesis of mesenchymal precursor cells via wnt-5a in humans. Int. J. Obes. (Lond.) 35, 1450–1454 [DOI] [PubMed] [Google Scholar]
- 51. Mei B., Zhao L., Chen L., Sul H. S. (2002) Only the large soluble form of preadipocyte factor-1 (Pref-1), but not the small soluble and membrane forms, inhibits adipocyte differentiation: role of alternative splicing. Biochem. J. 364, 137–144 [DOI] [PMC free article] [PubMed] [Google Scholar]
- 52. Kim K.-A., Kim J.-H., Wang Y., Sul H. S. (2007) Pref-1 (preadipocyte factor 1) activates the MEK/extracellular signal-regulated kinase pathway to inhibit adipocyte differentiation. Mol. Cell. Biol. 27, 2294–2308 [DOI] [PMC free article] [PubMed] [Google Scholar]
- 53. Aota S., Nagai T., Olden K., Akiyama S. K., Yamada K. M. (1991) (1991) Fibronectin and integrins in cell adhesion and migration. Biochem. Soc. Trans. 19, 830–835 [DOI] [PubMed] [Google Scholar]
- 54. Cawthorn W. P., Heyd F., Hegyi K., Sethi J. K. (2007) Tumour necrosis factor-α inhibits adipogenesis via a β-catenin/TCF4(TCF7L2)-dependent pathway. Cell Death Differ. 14, 1361–1373 [DOI] [PMC free article] [PubMed] [Google Scholar]
Associated Data
This section collects any data citations, data availability statements, or supplementary materials included in this article.