

Background: Although polySia is known to retain neurotrophins, their releasing mechanism remains unknown.
Results: PolySia present on the cell surface of microglia is rapidly cleared by Neu1 sialidase on exovesicles secreted upon inflammatory stimulus, leading to neurotrophin release.
Conclusion: Exovesicular Neu1 regulates rapid turnover of polySia and concomitant neurotrophin function.
Significance: First demonstration of on-site turnover of polySia and its physiological significance.
Keywords: Brain-derived Neurotrophic Factor (BDNF), Exosome, Microglia, Sialic Acid, Sialidase, N-Glycolyneuraminic Acid, Polysialic Acid, Polysialyltransferase
Abstract
As acidic glycocalyx on primary mouse microglial cells and a mouse microglial cell line Ra2, expression of polysialic acid (polySia/PSA), a polymer of the sialic acid Neu5Ac (N-acetylneuraminic acid), was demonstrated. PolySia is known to modulate cell adhesion, migration, and localization of neurotrophins mainly on neural cells. PolySia on Ra2 cells disappeared very rapidly after an inflammatory stimulus. Results of knockdown and inhibitor studies indicated that rapid surface clearance of polySia was achieved by secretion of endogenous sialidase Neu1 as an exovesicular component. Neu1-mediated polySia turnover was accompanied by the release of brain-derived neurotrophic factor normally retained by polySia molecules. Introduction of a single oxygen atom change into polySia by exogenous feeding of the non-neural sialic acid Neu5Gc (N-glycolylneuraminic acid) caused resistance to Neu1-induced polySia turnover and also inhibited the associated release of brain-derived neurotrophic factor. These results indicate the importance of rapid turnover of the polySia glycocalyx by exovesicular sialidases in neurotrophin regulation.
Introduction
Animal cells are covered by the glycocalyx, a dense sugar coat consisting of glycoproteins, glycolipids, and proteoglycans that provides a scaffold for communication with other cells and with the extracellular environment. The most characteristic sugars in the glycocalyx of deuterostome-lineage animals are sialic acids (Sias) (1), which are nine-carbon-backbone carboxylated sugars with a 2-keto-3-deoxy nononic acid skeleton. Sias are essential for embryonic development in mice (2) and are typically present as monosialyl residues at the non-reducing terminus of glycoproteins and glycolipids, serving important roles in ligand-receptor interactions during fertilization, development, and differentiation (1). Sialylated ligands are recognized by various proteins, such as Sia-binding immunoglobulin-like lectins (Siglecs) in immune and neural cells (3). Sia residues also often shield terminal galactose residues to regulate the myriad of functions mediated by galactose-binding lectins (galectins) (4). Sias are occasionally presented in α2–8-linked polysialic acid (polySia3/PSA) chains (5, 6) on cell surfaces and are involved in embryonic brain development and adult brain functions. The unique polySia glycotope has been considered to inhibit cell-cell interactions through its anti-adhesive effects (7). Recently, polySia also functions as a reservoir for neurobiologically active molecules such as BDNF, FGF2, and neurotransmitters (8, 9), regulating their availability and concentrations in the brain. In addition, relationships between altered polySia and schizophrenia have been reported (10–12).
Importantly, the expression of Sia residues on cell-surface glycoproteins and glycolipids is not static but changes dramatically under physiological conditions. For example, decreased Sia expression serves as an “eat me” signal on the surface of apoptotic lymphocytes (13), and desialylation of core type 1 O-glycan occurs in embryonic capsules (14). The majority of cell-surface sialylation is regulated through the controlled gene expression of sialyltransferases and sialidases, which are, respectively, involved in the biosynthesis and degradation of sialoglycoconjugates. Recently, mammalian sialidases (15, 16) and sialyltransferases (17) are shown to present on cell surfaces; therefore, the sialylation state of the cell surface also has the potential to be rapidly modified in situ. Four types of sialidases have been identified in mammals (18, 19): neuraminidase-1 (Neu1), -2 (Neu2), -3 (Neu3), and -4 (Neu4). The substrate specificity, subcellular localization, and tissue distribution of these sialidases differ from one another (18, 19), although overlapping characteristics exist between them. Notably, the subcellular localizations of Neu1–4 are reported to vary in response to physiological changes (15). Although Neu1–4 are generally recognized as intracellular enzymes, their activities have been detected in the extracellular space (20, 21), a finding that supports to the notion of in situ modification of cell-surface sialylation. However, no robust functional or mechanistic studies have examined extracellular sialidases secreted from cells. In addition, several questions remain concerning the expression and physiological function of secreted extracellular sialidases, including their involvement in the modification of cell-surface sialylation.
In the present study we investigated the above-stated questions by focusing on the effects of the extracellular sialidase toward polysialic acid that have been reported to modify neural cell adhesion molecule (NCAM) on microglia cells (22). Although decrease of polySia has been well demonstrated during long periods of brain development (7), it remains unclear whether short term changes of the polysialylation actually occur on living cell surfaces by the physiological stimulation. We used the mouse microglia cell line Ra2, an immortal microglial cell line established from neonatal C57BL/6J(H-2b) mice using a non-enzymatic and non-virus transformation procedure (23) that can secrete cytokines in a comparable manner to the primary cell line (24) for critical biochemical analyses. Here, we for the first time demonstrate that secreted Neu1 is involved in the polySia degradation and in secretion of BDNF.
Experimental Procedures
Microglia Cell Line and Primary Culture
A mouse microglial cell line, Ra2 (25), and mouse primary microglia cells obtained from the neonatal brains of ddY mice (2 days after birth; Chubu Kagaku Shizai, Nagoya, Japan) (26) were maintained in Eagle's minimum essential medium supplemented with 10% fetal calf serum, 5 μg/ml bovine insulin, 0.2% glucose, and 2 ng/ml recombinant mouse GM-CSF (Genzyme, Minneapolis, MN)) at 37 °C in humidified 5% CO2 and 95% air incubator (25).
Cell-based Experiments
A monkey kidney cell line, COS-7 (RIKEN Cell Bank, Wako, Japan), and a mouse neuroblastoma cell line, Neuro2A (HSRRB IFO50081), were cultured in Dulbecco's modified Eagle's medium containing 10% heat-inactivated fetal bovine serum, 100 units/ml penicillin, and 100 μg/ml streptomycin at 37 °C in a humidified 5% CO2 and 95% air incubator (11). The vector pcDNA3.1 containing the rat Neu1 gene or mock vector was transfected into COS-7 cells using GeneJuice (Novagen, Darmstadt, Germany) according to the manufacturer's protocol to generate the cell lines COS-rNeu1 and COS-mock, respectively. Cells were used for experimentation 48 h after transfection. The human polysialyltransferase gene (stx/st8sia2/siat8b) in pcDNA3.1 vector was transfected into Neuro2A cells, and a stable cell line was then selected with G418. The resultant oligo/polySia-expressing Neuro2A cell line was named polySia-Neuro2A. To establish a Neu-suppressed Ra2 cells, Ra2 cells were transiently transfected with control siRNA or siRNA for Neu1 or Neu4 (Santa Cruz), and the siRNA-transfected cells were named control KD, Neu1 KD, and Neu4 KD, respectively. We also used NCAM, SynCAM, and Neuropilin-2 reduced Ra2 with siRNA for NCAM, SynCAM, and Neuropilin-2 respectively (Santa Cruz).
Cell Staining and Data Processing
Cells were fixed with 4% paraformaldehyde at 25 °C for 8 min before and after endo-N-acylneuraminidase (Endo-N) treatment (0.9 milliunits/ml) (27) followed by washing with PBS. The fixed and washed cells were blocked with 2% bovine serum albumin in PBS and then incubated with the following primary antibodies at 4 °C for 20 h: monoclonal antibodies 12E3 (mouse IgM, 30 μg/ml) (28), S2-566 (mouse IgM, 30 μg/ml), 2-4B (mouse IgM, 30 μg/ml) (29), anti-mouse CD11b antibody (rat IgG, 5 μg/ml; Southern Biotechnology, Birmingham, AL), anti-mouse NCAM antibody (rat IgG, 5 μg/ml; Roche Applied Science), anti-Neu1 antibody (rabbit IgG, 10 μg/ml; Abcam), anti-Neu4 antibody (rabbit IgG, 10 μg/ml; Abcam), or control antibodies (5–30 μg/ml). After washing once with PBS, the cells were incubated with Alexa 488-conjugated anti-mouse IgM antibody (2 μg/ml; Invitrogen), Cy3-conjugated anti-rabbit IgG (2 μg/ml; Jackson ImmunoResearch, West Grove, PA), Alexa 488-conjugated anti-rat IgG antibody (2 μg/ml; Invitrogen), or Cy3-conjugated anti-rat IgG antibody (2 μg/ml; Jackson ImmunoResearch) at 37 °C for 30 min. The cells were washed once with PBS and then incubated with DAPI (1 μg/ml) at 37 °C for 10 min followed by a single wash with PBS. Cells were then observed under a fluoromicroscope (BX51, Olympus) or confocal scanning fluorescent microscope (LSAM 710; Karl Zeiss). The ratio of 12E3/DAPI staining for 100 cells was measured using ImageJ software, and the data were processed.
Cell Treatment with Reagents
Ra2 cells pretreated with or without Neu5Ac or Neu5Gc (final concentration, 2 mm) were stimulated with IL-4 (10 ng/ml) or lipopolysaccharide (LPS; 100 ng/ml-1 μg/ml) in the presence or absence of Neu5Ac2en (final, 1 mm) for 0–24 h in serum-free medium (Cosmedium 005; Cosmobio Co., Ltd., Tokyo, Japan). Cell staining, sialidase activity, and BDNF measurements were then performed. For disrupting cellular membranes, Ra2 cells were pretreated with methyl-β-cyclodextrin (MBCD; 25 μg/ml) or dimethyl amiloride (DMA; 25 μg/ml) for 2 h. All reagents were dissolved in endotoxin-free PBS before use.
Reverse Transcription-Polymerase Chain Reaction (RT-PCR)
Total RNA was prepared from Ra2 cells using TRIzol (Gibco). Random-primed cDNA (∼50 ng) and specific primers were used for the PCR (GAPDH, sense (5′-ACAAAATGGTGAAGGTCGGT-3′) and antisense (5′-TCCAGGGTTTTACTCCTT-3′); IL-6, sense (5′-CCTACTTCACAAGTCCGGAG-3′) and antisense (5′-CTGGAGCTAGGTTTGCCGAGTAGA-3′); STAT6 (sense, 5′-TTCAGATTTGGAAGCGGCAG-3′) and antisense (5′-CACCATCAAACCACTGCCAA-3′); NCAM (sense, 5′-CTAAGGATCTCATCTGGACT-3′) and antisense (5′-CTTCCTTGGCATCATACCAC-3′); Neu1 (sense, 5′-ATGTGACCTTCG ACCCTGAG-3′) and antisense (5′-TCCTTCAGCCAGGATGTACC-3′); Neu4 sense (5′-TGTTTTGGCAAGATCTGCTG-3′) and antisense (5′-AGAGGGCTTCGAGCATTACA-3′).
Preparation of Cell Lysates, CM-sup, and CM-ppt
To prepare cell lysates, 5 culture dishes of cells (1 × 10⁶/dish, 10 ml) were prepared, and cells and cell culture medium were then separated. Cells were then washed with cold PBS and homogenized on ice using PBS containing 1% Triton X-100, 1 mm phenylmethylsulfonyl fluoride, 1 μg/ml aprotinin, 1 μg/ml leupeptin, 1 μg/ml pepstatin, and 1 mm EDTA. After incubation for 1 h on ice, the homogenate was centrifuged at 10,000 × g for 5 min at 4 °C, and the resulting supernatant was collected as the cell lysate.
To prepare the cell culture medium for analysis, the separated cell culture medium was centrifuged at 1000 × g for 5 min at 4 °C to remove dead cells and debris. The supernatant was ultracentrifuged at 100,000 × g for 1 h at 4 °C using an OptimaTM L-80K ultracentrifuge (Beckman Coulter) equipped with an angle rotor (50.2Ti). The resulting supernatant was collected and used as the supernatant fraction from cell culture medium (CM-sup). The pellet was washed and resuspended in cold PBS and was then centrifuged at 100,000 × g for 30 min at 4 °C. The resulting pellet was resuspended with cold PBS and used as the pellet fraction from cell culture medium (CM-ppt) (30). The protein concentration in the cell lysate, CM-sup, and CM-ppt fractions was measured by the BCA method.
Sucrose density gradient fractionation of the cell lysate or CM-ppt (from 100 ml culture medium) samples was performed as described previously (30). Briefly, 500-μl samples were mixed with 2.5 volumes of buffer A (85% (w/v) sucrose in 10 mm Tris/HCl (pH 7.5) containing 150 mm NaCl and 5 mm EDTA) and placed in centrifuge tubes. The mixtures were layered successively with 4 ml of 60% (w/v), 3 ml of 30% (w/v), and 1 ml of 5% (w/v) sucrose in buffer A and then centrifuged at 200,000 × g for 18 h at 4 °C (SW41 Ti rotor). Fractions with different densities were collected from the top to the bottom of the tube in 1-ml quantities. Each fraction was diluted with PBS and ultracentrifuged at 100,000 × g for 30 min at 4 °C, and the resulting pellets were directly subjected to SDS/PAGE and Western blotting.
SDS-PAGE and Western Blotting
Samples were dissolved in Laemmli buffer containing 5% mercaptoethanol and then incubated at 60 °C for 20 min or 100 °C for 3 min. The denatured samples were then electrophoresed on 12.5% or 7.5% polyacrylamide gels and electroblotted onto PVDF membranes using a semidry blotting apparatus. After the transfer, PVDF membranes were blocked with PBS containing 0.05% Tween 20 and 1% skim milk or BSA at 25 °C for 1 h. The membranes were then incubated overnight with the primary antibody, 12E3 (10 μg/ml), rabbit anti-Neu1 antibody (1.0 μg/ml), rabbit polyclonal anti-CD9 antibody (1.0 μg/ml; Santa Cruz), anti-β-galactosidase antibody (1 μg/ml; Abcam), anti-PPCA antibody (1 μg/ml; Abcam), or rabbit anti-CD63 antibody (1 μg/ml; Abcam) at 4 °C. As the secondary antibody, peroxidase-conjugated anti-mouse IgG+IgM (0.4 μg/ml; American Qulex) or anti-rabbit IgG (0.3 μg/ml; Cell Signaling) were used at 37 °C for 45 min, and stained bands were visualized with chemiluminescent reagents (GE Healthcare). For immunoprecipitation experiments, Ra2 homogenates were pretreated with 100 μl of protein G-Sepharose coupled with anti-mouse IgM at 4 °C for 1 h. Precleared cell homogenates were then immunoprecipitated with 100 μl of protein G-Sepharose coupled with 12E3 (30 μg) via anti-mouse IgM or protein G-Sepharose coupled with anti-NCAM antibody (10 μg). The immunopurified molecules were then analyzed.
Measurement of Sialidase Activity in Cell Lysate, CM-sup, CM-ppt, and Culture Medium
The assay mixture consisted of 50 mm sodium acetate buffer (pH 4.5) or PBS (pH 7.2), 100 μm 4MU-Neu5Ac, 0.1% BSA, 0.1% Triton X-100, and the sample fractions (10 μl) in a final volume of 0.1 ml. After incubation at 37 °C for 30 min, the reaction was terminated by the addition of 1.0 ml of 0.25 m glycine-NaOH (pH 10.4), and the amount of 4MU released was determined fluorometrically with a FluoroMax-3 spectrophotometer (excitation 365 nm, emission 448 nm). For Neu1 inhibition, GSC-649 (37) (final concentration, 3.3 μm) was added to the incubation mixture.
Measurement of BDNF
Ra2 cells (2 × 10⁵) were plated into 6-well plates and incubated in Eagle's minimum essential medium overnight. After washing, the culture medium was replaced with serum-free medium (Cosmedium-005), and the plates were further incubated overnight. Cells were then treated with the following reagents: sialidase (final, 200 milliunits/ml), Endo-N (27) (0.45 milliunits/ml), heat-inactivated Endo-N (0.45 milliunits/ml), or LPS (1 μg/ml) in the presence or absence of Neu5Ac2en (1 mm). After 0, 10, and 60 min, cell culture medium was used for a Sandwich mouse BDNF ELISA (Abnova) according to the protocol supplied by the manufacturer. BDNF was quantitated using authentic BDNF.
Data Analysis
All values are expressed as the mean ± S.D.
Results
Detection of polySia on Mouse Microglial Cells
To examine the cell-surface sialylation state of Ra2 cells, we first analyzed cells with the specificity clarified anti-polySia antibody 12E3 that recognizes Neu5Ac oligo/polymer (degree of polymerization ≥ 5) (28) and the anti-GD3 antibody (anti-disialic acid (diSia) antibody), S2-566 (31), by cell staining. The Ra2 cell surface was both polysialylated and disialylated (Fig. 1A, Ra2, Endo-N(−)). The polySia-specific staining of Ra2 cells disappeared after treatment with Endo-N, an enzyme that specifically cleaves polySia (degree of polymerization ≥ 5) chains (27) (Fig. 1A, Ra2, Endo-N(+)). These results confirmed the presence of polySia on mouse microglia cell line Ra2. We also performed the immunostaining of primary microglia cells isolated from mouse embryonic brains using the anti-polySia and -diSia antibodies. The polySia immunostaining before and after Endo-N treatment clearly indicated the presence of polySia on the surface of primary microglial cells (Fig. 1A, Primary Microglia Cell, Endo-N(−) and Endo-N(+)), consistent with a previous report (22). As the NCAM is the major protein modified by polySia in brain (7), we analyzed polySia on NCAM from Ra2 cells. The polySia-containing glycoprotein of Ra2 cells immunopurified with the anti-polySia (Fig. 1B, IP: polySia) was detected with anti-NCAM (IB: NCAM). The NCAM immunopurified with anti-NCAM (IP: NCAM) was detected with anti-polySia (IB: polySia), indicating that NCAM is polysialylated in Ra2 cells. The detected band with anti-polySia antibody was not restricted to the upper part of 120 kDa, although the molecular size of NCAM is greater than 120 kDa (Fig. 1B, IP: polySia). NCAM is the major polySia-containing glycoproteins in brain, and ∼90% of polySia structure modifies NCAM from the results of NCAM-deficient mice. As CD36, SynCAM1, and Neuropilin-2 are reported to be modified by polySia so far (5, 6), we analyzed the possibility of these proteins as well as NCAM as polySia-containing glycoproteins in Ra2 cells. We confirmed the polySia-NCAM staining with siRNA (Fig. 1C, NCAM KD), suggesting that at least ∼80% of polySia is linked to NCAM, but we also noted that a minor part might be linked to SynCAM (32) and Neuropilin-2 (33), which are demonstrated to be polysialylated in brain.
FIGURE 1.

Ra2 microglial cells express polySia on NCAM, which is increased by anti-inflammatory cytokine IL-4, but disappears after treatment with the inflammatory substance LPS. A, immunofluorescent microscopy of microglia cells. Ra2 microglia cells established from neonatal C57BL/6J(H-2b) mice using a non-enzymatic and non-virus-transformation procedure or primary microglia cells purified from embryonic mouse brains were immunostained with 12E3 (polySia) and microglial marker CD11b (CD11b) or S2-566 (diSia) and CD11b (CD11b) before and after Endo-N treatment (Endo-N(−) and Endo-N(+), respectively) followed by staining with Alexa 488-labeled anti-mouse IgM antibody as a secondary antibody. B, identification of polySia-NCAM on Ra2 cells. Cell lysates were subjected to immunoprecipitation with 12E3 (IP: polySia) or anti-NCAM antibody (IP: NCAM) followed by detection with 12E3 (IB: polySia) and NCAM (IB: NCAM). Molecular mass markers are shown on the right of the panel. C, confirmation of polySia-NCAM by siRNA. Upper panel, Western blotting of the homogenates from Ra2 cells transfected with siRNA (control, CD36, NCAM, SynCAM, Neuropilin2) with anti-polySia antibody (12E3) and anti-actin antibody. Lower panel, the relative ratio of polySia/actin. The ratio for parental Ra2 cell homogenate was set equal to 1.0. Molecular weight mass are shown on the left of the panel. D, expression of mRNA in Ra2 cells treated without (w/o) or with IL-4 and LPS for 24 h. RT-PCR (25 cycles) was performed to amplify the mRNA for IL-6 (572 bp) (the marker of LPS treatment), STAT6 (949 bp) (the marker of IL-4 treatment), NCAM (1494 bp), and GAPDH (1009 bp). The amplified products were separated on 1% agarose gels and visualized with ethidium bromide under UV light. E, PolySia and diSia immunostaining of the cells incubated with IL-4 (10 ng/ml) or LPS (200 ng/ml) for 12 h (IL-4 and LPS, respectively). The bar indicates 50 μm. F, Western blotting of the homogenates from Ra2 cells treated without (w/o) or with IL-4, LPS or Endo-N with anti-polySia antibody (IB: polySia) or anti-NCAM antibody (IB: NCAM). Molecular mass markers are shown on the right of the panel.
Turnover of PolySia on Microglial Cells under Inflammatory Conditions
Microglia cells rapidly change their biological state in response to various stimulants, such as bacterial LPS and certain cytokines like IL-4. To investigate the polysialylation state of Ra2 cells under inflammatory or anti-inflammatory conditions, Ra2 cells were treated with LPS and IL-4 to be differentiated into M1- and M2-microglia, respectively. On RT-PCR, up-regulation of IL-6 and STAT6 mRNAs was observed after LPS and IL-4 stimulations, respectively (Fig. 1D), confirming the differentiation of Ra2 cells into M1- and M2-microglia. As shown in Fig. 1E (IL-4, LPS, upper), the cell-surface staining of polySia disappeared by the LPS treatment, although unaffected by the IL-4 treatment. On Western blotting with anti-polySia, the band was detected at the region >88 kDa (Fig. 1F, w/o) and disappeared after Endo-N treatment of Ra2 cells (Fig. 1F, Endo-N). Although the polySia-positive band of Ra2 cells appeared to be slightly up-regulated after IL-4 treatment, it was completely lost after LPS treatment (Fig. 1F, LPS and IL-4). These results were consistent with the immunofluorescence results (Fig. 1E, IL-4, LPS, polySia). The gene expression of NCAM remained nearly identical before and after the IL-4 or LPS stimulation of Ra2 cells (Fig. 1D). Taken together, these results indicate that the polysialylation state of Ra2 cell-surface changes depending on the cellular status, particularly under inflammatory conditions.
Turnover of Cell-surface PolySia Is Rapid and Mediated by an Induced Extracellular Sialidase
PolySia is known to turnover a period of days during postnatal brain development (7, 34), and this is presumed to be due to internalization and lysosomal degradation. However, the possibility that polySia might turn over rapidly on the cell surface has not been previously considered. To reveal the time-dependent decrease of cell-surface polySia expression after LPS stimulation, we quantified the immunostaining of polySia on the Ra2 cell surface using immunofluorescent microscopy (Fig. 2A). Eighty percent of the polySia staining detected on microglial cells before treatment with LPS (0 min) had disappeared within 10 min of adding LPS to the culture medium, and staining was nearly undetectable within 30 min (Fig. 2A). To determine the mechanism underlying the rapid decrease of polySia expression, we examined a possible involvement of sialidase activity. Ra2 cells were incubated with or without the sialidase inhibitor Neu5Ac2en and were then stimulated with LPS. Cell-surface polySia immunostaining remained unchanged after treatment with Neu5Ac2en (Fig. 2B), indicating that an endogenous sialidase is involved in the rapid clearance of polySia. To confirm the observed extracellular sialidase activity, the culture supernatant of microglia cells after LPS stimulation was assayed for sialidase activity using a fluorescent substrate (4MU-Neu5Ac). The sialidase activity in the culture medium under acidic conditions (pH 4.5, close to the optimal pH of mammalian sialidases) increased transiently at 10 min and was inhibited by the addition of Neu5Ac2en (Fig. 2C, pH 4.5). Interestingly, sialidase activity was also observed in the culture medium at physiological conditions (Fig. 2C, pH 7.2) but not in the cell lysate (Fig. 2C, pH 7.2). The culture medium from Ra2 cells at 10 min after stimulation without sialidase inhibitor had the activity to decrease cell-surface polySia structure using polySia-expressing Neuro2A cells as natural substrate, and this activity was inhibited using sialidase inhibitor (Fig. 2D). Therefore, the same results were obtained in transient action of the culture media for cell-surface polySia expressed on Neuro2A cells (Fig. 2D).
FIGURE 2.

LPS-induced clearance of polySia on Ra2 cells is rapid and dependent on transiently increasing sialidase activity in the culture medium. A, time course of clearance of polySia on LPS-treated cells. At 0, 10, 30, and 60 min after treatment with LPS (200 ng/ml), cells were fixed and immunostained with anti-polySia (12E3) and Alexa 488-conjugated anti-mouse IgM antibodies (upper panels of inset). Nuclei were stained with DAPI (DAPI) (lower panels of insert). The bar indicates 50 μm. The fluorescent intensity per cell was measured at each time point, and the relative intensities were plotted, with the intensity before LPS stimulation set at 100%. The bars indicate S.D. for 100 cells. B, effect of the sialidase inhibitor Neu5Ac2en on the LPS-induced clearance of polySia. Ra2 cells treated without (w/o LPS) or with LPS in the absence (LPS) or presence of Neu5Ac2en for 30 min (LPS+Neu5Ac2en) were immunostained with 12E3. The photos are merged images of cells stained for polySia (green) and nuclei (DAPI) and differential interference contrast (DIC). C, transient increase of sialidase activity in culture medium and cell lysate after LPS stimulation. Culture medium (●, ○) and cell lysate (■, □) prepared before or after 10, 30, 60, and 120 min of LPS stimulation in the absence (●, ■) or presence (○, □) of Neu5Ac2en were analyzed for sialidase activity to 4MU-Neu5Ac at pH 4.5 or 7.2. The bars represent S.D. *** indicates p < 0.001 (pH 4.5, culture medium: p = 0.00060; pH 4.5 lysate: p = 0.00004; n = 3 independent experiments. Student's t test). * indicates p < 0.05 (pH 7.2, culture medium: p = 0.015, n = 3 independent experiments. Student's t test). D, clearance of polySia on Neuro2A cells by the transiently increased sialidase activity in culture medium of Ra2 cells. Culture media prepared before or after 10, 30, 60, and 120 min of LPS stimulation in the absence (upper photos) or presence of Neu5Ac2en (lower photos) were added to polySia-NCAM-positive Neuro2A cells, which were then immunostained with 12E3 and Alexa 488-conjugated anti-mouse IgM antibodies (upper panels of photos). Nuclei were stained with DAPI (lower panels of photos). The fluorescent intensity of the cell surface was measured for 100 cells with ImageJ software at the following time points post-LPS stimulation: 0 min, ●; 10 min, ■; 30 min, ♦; 120 min, ▴. The fluorescent intensity per cell, representing the polySia expression level, was divided into 20 different degrees from dark to bright, and the cell number for each degree of intensity was plotted for Neu5Ac2en (−) (upper graph) and Neu5Ac2en (+) (lower graph).
Induced Extracellular Sialidase Can Also Work in a Trans Mode on Other Cells
To ask if induced extracellular sialidase from LPS-stimulated Ra2 cells can also work on other cells in vivo, co-culture of polySia-expressing Neuro2A cells with Ra2 cells was treated with LPS. At 10-min post-LPS treatment polySia immunostaining on Neuro2A cells near Ra2 cells disappeared (Fig. 3A), whereas it remained unchanged in the presence of Neu5Ac2en. LPS had no direct effect on the polySia of Neuro2A cells. The LPS-induced decrease of the amount of polySia in the co-culture was also quantitatively confirmed. This decrease was not observed at 10-min post-LPS treatment under Neu5Ac2en or in an unstimulated co-culture (Fig. 3B). These results demonstrate that the induced extracellular sialidase could degrade polySia on Ra2 cells in a cis mode but also on other cells in a trans mode.
FIGURE 3.
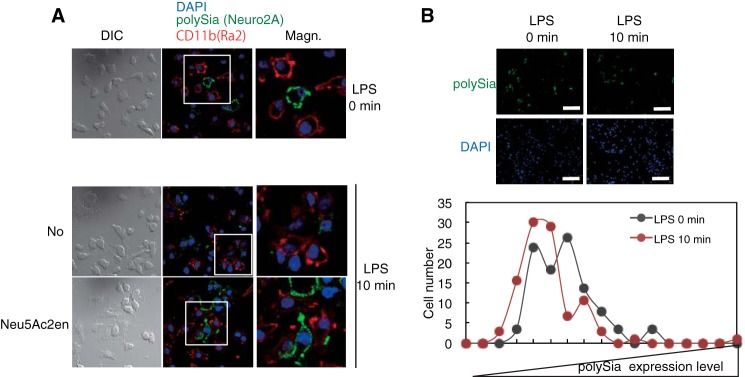
LPS-induced clearance of polySia also occurs on Neuro2A cells co-cultured with Ra2 cells. A, Ra2 cells and polySia-expressing Neuro2A cells were co-cultured at cell number ratios of 4:3. At 0 and 10 min after treatment with LPS (200 ng/ml) in the presence (Neu5Ac2en) and absence (No Inhibitor) of Neu5Ac2en, cells were fixed and immunostained with anti-polySia (12E3) followed by Alexa 488-conjugated anti-mouse IgM antibodies (green) as the secondary antibody and anti-CD11b (a microglia marker) followed by Cy3-conjugated anti-rabbit IgG antibodies (red). Nuclei were stained with DAPI (blue). The merged images (middle panel), their magnified (Magn) images (right panel) and differential interference contrast (DIC; left panel) are shown. B, upper panel, the co-culture of polySia-expressing Neuro2A cells and Ra2 cells before (LPS 0 min) and 10 min after LPS stimulation (LPS 10 min) was immunostained with 12E3 followed by Alexa 488-conjugated anti-mouse IgM antibodies (green) as the secondary antibody. Nuclei were stained with DAPI (blue). The bar indicates 50 μm. Lower panel, the fluorescent intensity of the cell surface was measured for 100 cells with ImageJ software at 0 and 10 min post-LPS stimulation (0 min, black circle; 10 min, red circle). The fluorescent intensity per cell, representing the polySia expression level, was divided into 20 different degrees from dark to bright, and the cell number for each degree of intensity was plotted.
Identification of Endogenous Neu1 as the Induced Extracellular Sialidase
To determine the sialidase species involved in the rapid turnover of polySia, we focused on Neu1 and Neu4 because of their known substrate specificity (19, 35). Ra2 cells in which Neu1 or Neu4 was knocked down (Neu1 KD or Neu4 KD) to ∼80 and ∼70%, respectively, were successfully prepared using siRNA (Fig. 4A). The surfaces of Neu1 KD and Neu4 KD cells were immunostained with anti-Neu1 and anti-Neu4 antibodies, respectively, before and after LPS stimulation. Cell-surface Neu1 staining was not observed at baseline; however, immediately after LPS simulation, the staining was found to appear and accumulate in the restricted region (Fig. 4B, control, LPS 0 min and 10 min, Neu1). Cell-surface Neu1 staining after LPS treatment was not observed for Neu1 KD cells (Fig. 4B, Neu1 KD, LPS 0 min and 10 min, Neu1). On the other hand, Neu4 staining was constitutively observed on the cell surface, and no obvious changes were observed before or after LPS stimulation (Fig. 4B, control, LPS 0 min and 10 min, Neu4). As expected, the cell-surface Neu4 staining disappeared for Neu4 KD cells (Fig. 4B, Neu4 KD, LPS 0 min and 10 min, Neu4), and the cell-surface localization of Neu1 was not inhibited (Fig. 4B, Neu4 KD, LPS 0 min and 10 min, Neu1).
FIGURE 4.

Extracellularly released Neu1 is responsible for the LPS-induced clearance of polySia in Ra2 cells. A, Ra2 cells transfected with Neu1-, Neu4-, and control siRNAs were collected, and cDNAs were prepared. RT-PCR (25 cycles) was performed to amplify the mRNA for Neu1, Neu4, and GAPDH. cDNA from total RNAs derived from Neu1 KD, Neu4 KD, and control cells were used as templates. The amplified products were separated on 1% agarose gels (left panel). The quantitative data were shown in the right panel. B, LPS-induced clearance of polySia and localization changes of Neu1 and Neu4 on Neu1 KD (Neu1 KD), Neu4 KD (Neu4 KD), or control KD cells (Control). Cells before (LPS 0 min) or 10 min after LPS stimulation (LPS 10 min) were double immunostained with 12E3 (polySia, green) and anti-Neu1 antibody (Neu1, red) or 12E3 (polySia, green) and anti-Neu4 antibody (Neu4, red). C, transient increase of sialidase activity in culture medium and cell lysate after LPS stimulation in Neu1 KD (●, ○), Neu4 KD (▴, ▵), and control KD cells (■, □). The culture medium (■, ●, ▴) and cell lysate (□, ▵, ○) prepared before or 10, 30, 60, and 120 min after LPS stimulation were analyzed for sialidase activity to 4MU-Neu5Ac at pH 4.5 and 7.2. The bars represent S.D. for independent triplicate experiment. ** indicates p < 0.01 (pH 7.2, Culture medium, Neu1 KD versus control KD: p = 0.0092. Student's t test; pH 4.5, lysate, Neu1 KD versus control KD: p = 0.0072). * indicates p < 0.05 (pH 4.5, lysate, Neu4 KD versus control KD: p = 0.016).
We also analyzed the sialidase activity in the culture medium of Neu4 KD cells and detected nearly the same activity as that of the parental Ra2 cells. Notably, sialidase activity in the cell culture medium at pH 4.5 and 7.2 was clearly absent for Neu1 KD cells (Fig. 4C, Neu1KD) but not for control cells. Taken together, the data indicated that Neu1 was involved in the rapid clearance of polySia. This is the first example of extracellular sialidase activity attributable to Neu1.
Extracellular Neu1 Is Present on Extracellular Vesicles (EVs)
The Neu-1 sialidase is known to be very unstable in the free form and likely stabilized in vivo by a membrane-associated complex. To investigate the mechanism by which Neu1 is transported to the extracellular space in a functionally active form, we thus first focused on EVs (36) from COS7 cells exogenously transfected with a rat Neu1 gene because COS7 cells are well established cells for EVs studies (36). Culture medium of COS7 cells transiently transfected with pcDNA3.1-Neu1 (COS7-Neu1) or pcDNA3.1 (COS7-Mock) was divided into CM-ppt (EV) and CM-sup (non-EV) fractions and analyzed for sialidase activity with 4MU-Neu5Ac. Neu1 activity in the CM-ppt (EV) fraction was observed at pH 4.5, which is the optimal pH of Neu1, and a significant level of sialidase activity in the CM-ppt (EV) fraction was also observed at pH 7.2, which is the physiological pH in the extracellular environment (Fig. 5A). However, no obvious sialidase activity from the CM-ppt (EV) fraction derived from COS7-Mock cells was observed. In addition, the sialidase activities in the CM-ppt (EV) fractions at pH 4.5 and 7.2 were 60–80% suppressed in the presence of exogenously added Neu1-specific sialidase inhibitor GSC-649 (37) at one-third of the IC50 concentration (3.3 μm; Fig. 5B).
FIGURE 5.

Extracellular Neu1 is associated with exosomes in COS-7 cells expressing Neu1. A, sialidase activity in culture medium derived from COS-7 cells transfected with rat Neu1 (rNeu1) or mock plasmids (mock). Culture medium was collected after 48 h of cell culture, separated into two fractions (CM-sup and CM-ppt (EV)) by ultracentrifugation, and analyzed for sialidase activity to 4MU-Neu5Ac at pH 4.5 and 7.2. The bars represent S.D. for independent triplicate experiments. *** indicates p < 0.001 (pH 4.5, p = 0.000068. Student's t test). *, indicates p < 0.05 (pH 7.2, p = 0.029. Student's t test). B, inhibition of sialidase activity in CM-ppt (EV) with the rNeu1-specific inhibitor GSC-649. Sialidase activity of the CM-ppt (EV) obtained from Neu1-transfected COS-7 cells was measured in the absence (black bar) or presence of 3.3 μm GSC-649 (gray bar) at pH 4.5 and 7.2. Structure of GSC-649 and its IC50 values for Neu1 to 4 are shown. The bars represent S.D. for independent triplicate experiments. * indicates p < 0.05 (pH 4.5, p = 0.0175. Student's t test). C, Western blotting of cell lysate, CM-sup, and CM-ppt (EV) fractions from rNeu1-transfected COS-7 cells. The fractions were subjected to SDS-PAGE using 10% polyacrylamide gels and immunoblotted with anti-Neu1 (IB: anti-Neu1) or anti-CD9 antibodies (IB: CD9) followed by staining with appropriate secondary antibodies. Molecular weight markers are shown on the left of the panel. D, localization of extracellular Neu1 in rafts from cell lysate and exosomal fractions of CM-ppt (EV). Western blotting was performed for each fraction obtained by sucrose density gradient centrifugation of cell lysate and CM-ppt (EV) with anti-Neu1 antibody. E, topological localization of extracellular Neu1 in CM-ppt (EV) using a surface biotinylation method. The CM-ppt (EV) fractions derived from mock- and rNeu1-transfected cells were biotinylated, and rNeu1 was then immunopurified by IP with anti-Neu1 antibody and subjected to Western blotting using anti-Neu1 or streptavidin. The molecular weight of each component is shown by the bar indicating size.
To confirm the presence of Neu1 protein in the CM-ppt (EV) fraction, Western blotting was performed with a Neu1-specific antibody. Neu1-specific bands of 44, 46, and 48 kDa were detected in the lysate of cells transfected with Neu1 plasmid. Neu1 bands of 48, 46, 44, and 42 kDa were also observed in the CM-ppt (EV) fraction obtained from COS7-Neu1 cells, and no obvious bands were found in similar fractions from COS7-Mock cells (Fig. 5C). In addition, CD9, a specific marker of EVs, was confirmed in the CM-ppt fraction, and Neu1 and CD9 bands were not observed in the CM-sup. Furthermore, we subjected the CM-ppt (EV) fraction from cell culture medium to sucrose-gradient ultracentrifugation. Neu1 from the membrane fraction derived from COS7-Neu1 cells was observed at fraction positions 4 and 5, which are known as lipid raft fractions (Fig. 5D, upper panel) (38). In contrast, Neu1 protein from CM-ppt (EV) fractions derived from COS-7-Neu1 cells was observed at fraction positions 3 and 4, which are lighter fractions than those containing lipid rafts and are typical of EVs, particularly those that function as exosomes (Fig. 5D, lower panel) (30). To determine if Neu1 existed on the outside of EVs, the surface of EVs within CM-ppt (EV) was biotinylated, and Neu1 was immunopurified with an anti-Neu1 antibody bound to Sepharose. After surface biotinylation, immunopurification of Neu1 protein was confirmed by detection with anti-Neu1 antibody (Fig. 5E). The immunoprecipitated proteins by anti-Neu1 antibody from biotinylated CM-ppt were detected at 42–48-kDa smear bands by biotin-specific binding protein, streptavidin, and 42–48-kDa bands were also detected with anti-Neu1 antibody. This smear could not be observed from the biotinylated CM-ppt from Mock transfectant cells (Fig. 5E). All these data indicate that Neu1 is present on the surface of EVs accessible for the cell-surface sialoglycoconjugates.
A Role for Raft Formation in the Secretion of Extracellular Neu1
We next analyzed the secretion of endogenous Neu1 sialidase by Ra2 cells before and after LPS stimulation. After stimulation of Ra2 cells with LPS, EV fractions were collected and subjected to Western blotting with anti-Neu1 antibody, revealing the presence of Neu1 protein in bands at 42, 61, 71, and 100 kDa in the CM-ppt (EV) fraction (Fig. 6A, CM-ppt, Neu1). After LPS stimulation, the Neu1 band transiently increased in intensity at 10 min and extensively decreased at 60 min. The EV marker CD63 (40) displayed the same profile, indicating that extracellular Neu1 from Ra2 cells is present on EVs. The presence of two proteins known to associate with intracellular Neu1, β-galactosidase and protease protective protein A (PPCA), was also analyzed in the CM-ppt (EV) fraction. Although bands corresponding to β-galactosidase were observed at 61-, 71-, and 100-kDa, PPCA was not observed in this fraction (Fig. 6A, IB: β-galactosidase (Gal'ase) and PPCA). Thus, EVs contain lysosomal glycosidase complex components Neu1 and β-galactosidase without PPCA. Neu1 was not detected in CM-sup from Ra2 cells same as that derived from COS-7 cells (Fig. 5C).
FIGURE 6.

Extracellular Neu1 is secreted as an exosomal component without associating with the lysosomal component PPCA. A, Western blotting of the CM-ppt (EV) fraction obtained from Ra2 cells with anti-Neu1 (IB: Neu1), anti-β-galactosidase (IB: β-galactosidase (Gal'ase)), anti-PPCA (IB: PPCA), and anti-CD63 (IB: CD63) antibodies. The CM-ppt (EV) fraction was prepared from culture medium before and 10 and 60 min after LPS stimulation of cells. The molecular mass of each component is shown by the bar indicating size. P, cell homogenate used as positive control. Western blotting of the CM-sup obtained from culture medium before and 10 min after LPS stimulation of Ra2 cells using anti-Neu1 (IB: Neu1) was shown. B, sialidase activity in culture medium prepared from Ra2 cells before and 10, 30, and 60 min after LPS stimulation in the absence (no pretreatment, ●) or presence of MBCD (■) or DMA (▴). The activity to 4MU-Neu5Ac was measured at pH 4.5 and 7.2. The bar represents S.D. for triplicate experiments. *** indicates p < 0.001 (pH 4.5, p = 0.00029; pH 7.2, p = 0.00029 CD versus no treatment, Student's t test). ** indicates p < 0.01 (pH 4.5, p = 0.0033 DMA versus no treatment, Student's t test). * indicates p < 0.05(pH 7.2, p = 0.041, DMA versus no treatment, Student's t test). C, clearance of polySia and localization changes of Neu1 on Ra2 cells in the absence (No) or presence of inhibitors for raft (MBCD) or exosome formation (DMA). Cells before (LPS 0 min) and 10 min after LPS stimulation (LPS 10 min) were double immunostained with 12E3 (polySia, green) and anti-Neu1 antibody (Neu1, red). The nuclei were stained with DAPI.
To investigate the secretion mechanism, we examined effects of the two well used EV secretion inhibitors MBCD (an inhibitor of raft formation (41, 42) and DMA (an inhibitor of H+/Na+ and H+/Ca2+ ion exchangers (43)) on the extracellular sialidase activity. The sialidase activity in the culture medium was clearly inhibited after MBCD addition and reduced after DMA addition (Fig. 6B). Cell-surface staining of Neu1 after LPS stimulation was slightly reduced in the presence of DMA but was clearly inhibited by MBCD (Fig. 6C, MBCD and DMA, Neu1). The cell-surface staining of polySia after LPS stimulation remained unchanged in the presence of MBCD (Fig. 6C, MBCD, polySia (PSA)), although it was undetectable in the presence of DMA (Fig. 6C, DMA, polySia). Together, these results indicate that Neu1 is transported via lipid rafts to specific cell-surface regions in activated microglia. Thus blocking lipid raft formation by MBCD leads to complete ablation of cell-surface polySia turnover during inflammatory stimulation. The mechanism by which LPS stimulation leads to rapid mobilization of Neu1 lipid rafts to the specific cell-surface region and to secretion as Neu1 EVs into the extracellular space requires further study.
PolySia Captures BDNF, Which Is Released via Degradation of PolySia by Neu1
Recently, we demonstrated that polySia binds neurobiologically active molecules, such as BDNF, FGF2, and neurotransmitters (8, 9, 11). Here, we first attempted to confirm if polySia on microglia also captures BDNF. After exogenous sialidase treatment of Ra2 cells, BDNF was released at higher levels than those from non-treated cells, and nearly the same amounts of BDNF were released after Endo-N treatments (Fig. 7A), indicating that cell-surface polySia chains capture endogenous BDNF that are released by degradation of the polySia. We next examined if BDNF is released by the rapid degradation of polySia after LPS stimulation under physiological conditions. We measured the levels of BDNF before and after LPS stimulation and found that BDNF in the cell culture medium increased 10 min after LPS stimulation and that this increase was inhibited in the presence of Neu5Ac2en (Fig. 7B).
FIGURE 7.

BDNF release from Ra2 cells is enhanced by LPS-induced extracellular Neu1 but inhibited by polyNeu5Gc on Neu5Gc-fed Ra2 cells. A, BDNF release by Endo-N. The amounts of BDNF in cell culture medium before (−) and after Endo-N or bacterial exo-sialidase treatments (S'ase) were analyzed. The bar represents S.D. for triplicate independent experiments. * indicates p < 0.05 (sialidase, p = 0.019; Endo-N, p = 0.028, Student's t test). B, enhanced release of BDNF by LPS-induced extracellular Neu1. Cells were stimulated with LPS in the absence (●) or presence (■) of the sialidase inhibitor Neu5Ac2en. Culture media were collected before and 10, 30, and 60 min after LPS stimulation, and the levels of BDNF were quantified by sandwich ELISA. Extracellular BDNF is shown as the amount relative to that before stimulation, which was set as 1.0. The bar represents S.D. for triplicate independent experiments. * indicates p < 0.05 (Neu5Ac2en(−) versus (+) at 10 min, p = 0.011, Student's t test). C, time course of rNeu1 sialidase reaction toward polyNeu5Ac, polyNeu5Gc (60%), and polyNeu5Gc (95%). Released sialic acid at 0, 3, 6, 12, and 24 h after rNeu1 digestion was analyzed by the thiobarbituric acid method. D, inhibition of the LPS-induced rapid clearance of polySia by polyNeu5Gc residues ectopically expressed on Ra2 cells. Cells were cultured for 2 days in the absence (No) or presence of 2 mm Neu5Gc (Neu5Gc) and were then immunostained with 12E3 (anti-polyNeu5Ac) or 2-4B (anti-polyNeu5Gc) before (LPS (−)) and 10 min after LPS stimulation (LPS (+)). E, enhanced release of BDNF by LPS-induced extracellular Neu1 is inhibited on Neu5Gc-fed Ra2 cells. Cells cultured for 2 days in the absence (●) or presence (■) of 2 mm Neu5Gc were stimulated with LPS. Culture media were collected before and 10, 30, and 60 min after LPS stimulation, and the levels of BDNF were quantified by sandwich ELISA. The bar represents S.D. for triplicate independent experiments. * indicates p < 0.05 (Neu5Gc treat versus no treat at 10 min, p = 0.019, Student's t test).
Degradation of polySia and BDNF Release Is Blocked by Adding One Oxygen Atom to PolySia
The non-neural sialic acid Neu5Gc differs from the neural sialic acid Neu5Ac by the addition of a single oxygen atom. Recently, it was shown that α2–8-linked Neu5Gc residues introduced into polySia were markedly resistant to lysosomal preparations containing Neu1 activity (44). To determine if switching from Neu5Ac to Neu5Gc affects the release from BDNF from polySia, we first analyzed the specificity of Neu1 toward three chemically synthesized polySia species: polyNeu5Ac, polyNeu5AcNeu5Gc, and polyNeu5Gc (44). Although Neu1 could effectively degrade polyNeu5Ac, polyNeu5Gc was highly resistant to Neu1 activity during a 4-h incubation. PolyNeu5AcNeu5Gc also displayed resistance to Neu1 activity compared with polyNeu5Ac (Fig. 7C), indicating that polySia chains containing Neu5Gc are resistant to the Neu1 activity in the EVs. This is consistent with the result reported previously (44).
We next investigated if Neu5Gc residues from exogenously added Neu5Gc are metabolically incorporated into naturally occurring polySia chains on Ra2 cells in the presence of exogenously added Neu5Gc. Indeed as compared with normal conditions, polySia staining with an anti-oligo/polyNeu5Gc-specific antibody, 2-4B (29), was elevated. In contrast, staining with the anti-polyNeu5Ac antibody 12E3 was not detected (Fig. 7D, LPS(−)). After LPS simulation, the levels of cell-surface polyNeu5Gc on Neu5Gc-treated cells remained significantly high compared with those of polyNeu5Ac on cells incubated with Neu5Ac or under normal conditions (Fig. 7D, LPS(+)). Thus, polySia chains containing Neu5Gc residues are resistant to turnover after LPS stimulation.
BDNF binds equally well to polyNeu5Gc as it does to polyNeu5Ac (8). Thus, BDNF release from Ra2 cells was measured before and after incubation with Neu5Gc. Under these conditions, BDNF released by LPS stimulation was inhibited compared with normal conditions (Fig. 7E), indicating that exogenous Neu5Gc imparted resistance to the Neu1-mediated degradation of polySia and impaired polySia function, particularly the release of biologically active molecules induced by sialidase activity.
Discussion
Neu1 is a Sia-catabolic enzyme that is predominantly localized in lysosomes (45). However, a portion of total Neu1 migrates to the plasma membrane after certain types of stimulation, such as that induced by T-cell activation or LPS activation of TLR4 (15). Based on the fact that Neu1 co-presents with CD63 or CD9, which are EV-specific markers (36) (Figs. 6A and Fig. 5), in the low density (1.13–1.19 g/ml) membrane fraction (Fig. 5D) (30, 36), Neu1 was for the first time confirmed in this study to be localized on EVs, collectively referring to exosomes, activation- or apoptosis-induced microvesicles, and apoptotic bodies (36). Interestingly, the secretion of Neu1 was inhibited by the cholesterol-chelating reagent MBCD, which disturbs lipid raft formation completely (Fig. 6, B and C). On the other hand, an effect of DMA, another inhibitor of EVs secretion, showed lower but significant effects on the inhibition of the secretion. The different inhibition levels of these two reagents might come from the different inhibition mode of the secretion of EVs. This finding suggests that Neu1 on EVs is regulated by raft formation. After stimulation of microglial cells, Neu1 was rapidly recruited to a specific area on the plasma membrane (Fig. 6C). It is noteworthy that lipid rafts in macrophage are remodeled within 15 min after LPS stimulation (47). Based on these phenomena, the Neu1-restricted area in the plasma membrane might function as a platform for endosome conversion to EVs. Secreted Neu1 on EVs was present as a 42-kDa molecule and was not accompanied by the stabilizing protein PPCA (45), which usually coexists with Neu1 in lysosomes. The complex of Neu1, β-galactosidase, and PPCA migrates to lysosomes from endosomes, and Neu1 and β-galactosidase may then migrate to EVs from endosomes via the plasma membrane. As Neu1 did not form a complex with PPCA in EVs, it appears that sialidase activity can be transiently regulated due to its intrinsic instability.
The optimal pH for Neu1 activity is ∼4.5 (19). Here, Neu1 secreted from microglial cells exhibited the highest activity at pH 4.5, but a significant amount of activity was also confirmed at pH 7.2, which represents the pH of the extracellular environment. PolySia has a low pKa (∼2.9), and the immediate environment on a cell surface covered by polySia might be at a lower pH than 7.2. If so, the degradation of Sia residues from sialoglycoconjugates by secreted sialidase would be more effective. As deuterostome-lineage animal cells have Sia present on the non-reducing terminal end of glycan chains, Sia appears to play important roles in cell proliferation, cell adhesion, and receptor-ligand interactions (1). In addition, the presence or absence of Sia moieties on glycoconjugates likely influences the clearance rate of proteins. The transient secretion of sialidase might serve as on-off switch of the signal involved in the Sia-mediated interaction. In this regard, it is noteworthy that Siglec-11 is found in human microglial cells and can bind to oligosialic acids resulting from cleavage of polySia (48, 49).
Neu1 has low activity toward Neu5Gc compared with Neu5Ac (44). Neu5Gc residues are not present in humans due to a genetic mutation (50) but are found in other mammals studied to date with the exception of the brain, where Neu5Gc residues have not been detected (51). It is not known why Neu5Gc residues are excluded from the brain. In this study microglia were shown to metabolically incorporate exogenously added Neu5Gc into polySia chains, which subsequently gain resistance to sialidase digestion. In addition, the release of BDNF from Neu5Gc-containing polySia through the action of secreted sialidase was shown to decrease. From these results, it appears that the incorporation of Neu5Gc into polySia or other sialoglycoconjugates, which are susceptible to degradation by sialidases (Fig. 8), would potentially impair normal brain function, including neural plasticity and development, for which polySia plays an integral role (7, 52). Such toxicity of Neu5Gc for brain function may be the reason for its exclusion from cell-surface expressed polySia chains in all animals.
FIGURE 8.

Proposed mechanism of exovesicular sialidase-driven rapid polySia degradation and neurotrophin/cytokine release. EV Neu1 sialidase is secreted from microglial cells after activation, such as inflammatory stimulation, and acts on polySia (sky blue beads) or Sia-containing glycoconjugates on the same cell (cis-action) or on surrounding cells (trans-action) to undergo rapid clearance of Sia residues on the surface. In Ra2 cells, upon an EV Neu1-driven polySia clearance, BDNF retained by polySia is released, which may render it to fulfill neurotrophic effects. Neu5Gc residues (red circle) incorporated in the polySia chains make polySia resistant to EV Neu1 and extensively slow down the polySia degradation/BDNF release, leading to abrogation of neurotrophic effects.
Microglia are well characterized immune cells in the central nervous system and are involved in the maintenance of brain cells via the secretion of various trophic factors and enzymes and phagocytotic activity (53). In addition, microglia are involved in the development of neurological diseases, such as Alzheimer disease and multiple sclerosis (54). Recently, microglia have been demonstrated to function not only as immune cells in the brain but also to play roles in postnatal development, adult neural plasticity, and circuit function (55). In the present study, the rapid and transient secretion of sialidase from microglia cells was demonstrated, and the activity was shown to modify cell-surface Sia on sialoglycoconjugates in both the cis and trans modes (Figs. 2, 3, and 7). As polySia is a well known to be intimately related to brain development, neural plasticity, and even neurological diseases such as schizophrenia (11), the rapid degradation of polySia by extracellular sialidase secreted from microglia or other polySia-bearing cells might be involved in modulating adult neural plasticity. Interestingly, cocaine administration results in dramatic reduction of polySia with concomitant activation of microglia (46), suggesting that cocaine mimics LPS in its induction of the Neu1-catalyzed trimming.
PolySia was also recently shown to possess the novel ability to bind neurotrophic factors, such as BDNF and other growth factors, and to regulate their display to cognate receptors (8, 9, 11). As the transient secretion of sialidase from microglial cells regulates the release of BDNF from polySia chains (Fig. 7, A and B), this may be one mechanism to control the supply of neurotrophic factors to cells or tissues that require such factors for repair or other neurobiological functions (Fig. 8). The sialidase-mediated secretion of BDNF from polySia chains might allow the supply of these neurotrophic factors to a large tissue area simultaneously, for example, a tissue area injured by inflammation. As microglia are reported to produce local trophic gradients that stimulate axonal sprouting (39), it is possible that BDNF gradients are generated by sialidases secreted from microglial cells.
Note Added in Proof
Figs. 1A and 5E contained errors in the version of this article that was published on March 6, 2015 as a Paper in Press. Specifically, the same images were used to represent the results of different experiments in Fig. 1A, and Fig. 5E did not show the borders between images from separate lanes on the same immunoblots. The duplicate images in Fig. 1A have been replaced with the correct images, and Fig. 5E has been revised to conform with JBC policies regarding figures assembled from separate images. These corrections do not affect the interpretation of the results or the conclusions.
This work was supported, in whole or in part, by National Institutes of Health Grant R01GM32373 (to O. P. and A. V.). This work was also supported in part by Grants-in-aid for Scientific Research (C) (23570133) and Scientific Research on Innovative Areas (23110002, Deciphering sugar chain-based signals regulating integrative neural functions) (24110506 and 26110708) from the Ministry of Education, Science, Sports, and Culture and the Hayashi Foundation (to C. S.) and CREST of Japan Science and Technology Agency and the Naito Foundation Subsidy for Promotion of Specific Research Projects (to K. K.).
- polySia
- polysialic acid
- diSia
- disialic acid
- NCAM
- neural cell adhesion molecule
- BDNF
- brain-derived neurotrophic factor
- Endo-N
- endo-N-acylneuraminidase
- MBCD
- methyl-β-cyclodextrin
- DMA
- dimethyl amiloride
- EV
- extracellular vesicle
- PPCA
- protease protective protein A
- IP
- immunoprecipitation
- IB
- immunoblot
- CM
- culture medium
- 4MU
- 4-methylumbelliferone
- Neu
- neuraminidase
- Neu5Ac
- N-acetylneuraminic acid
- Neu5Gc
- N-glycolylneuraminic acid.
References
- 1. Angata T., Varki A. (2002) Chemical diversity in the sialic acids and related α-keto acids: an evolutionary perspective. Chem. Rev. 102, 439–469 [DOI] [PubMed] [Google Scholar]
- 2. Schwarzkopf M., Knobeloch K. P., Rohde E., Hinderlich S., Wiechens N., Lucka L., Horak I., Reutter W., Horstkorte R. (2002) Sialylation is essential for early development in mice. Proc. Natl. Acad. Sci. U.S.A. 99, 5267–5270 [DOI] [PMC free article] [PubMed] [Google Scholar]
- 3. Crocker P. R., Paulson J. C., Varki A. (2007) Siglecs and their roles in the immune system. Nat. Rev. Immunol. 7, 255–266 [DOI] [PubMed] [Google Scholar]
- 4. Liu F. T., Rabinovich G. A. (2010) Galectins: regulators of acute and chronic inflammation. Ann. N.Y. Acad. Sci. 1183, 158–182 [DOI] [PubMed] [Google Scholar]
- 5. Sato C., Kitajima K. (2013) Disialic, oligosialic and polysialic acids: distribution, functions, and related disease. J. Biochem. 154, 115–136 [DOI] [PubMed] [Google Scholar]
- 6. Colley K. J., Kitajima K., Sato C. (2014) Polysialic acid: biosynthesis, novel functions and applications. Crit. Rev. Biochem. Mol. Biol. 49, 498–532 [DOI] [PubMed] [Google Scholar]
- 7. Rutishauser U. (2008) Polysialic acid in the plasticity of the developing and adult vertebrate nervous system. Nat. Rev. Neurosci. 9, 26–35 [DOI] [PubMed] [Google Scholar]
- 8. Kanato Y., Kitajima K., Sato C. (2008) Direct binding of polysialic acid to a brain-derived neurotrophic factor depends on the degree of polymerization. Glycobiology 18, 1044–1053 [DOI] [PubMed] [Google Scholar]
- 9. Ono S., Hane M., Kitajima K., Sato C. (2012) Novel regulation of FGF2-mediated cell growth by polysialic acid. J. Biol. Chem. 287, 3710–3722 [DOI] [PMC free article] [PubMed] [Google Scholar]
- 10. Arai M., Yamada K., Toyota T., Obata N., Haga S., Yoshida Y., Nakamura K., Minabe Y., Ujike H., Sora I., Ikeda K., Mori N., Yoshikawa T., Itokawa M. (2006) Association between polymorphisms in the promoter region of the sialyltransferase 8B (SIAT8B) gene and schizophrenia. Biol. Psychiatry 59, 652–659 [DOI] [PubMed] [Google Scholar]
- 11. Isomura R., Kitajima K., Sato C. (2011) Structural and functional impairments of polysialic acid by a mutated polysialyltransferase found in schizophrenia. J. Biol. Chem. 286, 21535–21545 [DOI] [PMC free article] [PubMed] [Google Scholar]
- 12. Hane M., Sumida M., Kitajima K., Sato C. (2012) Structural and functional impairments of polySia-NCAM synthesized by a mutated polysialyltransferase of a schizophrenic patient. Pure Appl. Chem. 84, 1895–1906 [Google Scholar]
- 13. Meesmann H. M., Fehr E. M., Kierschke S., Herrmann M., Bilyy R., Heyder P., Blank N., Krienke S., Lorenz H. M., Schiller M. (2010) Decrease of sialic acid residues as an eat-me signal on the surface of apoptotic lymphocytes. J. Cell Sci. 123, 3347–3356 [DOI] [PubMed] [Google Scholar]
- 14. Arar S., Chan K. H., Quinn B. A., Waelchli R. O., Hayes M. A., Betteridge K. J., Monteiro M. A. (2007) Desialylation of core type 1 O-glycan in the equine embryonic capsule coincides with immobilization of the conceptus in the uterus. Carbohydr. Res. 342, 1110–1115 [DOI] [PubMed] [Google Scholar]
- 15. Nan X., Carubelli I., Stamatos N. M. (2007) Sialidase expression in activated human T lymphocytes influences production of IFN-γ. J. Leukoc. Biol. 81, 284–296 [DOI] [PubMed] [Google Scholar]
- 16. Azuma Y., Sato H., Higai K., Matsumoto K. (2007) Enhanced expression of membrane-associated sialidase Neu3 decreases GD3 and increases GM3 on the surface of Jurkat cells during etoposide-induced apoptosis. Biol. Pharm. Bull. 30, 1680–1684 [DOI] [PubMed] [Google Scholar]
- 17. Vilcaes A. A., Demichelis V. T., Daniotti J. L. (2011) Trans-activity of plasma membrane-associated ganglioside sialyltransferase in mammalian cells. J. Biol. Chem. 286, 31437–31446 [DOI] [PMC free article] [PubMed] [Google Scholar]
- 18. Monti E., Bonten E., D'Azzo A., Bresciani R., Venerando B., Borsani G., Schauer R., Tettamanti G. (2010) Sialidases in vertebrates: a family of enzymes tailored for several cell functions. Adv. Carbohydr. Chem. Biochem. 64, 403–479 [DOI] [PubMed] [Google Scholar]
- 19. Miyagi T., Yamaguchi K. (2012) Mammalian sialidases: physiological and pathological roles in cellular functions. Glycobiology 22, 880–896 [DOI] [PubMed] [Google Scholar]
- 20. Flori F., Secciani F., Capone A., Paccagnini E., Caruso S., Ricci M. G., Focarelli R. (2007) Menstrual cycle-related sialidase activity of the female cervical mucus is associated with exosome-like vesicles. Fertil. Steril. 88, 1212–1219 [DOI] [PubMed] [Google Scholar]
- 21. Jansen A. J., Josefsson E. C., Rumjantseva V., Liu Q. P., Falet H., Bergmeier W., Cifuni S. M., Sackstein R., von Andrian U. H., Wagner D. D., Hartwig J. H., Hoffmeister K. M. (2012) Desialylation accelerates platelet clearance following refrigeration and initiates GPIbα metalloproteinase-mediated cleavage in mice. Blood 119, 1263–1273 [DOI] [PMC free article] [PubMed] [Google Scholar]
- 22. Wang Y., Neumann H. (2010) Alleviation of neurotoxicity by microglial human Siglec-11. J. Neurosci. 30, 3482–3488 [DOI] [PMC free article] [PubMed] [Google Scholar]
- 23. Suzumura A., Sawada M., Takayanagi T. (1998) Production of interleukin-12 and expression of its receptors by murine microglia. Brain Res. 787, 139–142 [DOI] [PubMed] [Google Scholar]
- 24. Imai F., Suzuki H., Oda J., Ninomiya T., Ono K., Sano H., Sawada M. (2007) Neuroprotective effect of exogenous microglia in global brain ischemia. J. Cereb. Blood Flow Metab. 27, 488–500 [DOI] [PubMed] [Google Scholar]
- 25. Sawada M., Imai F., Suzuki H., Hayakawa M., Kanno T., Nagatsu T. (1998) Brain-specific gene expression by immortalized microglial cell-mediated gene transfer in the mammalian brain. FEBS Lett. 433, 37–40 [DOI] [PubMed] [Google Scholar]
- 26. Paresce D. M., Ghosh R. N., Maxfield F. R. (1996) Microglial cells internalize aggregates of the Alzheimer's disease amyloid β-protein via a scavenger receptor. Neuron 17, 553–565 [DOI] [PubMed] [Google Scholar]
- 27. Hallenbeck P. C., Vimr E. R., Yu F., Bassler B., Troy F. A. (1987) Purification and properties of a bacteriophage-induced endo-N-acetylneuraminidase specific for poly-α-2,8-sialosyl carbohydrate units. J. Biol. Chem. 262, 3553–3561 [PubMed] [Google Scholar]
- 28. Sato C., Kitajima K., Inoue S., Seki T., Troy F. A, 2nd, Inoue Y. (1995) Characterization of the antigenic specificity of four different anti-(α 2→8-linked polysialic acid) antibodies using lipid-conjugated oligo/polysialic acids. J. Biol. Chem. 270, 18923–18928 [DOI] [PubMed] [Google Scholar]
- 29. Sato C., Kitajima K., Inoue S., Inoue Y. (1998) Identification of oligo-N-glycolylneuraminic acid residues in mammal-derived glycoproteins by a newly developed immunochemical reagent and biochemical methods. J. Biol. Chem. 273, 2575–2582 [DOI] [PubMed] [Google Scholar]
- 30. Oshima K., Aoki N., Kato T., Kitajima K., Matsuda T. (2002) Secretion of a peripheral membrane protein, MFG-E8, as a complex with membrane vesicles. Eur. J. Biochem. 269, 1209–1218 [DOI] [PubMed] [Google Scholar]
- 31. Sato C., Fukuoka H., Ohta K., Matsuda T., Koshino R., Kobayashi K., Troy F. A, 2nd, Kitajima K. (2000) Frequent occurrence of pre-existing α 2→8-linked disialic and oligosialic acids with chain lengths up to 7 Sia residues in mammalian brain glycoproteins: prevalence revealed by highly sensitive chemical methods and anti-di-, oligo-, and poly-Sia antibodies specific for defined chain lengths. J. Biol. Chem. 275, 15422–15431 [DOI] [PubMed] [Google Scholar]
- 32. Galuska S. P., Rollenhagen M., Kaup M., Eggers K., Oltmann-Norden I., Schiff M., Hartmann M., Weinhold B., Hildebrandt H., Geyer R., Mühlenhoff M., Geyer H. (2010) Synaptic cell adhesion molecule SynCAM 1 is a target for polysialylation in postnatal mouse brain. Proc. Natl. Acad. Sci. U.S.A. 107, 10250–10255 [DOI] [PMC free article] [PubMed] [Google Scholar]
- 33. Curreli S., Arany Z., Gerardy-Schahn R., Mann D., Stamatos N. (2007) Polysialylated neuropilin-2 is expressed on the surface of human dendritic cells and modulates dendritic cell-T lymphocyte interactions. J. Biol. Chem. 282, 30346–30356 [DOI] [PubMed] [Google Scholar]
- 34. Inoko E., Nishiura Y., Tanaka H., Takahashi T., Furukawa K., Kitajima K., Sato C. (2010) Developmental stage-dependent expression of an α2,8-trisialic acid unit on glycoproteins in mouse brain. Glycobiology 20, 916–928 [DOI] [PubMed] [Google Scholar]
- 35. Takahashi K., Mitoma J., Hosono M., Shiozaki K., Sato C., Yamaguchi K., Kitajima K., Higashi H., Nitta K., Shima H., Miyagi T. (2012) Sialidase NEU4 hydrolyzes polysialic acids of neural cell adhesion molecules and negatively regulates neurite formation by hippocampal neurons. J. Biol. Chem. 287, 14816–14826 [DOI] [PMC free article] [PubMed] [Google Scholar]
- 36. György B., Szabó T. G., Pásztói M., Pál Z., Misják P., Aradi B., László V., Pállinger E., Pap E., Kittel A., Nagy G., Falus A., Buzás E. I. (2011) Membrane vesicles, current state-of-the-art: emerging role of extracellular vesicles. Cell. Mol. Life Sci. 68, 2667–2688 [DOI] [PMC free article] [PubMed] [Google Scholar]
- 37. Magesh S., Moriya S., Suzuki T., Miyagi T., Ishida H., Kiso M. (2008) Design, synthesis, and biological evaluation of human sialidase inhibitors. Part 1: selective inhibitors of lysosomal sialidase (NEU1). Bioorg. Med. Chem. Lett. 18, 532–537 [DOI] [PubMed] [Google Scholar]
- 38. Ohta K., Sato C., Matsuda T., Toriyama M., Lennarz W. J., Kitajima K. (1999) Isolation and characterization of low density detergent-insoluble membrane (LD-DIM) fraction from sea urchin sperm. Biochem. Biophys. Res. Commun. 258, 616–623 [DOI] [PubMed] [Google Scholar]
- 39. Batchelor P. E., Porritt M. J., Martinello P., Parish C. L., Liberatore G. T., Donnan G. A., Howells D. W. (2002) Macrophages and microglia produce local trophic gradients that stimulate axonal sprouting toward but not beyond the wound edge. Mol. Cell Neurosci. 21, 436–453 [DOI] [PubMed] [Google Scholar]
- 40. Mathivanan S., Ji H., Simpson R. J. (2010) Exosomes: extracellular organelles important in intercellular communication. J. Proteomics 73, 1907–1920 [DOI] [PubMed] [Google Scholar]
- 41. Adachi T., Sato C., Kitajima K. (2007) Membrane microdomain formation is crucial in epiboly during gastrulation of medaka. Biochem. Biophys. Res. Commun. 358, 848–853 [DOI] [PubMed] [Google Scholar]
- 42. Chen T., Guo J., Yang M., Zhu X., Cao X. (2011) Chemokine-containing exosomes are released from heat-stressed tumor cells via lipid raft-dependent pathway and act as efficient tumor vaccine. J. Immunol. 186, 2219–2228 [DOI] [PubMed] [Google Scholar]
- 43. Savina A., Furlán M., Vidal M., Colombo M. I. (2003) Exosome release is regulated by a calcium-dependent mechanism in K562 cells. J. Biol. Chem. 278, 20083–20090 [DOI] [PubMed] [Google Scholar]
- 44. Davies L. R., Pearce O. M., Tessier M. B., Assar S., Smutova V., Pajunen M., Sumida M., Sato C., Kitajima K., Finne J., Gagneux P., Pshezhetsky A., Woods R., Varki A. (2012) Metabolism of vertebrate amino sugars with N-glycolyl groups: resistance of α2–8-linked N-glycolylneuraminic acid to enzymatic cleavage. J. Biol. Chem. 287, 28917–28931 [DOI] [PMC free article] [PubMed] [Google Scholar]
- 45. Pshezhetsky A. V., Hinek A. (2011) Where catabolism meets signalling: neuraminidase 1 as a modulator of cell receptors. Glycoconj. J. 28, 441–452 [DOI] [PubMed] [Google Scholar]
- 46. Maćkowiak M., Markowicz-Kula K., Fija†é K., Wedzony K. (2005) Acute and repeated administration of cocaine differentially regulates expression of PSA-NCAM-positive neurons in the rat hippocampus. Brain Res. 1055, 149–155 [DOI] [PubMed] [Google Scholar]
- 47. Dhungana S., Merrick B. A., Tomer K. B., Fessler M. B. (2009) Quantitative proteomics analysis of macrophage rafts reveals compartmentalized activation of the proteasome and of proteasome-mediated ERK activation in response to lipopolysaccharide. Mol. Cell. Proteomics 8, 201–213 [DOI] [PMC free article] [PubMed] [Google Scholar]
- 48. Angata T., Kerr S. C., Greaves D. R., Varki N. M., Crocker P. R., Varki A. (2002) Cloning and characterization of human Siglec-11. A recently evolved signaling molecule that can interact with SHP-1 and SHP-2 and is expressed by tissue macrophages, including brain microglia. J. Biol. Chem. 277, 24466–24474 [DOI] [PubMed] [Google Scholar]
- 49. Sato C. (2004) Chain length diversity of sialic acids and its biological significance. Trends Glycosci. Glycotechnol. 16, 331–344 [Google Scholar]
- 50. Chou H. H., Hayakawa T., Diaz S., Krings M., Indriati E., Leakey M., Paabo S., Satta Y., Takahata N., Varki A. (2002) Inactivation of CMP-N-acetylneuraminic acid hydroxylase occurred prior to brain expansion during human evolution. Proc. Natl. Acad. Sci. U.S.A. 99, 11736–11741 [DOI] [PMC free article] [PubMed] [Google Scholar]
- 51. Varki N. M., Strobert E., Dick E. J., Jr., Benirschke K., Varki A. (2011) Biomedical differences between human and nonhuman hominids: potential roles for uniquely human aspects of sialic acid Biology. Annu. Rev. Pathol. 6, 365–393 [DOI] [PubMed] [Google Scholar]
- 52. Schnaar R. L., Gerardy-Schahn R., Hildebrandt H. (2014) Sialic acids in the brain: gangliosides and polysialic acid in nervous system development, stability, disease, and regeneration. Physiol. Rev. 94, 461–518 [DOI] [PMC free article] [PubMed] [Google Scholar]
- 53. Prinz M., Mildner A. (2011) Microglia in the CNS: immigrants from another world. Glia 59, 177–187 [DOI] [PubMed] [Google Scholar]
- 54. Graeber M. B., Li W., Rodriguez M. L. (2011) Role of microglia in CNS inflammation. FEBS Lett. 585, 3798–3805 [DOI] [PubMed] [Google Scholar]
- 55. Tremblay M. È., Stevens B., Sierra A., Wake H., Bessis A., Nimmerjahn A. (2011) The role of microglia in the healthy brain. J. Neurosci. 31, 16064–16069 [DOI] [PMC free article] [PubMed] [Google Scholar]