

ABSTRACT
Chikungunya virus (CHIKV) is a mosquito-borne arthralgic alphavirus that has garnered international attention as an important emerging pathogen since 2005. More recently, it invaded the Caribbean islands and the Western Hemisphere. Intriguingly, the current CHIKV outbreak in the Caribbean is caused by the Asian CHIKV genotype, which differs from the La Réunion LR2006 OPY1 isolate belonging to the Indian Ocean lineage. Here, we adopted a systematic and comparative approach against LR2006 OPY1 to characterize the pathogenicity of the Caribbean CNR20235 isolate and consequential host immune responses in mice. Ex vivo infection using primary mouse tail fibroblasts revealed a weaker replication efficiency by CNR20235 isolate. In the CHIKV mouse model, CNR20235 infection induced an enervated joint pathology characterized by moderate edema and swelling, independent of mononuclear cell infiltration. Based on systemic cytokine analysis, localized immunophenotyping, and gene expression profiles in the popliteal lymph node and inflamed joints, two pathogenic phases were defined for CHIKV infection: early acute (2 to 3 days postinfection [dpi]) and late acute (6 to 8 dpi). Reduced joint pathology during early acute phase of CNR20235 infection was associated with a weaker proinflammatory Th1 response and natural killer (NK) cell activity. The pathological role of NK cells was further demonstrated as depletion of NK cells reduced joint pathology in LR2006 OPY1. Taken together, this study provides evidence that the Caribbean CNR20235 isolate has an enfeebled replication and induces a less pathogenic response in the mammalian host.
IMPORTANCE The introduction of CHIKV in the Americas has heightened the risk of large-scale outbreaks due to the close proximity between the United States and the Caribbean. The immunopathogenicity of the circulating Caribbean CHIKV isolate was explored, where it was demonstrated to exhibit reduced infectivity resulting in a weakened joint pathology. Analysis of serum cytokine levels, localized immunophenotyping, and gene expression profiles in the organs revealed that a limited Th1 response and reduced NK cells activity could underlie the reduced pathology in the host. Interestingly, higher asymptomatic infections were observed in the Caribbean compared to the La Réunion outbreaks in 2005 and 2006. This is the first study that showed an association between key proinflammatory factors and pathology-mediating leukocytes with a less severe pathological outcome in Caribbean CHIKV infection. Given the limited information regarding the sequela of Caribbean CHIKV infection, our study is timely and will aid the understanding of this increasingly important disease.
INTRODUCTION
Chikungunya virus (CHIKV) is a mosquito-borne virus, belonging to the alphavirus genus of the Togaviridae family. CHIKV is capable of initiating a sustained transmission cycle that relies on Aedes aegypti, Aedes albopictus, and human amplification hosts (1). Infection by CHIKV primarily causes Chikungunya fever, a rheumatic-like disease typically characterized by an abrupt onset of fever, headache, nausea, rash, crippling arthralgia, and myalgia (2, 3). Since the discovery of CHIKV, the occurrence of CHIKV has been sporadic, and transmission was predominantly restricted to rural areas (4). The first notable emergence of CHIKV was during a wave of outbreaks in 2004 in Kenya (5, 6). Since then, CHIKV has gained global attention as a major emerging pathogen in a series of devastating outbreaks across the world, in various locations, including India (7), Indian Ocean islands (4, 8), Africa (9), and many parts of Southeast Asia (10–13). Famously, the 2005-2006 Réunion Island epidemic saw the explosive capacity and swift dissemination CHIKV is capable of, resulting in nearly 40% of the population debilitated, with a total of close to 270,000 reported cases (2, 14, 15).
Phylogenetically, CHIKV strains that cause outbreaks can be traced back to three independent CHIKV lineages that emerged almost simultaneously in different parts of the world, including India and Thailand (9, 10, 16–18). Major CHIKV outbreaks were reported in several islands of the Indian Ocean, India, and several countries in Southeast Asia (2, 3, 7, 8, 14, 15, 19, 20). During the ongoing CHIKV epidemics of the East-Central-South-African (ECSA) genotype, there were major concerns about an inevitable epidemic in the Caribbean and America fueled by the presence of suitable vectors (8) and the lack of herd immunity in the islands of Caribbean and America (21). In the beginning of October 2013, active CHIKV circulation in Saint Martin was detected (22, 23), and characterization of the circulating etiologic strain showed that it belonged to the old Asian lineage (24). In a short span of a year, outbreaks caused more than 1 million suspected or confirmed cases of Chikungunya fever as reported by the Pan America Health Organization (PAHO), with ongoing local transmission and epidemic spread (22, 23, 25).
Current knowledge suggests that CHIKV pathogenesis depends on the interplay of virus replication and host immunity. Studies have shown that CHIKV infection trigger protective innate immune response involving alpha/beta interferon (IFN-α/β) (26, 27), IRF3, IRF7 (28), and TLR3 (29) in cells such as monocytes (28, 29) or fibroblasts (26–30). However, monocytes/macrophages (31, 32) and neutrophils (33) were shown to associate with pathogenic roles since they are one of the major cellular infiltrates into the site of inflammation to cause tissue damage. In addition, recent work in mice on the host adaptive response further showed that CD4+ T cells are the major proinflammatory mediators during the peak of inflammation (34, 35), while antibodies remain the key player for viral resolution from early convalescent phase onward (35, 36). However, since almost all of these studies were conducted using La Réunion isolates of the ECSA clade (26–29, 31–36), it is important to determine whether Caribbean isolates would induce similar immunopathological profiles in infected hosts. The likelihood of a different immunopathology between the La Réunion CHIKV isolate (ECSA clade) and CHIKV from the Asian clade was first suggested in an earlier study using a joint-footpad CHIKV mouse model by Gardner et al. (37), wherein infection with the La Réunion isolate (DQ443544) and QIMR Asian isolate (FJ457921) were compared.
In the present study, we aimed to characterize and compare with the LR2006 OPY1 isolate from La Réunion, the replicative capacity of the Asian-Caribbean CHIKV CNR20235 isolate, and the host response it induces by adopting a systematic approach. We first defined the replicative capacity in ex vivo settings with primary mouse tail fibroblasts (MTFs), before proceeding to define pathogenesis in vivo with the joint-footpad mouse model (37) to further characterize the systemic and localized response in the site of pathology. We found that CNR20235 comparatively displayed a weakened replicative and competitive fitness in vitro. Through immunophenotyping and immunohistochemistry (IHC), CNR20235 triggered a reduced joint pathology in vivo that was associated with reduced edema, a weaker Th1 and proinflammatory response both systemically and locally in the joints, and limited natural killer (NK) cell activity. These observations suggest a debilitated phenotype in the Caribbean CNR20235 CHIKV.
MATERIALS AND METHODS
Sequence alignment.
The nucleotide and protein sequences of LR2006 OPY1 were first obtained from GenBank database. Sequence alignments of the CNR20235 and LR2006 OPY1 (DQ443544) isolates were determined using the CLUSTAL W algorithm in MegAlign (DNAStar, Inc., Madison, WI).
Mice.
Three-week-old female wild-type (WT) C57BL/6J mice were used. All mice were bred and kept under specific-pathogen-free conditions in the Biological Resource Centre, Agency for Science, Technology, and Research, Singapore. All experiments and procedures were approved by the Institutional Animal Care and Use Committee (IACUC 120714) of the Agency for Science, Technology, and Research, Singapore, in accordance with the guidelines of the Agri-Food and Veterinary Authority and the National Advisory Committee for Laboratory Animal Research of Singapore.
Viruses.
LR2006 OPY1 used here was originally isolated from a French patient returning from Reunion Island during the 2006 outbreak as previously described (38). The CNR20235 used here was originally isolated from a patient in a December 2013 Saint Martin Island, French West Indies, outbreak (24). A low-passage-number virus stock (P2) was used for propagation in C6/36 cells, followed by purification via ultracentrifugation (39), and titers were determined by a standard plaque assay using Vero-E6 cells (32) before in vivo infections.
In vitro infection of MTFs and infectivity quantification.
Primary MTFs were isolated from tails of WT C57BL/6J mice using a previously described method (40), and infections were performed with both LR2006 OPY1 and CNR20235 strains of CHIKV multiplicity of infectivity (MOI) of 1 in serum-free Dulbecco modified Eagle medium (DMEM). Virus overlay was removed after incubation for 1.5 h at 37°C and replenished with fresh DMEM supplemented with 10% fetal bovine serum (FBS). Mock infections were performed in parallel. Infected fibroblasts were harvested at 0, 6, 12, and 24 h postinfection (hpi) for infectivity quantification. The degree of infection was quantified by flow cytometry using a two-step intracellular staining protocol as previously described (32), and data were acquired with BD FACSCanto II flow cytometer (BD Biosciences). Viral RNA was extracted from 140 μl of culture using QIAamp viral RNA kit (Qiagen, catalog no. 52906). Viral load was then determined via quantitative reverse transcription-PCR (qRT-PCR) using previously described methods that detect for CHIKV nsP1 (41) and E1 RNA (32, 42). Due to a nucleotide mutation within the probe's sequence, the detection of CHIKV nsP1 RNA from CNR20235-infected cultures was performed using another probe with the sequence 5′-TGCTTACACACAGATGT-3′ and CNR20235-specific in vitro-transcribed RNA, which was synthesized as previously published (32, 42). In addition, viral quantification was also measured with a plaque assay as previously described (32).
In vitro competition assay.
In vitro competition assay was adapted from (43) to test the replication fitness of respective viruses. Briefly, 5 × 10⁵ Vero E6 cells were seeded onto six wells plate 15 h prior to infection. Cells were coinfected with an initial combined MOI of 0.1 at various initial LR2006 OPY1/CNR20235 ratios (1:1, 1:4, 4:1, 1:99, and 99:1) in 2 ml of DMEM (with 10% FBS). At 48 hpi, the supernatants were harvested. Portions of the supernatants were diluted 20 times for further infection in the next passage, while 140-μl samples of the supernatants were used for viral RNA extraction and LR2006 OPY1- or CNR20235-specific nsP1 quantification by qRT-PCR as described above. The infection was repeated for six passages, and the replicative fitness was assessed from the ratio of LR2006 OPY1 to CNR20235 nsP1 copies in the respective passages.
Virus infection and disease monitoring in mice.
Mice were inoculated subcutaneously in the ventral side of the right hind footpad toward the ankle, with 106 50% tissue culture infective doses (TCID50) CHIKV isolates (in 30 μl of phosphate-buffered saline [PBS]). Viremia was tracked daily from 1 day postinfection (dpi) until 8 dpi and subsequently on every alternate day until 14 dpi. Joint swelling of the footpad was scored daily from 0 to 14 dpi, as previously described (30, 34).
Viral RNA extraction and quantification.
Ten microliters of blood collected from the tail vein was diluted in 120 μl of PBS and 10 μl of citrate-phosphate-dextrose solution (Sigma-Aldrich, catalog no. C7165). Viral RNA was extracted with QIAmp viral RNA kit (Qiagen) in accordance to the manufacturer's protocol. Viral RNA copies were quantified using qRT-PCR, as described previously (39).
Hematoxylin and eosin (H&E) staining and IHC.
Mice were perfused by intracardial injection with PBS, and foot footpad tissues were removed and fixed with 4% paraformaldehyde. Fixed tissues were embedded in paraffin wax, processed to obtain 5-μm-pore-size sections, and subjected to H&E or IHC staining according to established protocols (30). Anti-F4/80 (Abcam, catalog no. ab6640), anti-granzyme B (Abcam, catalog no. ab4059), and anti-CD3 (Abcam, catalog no. ab5690) antibodies were used for IHC.
Quantification of vascular leakiness in joints.
Vascular leakage was quantified by using a Tracer 653 assay (Molecular Targeting Technology, Inc.; catalog no. TR-1001). The Tracer 653 assay was modified from a previously described protocol (44). Briefly, Tracer solution was reconstituted in 1 ml of PBS and injected intravenously into mice. After 1 h, readings were taken using the in vivo imaging system (Perkin-Elmer) at an excitation and emission of 640 and 700 nm, respectively. Images were acquired with a field of view of 21.7 cm, adjusting the exposure time (0.5 to 5 s) to allow imaging within the detection range. Regions of interest were drawn using the software Living Image 3.0, and the average radiance (photons/s/cm2/steradian) was determined.
Multiplex microbead immunoassay.
Cytokine levels in mice sera were measured simultaneously by using a premixed 19-plex Procarta multiplex microbead-based immunoassay (Affymetrix, catalog no. EPX260-26088-901) The 19 cytokines and chemokines assayed include Eotaxin, Groα, IFN-α, IFN-γ, interleukin- 1α (IL-1α), IL-1β, IL-2, IL-4, IL-6, IL-10, IL-12p40, IL-12p70, IP-10, monocyte chemoattractant protein 1 (MCP-1), macrophage inflammatory protein 1α (MIP-1α), MIP-2, RANTES, sRANKL, and tumor necrosis factor alpha (TNF-α). The preparation of samples and reagents and the immunoassay procedures were performed according to the manufacturers' instructions. Data were acquired using a Luminex FlexMap 3D instrument (Millipore) and analyzed using Bio-Plex Manager 6.0 software (Bio-Rad) based on standard curves plotted through a five-parameter logistic curve setting. The levels of interleukin-1β (IL-1β), IL-2, IL-4, IL-10, and IL-12p70, MIP-1α, and MIP-2 were below the detection limit and were excluded from further analysis.
Popliteal lymph node and hind joint footpad cell isolation.
Extracted joints were digested in digestion medium containing dispase (2 U/ml; Invitrogen), collagenase IV (20 mg/ml; Sigma-Aldrich), and DNase I mix (50 mg/ml; Roche Applied Science) in complete RPMI medium, followed by red blood cell (RBC) lysis using RBC lysis buffer (R&D Systems, catalog no. WL2000). Cell debris and skin tissues were removed by passing through 40-μm-pore-size cell strainer and spinning down in 35% (vol/vol) Percoll solution in RPMI (Sigma-Aldrich, catalog no. P1644-1L) prior to staining.
The popliteal lymph node (pLN), which is located at the area to the back of the mice knee joint, was retrieved and incubated in 1 ml of digestion medium containing dispase (2 U/ml), collagenase IV (20 mg/ml), and DNase I mix (50 mg/ml) in complete RPMI medium for 30 min at 37°C. Both pLN and digestion medium were mixed well before passing contents through a nylon mesh cloth (70-μm pore size; Sefar). The RBCs were further lysed prior to additional staining procedures.
Phenotyping of leukocytes.
pLN and footpad cells were washed once in complete medium, and cell pellets were resuspended in blocking buffer (1% [vol/vol] rat and mouse serum) for 20 min. Live cells were determined by staining with a Live/Dead determination dye (Invitrogen) for 30 min before cell-specific marker staining according to the manufacturer's protocol. Staining was performed using allophycocyanin-Cy7-conjugated anti-CD45 (clone 30-F11; BD Biosciences, catalog no. 557659), phycoerythrin-Cy7-conjugated anti-CD3 (clone 145-2C11; BD Biosciences, catalog no. 552774), Pacific Blue-conjugated anti-CD4 (clone RM4-5, BioLegend, catalog no. 100534), allophycocyanin-conjugated anti-CD8 (clone 53-6.7; BioLegend, catalog no. 100711), Pacific Blue-conjugated anti-Ly6G (clone 1A8; BioLegend, catalog no. 127611), phycoerythrin-conjugated anti-CD11b (clone M1/70; eBioscience, catalog no. 12-0112-81), Alexa fluor 700-conjugated anti-MHC-II (clone M5/114.15.2: BioLegend, catalog no. 107621), PerCP-conjugated Ly6C (clone HK1.4; BioLegend, catalog no. 128011), and allophycocyanin-conjugated anti-NK1.1 (clone PK136; eBioscience, catalog no. 175941) antibodies for 20 min at room temperature in two separate panels. After staining, the cells were washed and fixed with 100 μl of IC fixation buffer (eBioscience, catalog no. 00-8222-49) for 5 min. The cells were then washed and resuspended for flow cytometry data acquisition. Data were acquired using an LSR II flow cytometer (BD Biosciences) with BD FACSDiva software, and analyses were performed using FlowJo v9.3.2 software (Tree Star, Inc.).
The following leukocytes were gated from the staining antibodies described above: CD4+ T cells (CD45+/CD3+/CD4+), CD8+ T cells (CD45+/CD3+/CD8+), mature NK cells (CD45+/CD3−/NK1.1+/CD11b+), NKT cells (CD45+/CD3+/NK1.1+), neutrophils (CD45+/CD3−/NK1.1−/Ly6G+/CD11b+), and monocytes/macrophages (CD45+/CD3−/NK1.1−/Ly6G−/CD11b+/Ly6C+).
Total RNA extraction and gene expression.
Mice were anesthetized with ketamine-xylazine (150 mg/kg of ketamine, 10 mg/kg of xylazine) and perfused intracardially with PBS, and organs were harvested and preserved in 1 ml of TRIzol (Invitrogen) at −80°C. The tissue samples were transferred to gentleMACS M tubes (Miltenyi Biotec) and homogenized using a rotor-stator homogenizer (Xiril Dispomix) as previously described (30). Homogenized tissues were transferred to clean Eppendorf tubes, mixed thoroughly with 230 μl of chloroform, and allowed to stand for 2 min in room temperature. Tissue mixtures were centrifuged at 12,000 × g for 10 min at 4°C. The aqueous phase was collected into a clean Eppendorf tube, and an equal volume of 70% ethanol was added in and mixed. The total RNA for the gene expression studies was subsequently extracted with an RNeasy kit (Qiagen) according to the manufacturer's protocol. Eluted RNA was quantified by using a NanoDrop 1000 spectrophotometer (Thermo Scientific), diluted to a concentration of 10 ng/μl, and subjected to qRT-PCR using a QuantiFast SYBR green RT-PCR kit (Qiagen) according to the manufacturer's protocol. qRT-PCR was performed in an Applied Biosystems (ABI) 7900HT Fast real-time PCR system as previously described (30). The CT values of granzyme B, T-bet, CXCL-10, IL-12p35, and iNOS were determined, and the CT values of GAPDH (housekeeping genes) were also determined. The fold change relative to mock-infected mice for each gene was determined using the ΔCT method and Microsoft Excel 2010 as described previously (30). All RNA samples were stored at −80°C prior to usage.
Quantification of granzyme B-producing CD8 T cells and NK cells by flow cytometry.
pLN and footpad cells were isolated at respective time points and processed, as described above. Cells were subjected to Golgi capture in RPMI (10% FBS) and 1× brefeldin A solution (BD Biosciences, catalog no. 555029) and then incubated for 2.5 h at 37°C. Subsequently, live cell determination and surface staining of CD45, CD3, CD4, CD8, and NK1.1 cells were performed as described above. For post-surface staining, the cells were fixed and permeabilized using Cytofix/Cytoperm (BD, catalog no. 554714) according to the manufacturer's protocol, followed by staining with anti-mouse granzyme B (eBioscience, catalog no. 12-8898-80) for 30 min. The cells were then washed and resuspended for flow cytometry data acquisition. The data were acquired using an LSR II flow cytometer (BD Biosciences) with BD FACSDiva software and analyzed using FlowJo v9.3.2 software (Tree Star, Inc.).
In vivo NK cell depletion.
Anti-asialo GM1 antibody (Wako, catalog no. 986-10001) was reconstituted in 4 ml of PBS. NK cells were depleted by giving 150 μl of α-asialo antibody intraperitoneally at 1 day preinfection and 2 dpi. Equal amounts of rabbit sera (Sigma, catalog no. R4505) were administered as controls. Successful depletion of the NK cells was verified to occur when the cells were >90% depleted in the peripheral blood on 6 dpi and prior to infection on 0 dpi.
Antibody quantification and isotyping.
Antibody titers were determined using a virion-based enzyme-linked immunosorbent assay (ELISA) as previously described (39). CHIKV-coated (106 virions/well in 50 ml of PBS) polystyrene 96-well MaxiSorp plates (Nunc) were blocked with PBS containing 0.05% Tween 20 (PBST) and 5% (wt/vol) nonfat milk for 1.5 h at 37°C. Sera from normal or infected groups were heat inactivated and serially diluted in antibody diluent (0.05% PBST plus 2.5% [wt/vol] nonfat milk). One hundred microliters of diluted sera per well was added, and the mixture was incubate for 1 h at 37°C. Horseradish peroxidase-conjugated goat anti-mouse IgG (Santa Cruz, catalog no. sc-2005), IgG1 (Santa Cruz, catalog no. sc-2060), IgG2b (Santa Cruz, catalog no. sc-2062), IgG2c (Southern Biotech, catalog no. 1079-01), IgG3 (Santa Cruz, catalog no. sc-2972), and IgM (Santa Cruz, catalog no. sc-2973) antibodies were used. IgG2c was tested in lieu of IgG2a since only IgG2c gene is present in C57BL/6 mice (39). Total IgG and IgM quantification assays were performed on serum samples from animals receiving serum dilutions of 1:2,000 and 1:100, respectively. Pooled sera were used for IgG1, IgG2b, IgG2c, and IgG3 isotyping. ELISAs were developed using TMB substrate and terminated with stop reagent (Sigma-Aldrich). The absorbance was measured at 450 nm.
Serum neutralization assay.
Neutralizing capacity of antibody from CHIKV-infected mice was analyzed by immunofluorescence-based cell infection assays using HEK293T cells (39). The infectious virus required to achieve an MOI of 10 was mixed with diluted (1:100, 1:1,000, 1:10,000, and 1:100,000), heat-inactivated pooled mouse sera, followed by incubation for 2 h at 37°C with gentle agitation (350 rpm). Virus-antibody mixtures were then added to HEK293T cells seeded on fibronectin-coated 96-well plates, followed by incubation for 1.5 h at 37°C. The virus inoculum was removed, replaced with DMEM supplemented with 10% FBS, followed by incubation for 6 h at 37°C, before fixation with 4% paraformaldehyde, and then permeabilized in PBS containing 0.2% Tween 20. Cells were incubated with mouse anti-alphavirus monoclonal antibody (Santa Cruz, catalog no. sc-58088) at a 1:500 dilution in PBS, followed by incubation with Alexa Fluor 488-conjugated goat anti-mouse IgG F(ab′)2 antibody (Invitrogen, catalog no. A11017) at a 1:500 dilution in PBS. Nuclei were stained with DAPI (4′,6′-diamidino-2-phenylindole; 1-μg/μl stock) at a 1:10,000 dilution in PBS, followed by immunofluorescence quantification using the Cellomics ArrayScan high-content-analysis reader (Thermo Scientific).
Statistics.
All data are presented as means ± the standard deviations (SD) or as a percentage. Differences in responses among groups at various time points and between groups and controls were analyzed using appropriate tests (Mann-Whitney U tests, two-tailed analysis). Chi-square analysis was used to compare patient data from the La Réunion Island outbreak (2005-2006) and the current Caribbean cohort. A P value of <0.05 was considered statistically significant.
RESULTS
CNR20235 has a lower early replicative capacity and replication fitness than LR2006 OPY1 in vitro.
The differences in the phenotypes of viruses belonging to the same family but different clades are often correlated with the degree of differences in their genomes. To have a preliminary understanding of genomic differences between CNR20235 and LR2006 OPY1 isolates, we compared the full coding sequences of the isolates. As presented in Table 1 and Table 2, the highest numbers of amino acid differences were seen in nsP3 (6.23%), 6K (8.2%), E3 (6.25%), and E2 (4.49%). A notable difference in the CNR20235 isolate was the presence of a 12-nucleotide deletion in nsP3, leading to a 4-amino-acid deletion at positions 1711 to 1714, suggesting possible differences in replication efficiencies between the isolates.
TABLE 1.
Amino acid differences between sequences of LR2006 OPY1 and CNR20235 in nonstructural regionsa

Amino acid (aa) positions are given with reference to LR2006 OPY1.
TABLE 2.
Amino acid differences between sequences of LR2006 OPY1 and CNR20235 in structural regionsa

Amino acid (aa) positions are given with reference to LR2006 OPY1.
We addressed whether these genome differences translated into phenotypic differences between LR2006 OPY1 and CNR20235 by comparing the replicative capacity in primary MTFs. Infection was performed at an MOI of 1, and the replication kinetics across a time course of 0, 6, 12, and 24 hpi were determined by measuring infectivity parameters such as level of intracellular CHIKV-nsP2 antigen, viral load (E1 and negative-sense nsP1), and infectious viral particles (Fig. 1). A significantly higher percentage of CHIKV antigen-positive cells (2-fold higher) was detected in LR2006 OPY1 infections than in CNR20235 isolate infections at 12 hpi (Fig. 1B). In agreement with this, a greater initial replicative capacity of LR2006 OPY1 was also reflected in the viral load, where significantly greater E1 (∼1-log) (Fig. 1A) and negative-sense nsP1 (∼0.5-log) (Fig. 1C) RNA copies were observed at 6 and 12 hpi but not at 24 hpi. Likewise, the number of infectious viral particles determined by plaque assay was significantly higher in LR2006 OPY1 than CNR20235 isolates across the entire course of infection (∼1 log higher), accompanied by a larger plaque size observed in LR2006 OPY1 infection than in CNR20235 infection (Fig. 1D).
FIG 1.

In vitro infection kinetics of LR2006 OPY1 and CNR20235. (A to D) Time course-dependent infection kinetics were examined ex vivo in WT C57BL/6 MTFs. Cells were infected with LR2006 OPY1 and CNR20235 at an MOI of 1 with E1 viral load (A), infectivity (B), nsP1 viral load (C), and plaque assay with infectious viral particles (D) tracked over 24 h (n = 5 per group). Representative images of LR2006 OPY1 and CNR20235 plaques obtained at 10−5 and 10−3 dilution, respectively, are shown. The data are presented as means ± the SD from two independent experiments (two-tailed Mann-Whitney U test). **, P = 0.079 (6 hpi, E1 viral load); *, P = 0.0317 (12 hpi, E1 viral load); *, P = 0.0159 (6 hpi, infectivity); **, P = 0.0079 (12 hpi, infectivity); **, P = 0.0079 (6 hpi, nsP1 viral load); *, P = 0.0159 (12 hpi, nsP1 viral load); *, P = 0.0159 (6 hpi, plaque assay); **, P = 0.0079 (12 hpi, plaque assay); *, P = 0.0159 (24 hpi, plaque assay). (E) Competition infection with LR2006 OPY1 and CNR20235 in Vero E6 cells at various initial virus ratios of LR2006 OPY1 to CNR20235 (1:1, 1:4, 4:1, 1:99, and 99:1) over six passages (n = 3 for all ratios). CHIKV isolate-specific nsP1 viral RNA copies were quantified, and graphs were plotted as the ratio of LR2006 OPY1 to CNR20235 nsP1 copies.
To further address the replicative fitness between LR2006 OPY1 and CNR20235, an adapted in vitro competition assay was performed (43). Vero E6 cells were coinfected with various initial ratios of LR2006 OPY1 to CNR20235 (1:1, 1:4, 4:1, 1:99, and 99:1), followed by successive passages until the ratio of LR2006 OPY1 to CNR20235 nsP1 viral RNA copies stabilized (43). Expectedly, LR2006 OPY1 was shown to be fitter than CNR20235 (Fig. 1E). Conditions with a higher initial LR2006 OPY1 proportion (4:1 and 99:1) served as controls, where the ratio of LR2006 OPY1 to CNR20235 nsP1 viral RNA copies stabilized at ∼101 throughout the six passages (Fig. 1E). For conditions with lower LR2006 OPY1 (1:4 and 1:99), nsP1 copies of LR2006 OPY1 outcompeted CNR20235 and attained ratios of nsP1 viral RNA copies similar to those for the controls by passage 3 (1:4 condition) and passage 4 (1:99 condition), respectively (Fig. 1E). Taken together, our results indicate that the replicative capacity and competitive replication fitness of CNR20235 is less than that of LR2006 OPY1.
CNR20235 induces a less pronounced pathology than LR2006 OPY1 in mice.
The development of CHIKV-induced pathology is dependent on the interplay of virus replication in the host and the host immune response. As such, we next examined whether the weaker ex vivo replicative capacity of CNR20235 could translate into a weaker in vivo pathology in WT C57BL/6 mice. WT C57BL/6J mice were infected with either CNR20235 or LR2006 OPY1 and monitored daily for survival, viremia, and joint footpad swelling (Fig. 2).
FIG 2.

Differential pathological outcomes induced by LR2006 OPY1 and CNR20235 CHIKV infections in mice. Three-week-old WT C57BL/6 female mice were infected with LR2006 OPY1 or CNR20235 (106 TCID50) (n = 6 per group) by joint footpad inoculation. (A) Disease severity was assessed and scored. Viremia was determined by qRT-PCR targeting for the E1 (B) and negative-sense (C) nsP1 genes. Dotted line indicates limit of detection. All data are presented as mean ± the SD of two independent experiments (two-tailed Mann-Whitney U test). For the disease scores: **, P = 0.002 (1 dpi); **, P = 0.002 (2 dpi); **, P = 0.005 (3 dpi); **, P = 0.002 (4 dpi); **, P = 0.005 (5 dpi); **, P = 0.002 (6 to 10 dpi); **, P = 0.005 (11 dpi); **, P = 0.008 (12 dpi); **, P = 0.002 (13 dpi); **, P = 0.005 (14 dpi). For E1 viremia: **, P = 0.008 (1 dpi); *, P = 0.015 (2 dpi). For nsP1 viremia: *, P = 0.015 (2 dpi). (D) CNR20235 infection triggers less edema but more cellular infiltration than LR2006 OPY1 in mice. Histological analysis of CHIKV-inoculated joint footpad samples from mice by H&E staining at 3 and 6 dpi. Boxed regions are shown at the higher magnifications indicated on the right. *, Edema; B, bone; M, muscle; T, tendon. The images presented are representative of three mice per group from two independent experiments. (E and F) Representative images (E) and quantification of vascular leakiness in the inflamed joints (F) of LR2006 OPY1 (n = 5)- and CNR20235 (n = 5)-infected mice. The data were analyzed by a two-tailed Mann-Whitney U test (**, P = 0.0079 [3 dpi]; **, P = 0.0079 [6 dpi]). All representative images were taken after 2 s of exposure, and the yellow arrows in panel E indicate inflamed joints.
Despite both isolates inducing the maximum pathology at 6 dpi, we observed an overall less pronounced joint swelling in mice infected with CNR20235 than in mice infected with LR2006 OPY1 (Fig. 2A). Similar to earlier observations for ex vivo primary MTF infections (Fig. 1B and C), infection with LR2006 OPY1 resulted in significantly higher viremia than with CNR20235 (∼1 log higher for E1 at 1 and 2 dpi; ∼0.5 log higher in nsP1 at 2 dpi) during the early acute infections at 1 and 2 dpi (Fig. 2B and C). Histological assessment by H&E staining at 3 and 6 dpi showed that the more pronounced swelling observed in mice infected with LR2006 OPY1 was due to a greater degree of edema (Fig. 2D). Unexpectedly, the pronounced joint swelling caused by LR2006 OPY1 infection was not elucidated by a greater infiltration of mononuclear cells. Instead, a greater degree of mononuclear infiltration was observed in mice infected with CNR20235 at 3 and 6 dpi (peak of swelling), despite having less pronounced joint swelling (Fig. 2D).
To further quantitatively assess the differences in the edema induced by LR2006 OPY1 and CNR20235, a tracer assay was performed to measure the vascular leakage in the joint of virus-infected animals (Fig. 2E and F). A greater degree of vascular leakiness in LR2006 OPY1 was observed at both 3 and 6 dpi (Fig. 2E and F). These observations were in stark contrast to previous studies suggesting mononuclear infiltrates as the primary driver of joint swelling (37, 45). Taken together, these observations highlight that CHIKV-induced joint swelling is a combination of both edema and cellular infiltration and that CNR20235 induces a weaker pathology associated with reduced edema in the joint of animals.
CNR20235 induces a milder systemic inflammatory response than LR2006 OPY1.
To identify the mediators in systemic host response that may be responsible for the reduced pathology induced by CNR20235, we next examined the serum levels of 19 cytokines in LR2006 OPY1- and CNR20235-infected mice at 3, 6, and 15 dpi (Fig. 3). Among the 19 cytokines analyzed, levels of seven cytokines were below detection limit and were therefore excluded from subsequent analysis. Two-way hierarchical clustering analysis showed that infection with CNR20235 triggered a milder proinflammatory host response than with LR2006 OPY1, particularly at 3 dpi (Fig. 3A). Significantly higher levels of proinflammatory (IFN-γ, TNF-α, and IL-6), antiviral (IFN-α), chemotactic (IP-10, RANTES, GROα, and MCP-1), and bone-associated (sRANKL) immune mediators were observed in mice infected with LR2006 OPY1 at 3 dpi (Fig. 3B). At 6 dpi, the levels of IFN-γ, TNF-α, and IL-6 remained significantly higher in mice infected with LR2006 OPY1, with higher GROα levels persisting until 15 dpi (Fig. 3B).
FIG 3.

CNR20235 triggers a milder host inflammatory response than LR2006 OPY1 during the acute phase of disease. Three-week-old WT C57BL/6 female mice were infected with LR2006 OPY1 or CNR20235 at 106 TCID50 (n = minimum of 6 mice per group) by joint footpad inoculation. The serum levels of 12 immune mediators at 3, 6, and 15 dpi were quantified by using a microbead-based immunoassay. (A) Patterns of immune mediators shown by two-way hierarchical clustering. Each colored cell represents the relative levels of expression of a particular cytokine in a mouse. Green indicates low production, and red indicates high production. (B) Box-and-whisker plots of serum IFN-γ, TNF-α, IP-10, RANTES, sRANKL, Groα, MCP-1, IFN-α, and IL-6 levels in LR2006 OPY1- and CNR20235-infected mice at 3, 6, and 15 dpi (two-tailed Mann-Whitney U test). ***, P = 0.0001 (3 dpi, IFN-γ); ***, P = 0.0002 (3 dpi, TNF-α); *, P = 0.010 (3 dpi, IP-10); **, P = 0.006 (3 dpi, RANTES); *, P = 0.015 (3 dpi, sRANKL); *, P = 0.012 (3 dpi, GROα); ***, P = 0.0004 (3 dpi, MCP-1); *, P = 0.0008 (3 dpi, IFN-α); ***, P = 0.0008 (3 dpi, IL-6); ***, P = 0.0001 (6 dpi, IFN-γ); *, P = 0.021 (6 dpi, TNF-α); **, P = 0.007 (6 dpi, GROα); *, P = 0.030 (6 dpi, IL-6); **, P = 0.002 (15 dpi, GROα). ND, below detection limit.
CNR20235 and LR2006 OPY1 induce a differential localized host immune response.
Although infection with CNR20235 induced a milder systemic host immune response than with LR2006 OPY1 (Fig. 3), CNR20235 induced a greater degree of mononuclear cell infiltration into the joint footpad, despite a less pronounced joint swelling (Fig. 2D). This discrepancy suggests that general infiltration in the joint was insufficient as a marker of pathogenicity. Instead, a more defined understanding of pathogenic host immune factors in core organs involved is required. To address this issue, viral load, immunophenotyping, and gene expression analysis were performed in the nearest draining lymph node, the popliteal lymph node (pLN), and at the site of virus inoculation (footpad) (Fig. 4 and 5).
FIG 4.

Differential host immune response induced by LR2006 OPY1 and CNR20235 in the pLN. Three-week-old WT C57BL/6 female mice were infected with LR2006 OPY1 or CNR20235 at 106 TCID50 (n = minimum 6 mice per group) by joint footpad inoculation. (A) At 3 and 6 dpi, pLN was harvested, and the viral load was determined by qRT-PCR targeting for negative-sense nsP1 gene. The data are presented as the means ± the SD of two independent experiments (two-tailed Mann-Whitney U test). **, P = 0.002 (3 dpi). (B) Cells from the pLN were labeled for CD45, CD3, CD4, CD8, CD11b, Ly6G, and NK1.1. The absolute cell counts of each immune cell subset were calculated based on the total numbers of live cells determined before labeling. The data are presented as the means ± the SD of two independent experiments (two-tailed Mann-Whitney U test). *, P = 0.015 (3 dpi, total CD3+); **, P = 0.008 (6 dpi, total CD3+); *, P = 0.026 (3 dpi, CD3+ CD4+); *, P = 0.041 (3 dpi, CD3+ CD8+); *, P = 0.017 (6 dpi, CD3+ CD8+); **, P = 0.004 (6 dpi, NK1.1+). (C) Gene expression levels of granzyme B, T-bet, IP-10, IL-12p35, and iNOS in the pLN. The level of gene expression was expressed as the fold change compared to mock-infected mice (n = 6) after normalization to GAPDH (glyceraldehyde-3-phosphate dehydrogenase). The data are representative of two independent experiments and are presented as means ± the SD (two-tailed Mann-Whitney U test). **, P = 0.008 (3 dpi, granzyme B); *, P = 0.015 (6 dpi, granzyme B); **, P = 0.004 (3 dpi, IP-10); **, P = 0.002 (6 dpi, IP-10); **, P = 0.002 (3 dpi, IL-12p35); *, P = 0.015 (6 dpi, iNOS).
FIG 5.

Differential host immune response induced by LR2006 OPY1 and CNR20235 in inflamed joint footpad. Three-week-old WT C57BL/6 female mice were infected with LR2006 OPY1 or CNR20235 at 106 TCID50 (n = minimum 6 mice per group) by joint footpad inoculation. (A) At 3 and 6 dpi, CHIKV-inoculated footpad was harvested, and the viral load was determined by qRT-PCR targeting for negative-sense nsP1 gene. The data are presented as means ± the SD of two independent experiments. Comparison at each time point was performed using a two-tailed Mann-Whitney U test. (B) Cells from each CHIKV-inoculated footpad were labeled for CD45, CD3, CD4, CD8, CD11b, Ly6G, Ly6C, and NK1.1. The absolute cell counts of each immune cell subset were calculated based on the total number of live cells determined before labeling. The data are presented as means ± the SD of two independent experiments (two-tailed Mann-Whitney U test). **, P = 0.004 (6 dpi, total CD3+); **, P = 0.004 (6 dpi, CD3+ CD4+); **, P = 0.015 (3 dpi, NK1.1+); **, P = 0.004 (6 dpi, CD11b+ Ly6C+ monocytes). (C) Gene expression level of granzyme B, T-bet, IP-10, IL-12p35, and iNOS in CHIKV-inoculated footpad. The level of gene expression was expressed as the fold change compared to mock-infected mice (n = 6) after normalization to GAPDH. The data are representative of two independent experiments and presented as means ± the SD (two-tailed Mann-Whitney U test). *, P = 0.026 (3 dpi, T-bet); *, P = 0.026 (6 dpi, T-bet); **, P = 0.004 (3 dpi, IP-10); *, P = 0.041 (3 dpi, IL-12p35).
In the pLN, mice infected with LR2006 OPY1 had a significantly higher viral load compared to mice infected with CNR20235 on 3 dpi (Fig. 4A). In addition, recruitment of T cells and NK cells in the pLN were differentially modulated in mice infected with LR2006 OPY1 and CNR20235 (Fig. 4B). A higher number of CD3+ T cells were recruited during infection with CNR20235: both CD4+ and CD8+ T cells at 3 dpi and mainly CD8+ T cells at 6 dpi (Fig. 4B). Fewer NK cells were recruited during CNR20235 infection compared to LR2006 OPY1 (Fig. 4B). Gene expression analysis further revealed that CNR20235 did not drive a strong host immune response despite the recruitment of more immune cells (Fig. 4C). On the other hand, infection with LR2006 OPY1 led to a higher expression of IL-12p35 (Th1-associated gene; ∼1-fold higher at 3 dpi), and granzyme B (∼3-fold higher at 3 dpi and ∼0.5-fold higher at 6 dpi) and IP-10 (∼2.5-fold higher at 3 dpi and ∼1-fold higher at 6 dpi) (Fig. 4C). Although the number of monocytes/macrophages was not significantly modulated, it is interesting that the expression of iNOS, a macrophage-associated gene was significantly induced during CNR20235 infection at 6 dpi (Fig. 4C).
At the site of virus inoculation (i.e., footpad), there was no significant difference in viral load between LR2006 OPY1 and CNR20235 (Fig. 5A). At 3 dpi, infiltration of NK cells with LR2006 OPY1 infection was significantly higher compared to CNR20235 infection (Fig. 5B). During the peak of joint swelling at 6 dpi, significantly higher total CD3+ T cells (mainly CD4+ T cells) and CD11b+ Ly6C+ monocytes was observed predominantly in CNR20235 infection (Fig. 5B). This finding is consistent with the histological assessment by H&E staining (Fig. 2D), verifying the nature of the increased mononuclear infiltrates to be comprised primarily of CD3+ CD4+ T cells and CD11b+ Ly6C+ monocytes. Similar to the pLN (Fig. 4C), the increased number of immune cells infiltrating into the CNR20235-inoculated joint footpad did not result in a stronger host immune response (Fig. 5C). Instead, gene expression analysis revealed a smaller Th1 response, with T-bet (∼10-fold lower at 3 dpi and ∼5-fold lower at 6 dpi), IP-10 (∼15-fold lower at 3 dpi), and IL-12p35 (∼ 0.5-fold lower at 3 dpi) expression being significantly lower at either 3 or 6 dpi (Fig. 5C).
Early and intensive NK response mediates early acute joint pathology in LR2006 OPY1 infection.
Transcriptional analysis in tissues showed high levels of granzyme B expression with CHIKV infection (Fig. 4C and 5C). In addition, the CHIKV proteome was previously predicted to contain several regulatory domains within viral proteins that were potential sites of granzyme B cleavage, suggesting that granzyme B has direct antiviral activity (46). This led us to further characterize granzyme B expression using IHC in the pLN and footpad (Fig. 6). Intense granzyme B staining was observed in the pLNs of mice infected with either virus at 3 dpi (Fig. 6). Consistent with granzyme B transcriptional analysis (Fig. 4C) of the pLN, the intensity of granzyme B staining was higher in LR2006 OPY1 at 3 dpi but not at 6 dpi (Fig. 6). Compared to the pLN, granzyme B staining was less intense in the joint footpad. Granzyme B staining in the footpad was indistinguishable between LR2006 OPY1 and CNR20235 at 3 dpi, but higher granzyme B intensity was seen in CNR20235 at 6 dpi (Fig. 6).
FIG 6.
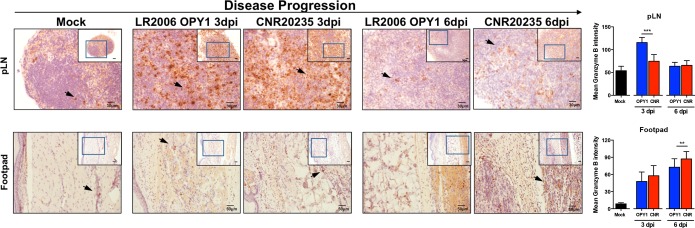
Histological assessment of granzyme B expression in the pLN and joint footpads of LR2006 OPY1- and CNR20235-infected mice. Three-week-old WT C57BL/6 female mice were infected with LR2006 OPY1 or CNR20235 at 106 TCID50 (n = 3 mice per group) by joint footpad inoculation. Histological analysis of pLN and CHIKV-inoculated footpad by labeling with anti-granzyme B antibody at 3 and 6 dpi was performed. The images in the boxed regions were taken at ×200 magnification within the inset images, which were taken at ×100 magnification. Black arrowheads indicate positively stained cells. For the pLNs, the scale bars represent 30 and 50 μm for the main and inset images, respectively. For the footpads, the scale bars represent 50 and 100 μm for the main and inset images, respectively. The images presented are representative of three mice per group from two independent experiments. The mean granzyme B intensity in positively stained cells (n = 20) was quantified from photos taken at ×200 magnification using ImageJ and is presented as a histogram (two-tailed Mann Whitney U test). ***, P < 0.0001 (3 dpi, pLN); **, P = 0.0018 (6 dpi, footpad).
To better distinguish the source of granzyme B between NK and CD8 T cells, granzyme B was captured with brefeldin A in cells isolated from the pLN and joint footpad at 3 and 6 dpi. This was followed by surface and intracellular staining of defined markers for NK cells, CD8 T cells, and granzyme B (Fig. 7). In the pLN, high levels of granzyme B were detected predominantly in the NK cells and not in CD8 T cells at 3 dpi (Fig. 7A). Consistent with the IHC staining (Fig. 6), higher total counts and expression levels of granzyme B in NK cells and CD8 T cells were observed in LR2006 OPY1 at 3 dpi compared to CNR20235 in the pLN (Fig. 7A and B). Similarly, higher levels of granzyme B were also detected in the NK cells of the joint footpad at 3 dpi (Fig. 7C). Differential regulation of granzyme B expressing CD8 T cells was observed between LR2006 OPY1 and CNR20235 (Fig. 7C and D).
FIG 7.

Early acute NK activation in LR2006 OPY1 mediates joint pathology. Three-week-old WT C57BL/6 female mice were infected with LR2006 OPY1 or CNR20235 at 106 TCID50 (n = minimum 5 mice per group) by joint footpad inoculation. (A and C) Mean fluorescence intensity (MFI) representing granzyme B expression in CD8 and NK cells in pLNs (A) and footpads (C) in CHIKV infection (two-tailed Mann-Whitney U test). *, P = 0.0476 (pLN, 3 dpi, CD8); *, P = 0.0317 (pLN, 3 dpi, NK); *, P = 0.0476 (footpad, 6 dpi, CD8). (B and D) Absolute counts of granzyme B+ CD8 and NK cells in pLNs (B) and footpads (D) in CHIKV infection (two-tailed Mann-Whitney U test). *, P = 0.0317 (pLN, 3 dpi, CD8); *, P = 0.0317 (pLN, 3 dpi, NK); *, P = 0.0317 (footpad, 6 dpi, CD8); *, P = 0.0317 (footpad, 6 dpi, NK). NK cells were depleted from mice using α-asialo-GM1 antibody, and equal amounts of rabbit serum were given for controls. (E) Disease scores at 3 and 6 dpi in CHIKV infection (two-tailed Mann-Whitney U test). **, P = 0.0079 (nsP1, day 6); ***, P < 0.0001 (disease score, day 6).
To further verify the role of NK cells as an important mediator of the joint pathology observed at 3 dpi, NK cells were depleted using α-asialo-GM1 antibody prior to LR2006 OPY1 and CNR20235 infection. Interestingly, depletion of NK cells significantly reduced joint footpad swelling in LR2006 OPY1 and not in CNR20235 infection at 3 dpi (Fig. 7E). Taken together, these observations suggested that NK cells partially mediate joint inflammation in LR2006 OPY1 during early acute infection.
LR2006 OPY1 but not CNR20235 induces a predominant Th1-associated IgG2c response during early infection.
It has been established in mice that the IgG isotype of specific antibodies reflects the type of Th response. Antibodies of IgG1 isotypes are known to associate with Th2 response, whereas antibodies of IgG2b and IgG2c isotypes are known to associate with Th1 response (46). In order to evaluate the functional significance of Th response induced by LR2006 OPY1 and CNR20235, we examined the levels of CHIKV-specific total IgM, IgG, and their isotypes (IgG1, IgG2b, IgG2c, and IgG3) using virion-based ELISA and CHIKV neutralizing assays from sera of infected mice collected at 3, 6, and 15 dpi (Fig. 8). Despite a lower replication capacity, it was interesting that infection with CNR20235 induced high levels of CHIKV-specific total IgM (at 3, 6, and 15 dpi) and IgG (at 6 and 15 dpi) (Fig. 8A and B). Consistent with previous studies (37), infection with LR2006 OPY1 induced a Th1 bias response, consisting predominantly of CHIKV-specific IgG2c response at both 6 and 15 dpi (Fig. 8B and C). In contrast, the IgG1/IgG2c antibody response during CNR20235 infection shifted toward IgG1 at 6 dpi (Fig. 8B and C), highlighting a less prominent Th1 response that coincided with the reduction in the peak of joint footpad inflammation. At 15 dpi, both LR2006 OPY1 and CNR20235 infections displayed a dominant IgG2c response (Fig. 8B and C).
FIG 8.

CHIKV-specific antibody induction during CNR20235 and LR2006 OPY1 infection. Three-week-old WT C57BL/6 female mice were infected with LR2006 OPY1 or CNR20235 at 106 TCID50 (n = 6 to 18 per group) by joint footpad inoculation. (A) The total CHIKV-specific IgM and IgG levels were determined from serum samples collected at 0, 3, 6, and 15 dpi at dilutions of 1:100 and 1:2,000, respectively, using purified CHIKV virion-based ELISA. Data were obtained from three independent experiments and are presented as the mean relative optical density at 450 nm (OD450) ± the SD after subtracting the background OD450 (two-tailed Mann-Whitney U test). ***, P = 0.0008 (3 dpi, IgM); ***, P = 0.0001 (6 dpi, IgM); **, P = 0.004 (15 dpi, IgM); ***, P = 0.0001 (6 dpi, IgG); **, P = 0.004 (15 dpi, IgG). (B) The levels of CHIKV-specific IgG1, IgG2b, IgG2c, and IgG3 were determined in pooled sera collected at 3, 6, and 15 dpi using a purified CHIKV virion-based ELISA. ND, below the detection limit. The antibody titer of each isotype was determined from the highest serum dilution with the same detection limit as naive mice (n = 6). (C) Ratio of IgG1 to IgG2c determined from CHIKV-specific antibody titer. An assay was performed in duplicate, and the results are presented as the mean from three independent experiments. (D) Neutralizing capacity of pooled sera collected at 3, 6, and 15 dpi. Pooled sera from three independent experiments (n = 6 to 18 per group) were diluted from 1:102 to 1:105 and mixed with CHIKV (MOI of 10) for 2 h before infection of HEK293T cells for 6 h. The assays were performed in quintuplicate, and data are expressed relative to samples infected with virus only without sera. The dotted line indicates the detection limit of the assay determined from mock-infected samples. Data are presented as means ± the SD.
Neutralizing CHIKV-specific antibodies were assessed by using pooled sera. Interestingly, higher levels of CHIKV-specific total IgM and IgG antibodies induced by CNR20235 infection did lead to more efficient CHIKV neutralization. The neutralizing capacity against CHIKV was similar in sera taken from LR2006 OPY1- and CNR20235-infected mice at 3, 6, and 15 dpi (Fig. 8D). Collectively, these observations suggest that while infection with LR2006 OPY1 induces an early predominant Th1-bias antibody response compared to CNR20235 infection, the antibody neutralizing capacity remains similar.
DISCUSSION
CHIKV can be categorized into three main genotypes, namely, the West Africa, ECSA, and Asian genotypes (47). Interestingly, each lineage has its own geographically distinct distribution. Isolates that caused the Indian Ocean outbreaks from 2004 to 2006 form a distinct cluster within the ECSA lineage (15). The ability of the Indian Ocean isolates to increase their fitness in A. albopictus due to an A226V mutation in the E1 glycoprotein put Europe and the Americas at risk of CHIKV outbreaks since A. albopictus mosquitoes are abundantly distributed in these regions (48, 49). It is interesting that the primary etiological agent that caused recent CHIKV outbreaks in China, the Philippines and Indonesia, and the Caribbean in December 2013 belongs to the Asian but not the ECSA genotype (24, 50, 51).
To address the propagation ability of the current circulating CNR20235 in the host, we performed a series of in vitro infections in MTFs and competition assays in Vero E6 compared to the well-characterized LR2006 OPY1. We found that CNR20235 displayed a weakened phenotype, whereby a lower replicative capacity and replication fitness was observed during in vitro infection. Importantly, CNR20235 further display a waned pathogenicity in vivo. Mice infected with CNR20235 showed a reduced joint pathology during acute infection compared to LR2006 OPY1. Interestingly, preliminary observations indicate a higher proportion of asymptomatic cases from CNR20235 infections in the St Martin Caribbean cohort (40% asymptomatic cases) compared to that from LR2006 OPY1 infections (52) in La Réunion (13% asymptomatic cases; data not shown). Together, these observations suggest that CNR20235 displays a debilitated phenotype in its ability to replicate and induce disease in the mammalian host.
It was previously reported that the Asian CHIKV isolate induced a modest joint swelling due to reduced macrophage infiltrates and a weaker proinflammatory response (37). However, it should be noted that in that study, the Asian-CHIKV isolate was murine adapted by nine passages in C57BL/6J mice (37, 53), which could potentially alter the immunopathology. In our study, mice were infected with the Caribbean CNR20235 CHIKV isolate propagated in the C6/36 mosquito cell line. This method confers several advantages that include limited genetic changes to the virus isolates used and providing a closer simulation to natural infection from mosquitoes in a mammalian host.
In the present study, a systemic CHIKV-induced host immune response illustrated that the symptomatic phase in infected mice could be further segregated into two phases: early acute at 1 to 3 dpi (peak of viremia) and late acute at 6 dpi (peak of inflammation). Distinct pathological outcomes could differentiate the two phases. The early acute phase is presented by high viral load in the organs, where joint swelling is composed primarily of edema but not cellular infiltrates. In the late acute phase, viral load in the organs is reduced, and joint swelling is mediated by both edema and cellular infiltrates, verifying earlier observations (45). Interestingly, we show here that, compared to mice infected with LR2006 OPY1, mice infected with CNR20235 presented with significantly less edema, lower viremia and viral load in the organs, and overall lower levels of systemic proinflammatory cytokines during the early acute phase. Furthermore, differentially regulated proinflammatory cytokines/chemokines, including IFN-α, IFN-γ, TNF-α, IL-6, IP-10, and MCP-1, were recently reported to be the most common systemic immune signatures observed across different CHIKV cohorts during the early acute phase (54).
Minimal NK cell activity in the pLN and footpad was also observed in CNR20235-infected mice during early acute CHIKV infection. The association between reduced edema and NK cell activity during CNR20235 infection suggests a potential pathogenic role for NK cells during the early acute phase. These NK cells could activate CD11b+ cells, leading to IL-6 and other proinflammatory mediators inducing vascular leakage and edema (55), confirming our data in which a greater extent of edema in LR2006 OPY1 infection correlated with higher NK activity and higher levels of IL-6 and other proinflammatory mediators, such as IFN-γ, TNF-α, IP-10, RANTES, sRANKL, Groα, MCP-1, and IFN-α. The detection of higher granzyme B in the NK cells of LR2006 OPY1-infected mice further corroborated the role of NK cells in driving pathology since the depletion of NK cells significantly reduced the joint pathology. However, whether NK cells mediate CHIKV-induced pathology such as edema through granzyme B (56) remains to be elucidated. Taken together, data presented here indicate that during early acute infection, the lower viral replication (by CNR20235) will result in a reduced systemic proinflammatory response and NK activity with reduced edema in the inflamed tissues. It was suggested in an earlier report that NK cells expressing NKG2C may play a protective role in virus sensing and clearance in CHIKV infections (57). Our data further support a role for NK cells where a strong NK response leads to pathology.
During the peak of inflammation at the late acute phase (6 to 8 dpi) of CN20235 infection, despite a drastic reduction in joint-footpad swelling, immunophenotyping and IHC revealed a greater degree of cellular infiltration. These cellular subsets included CD4+ T cells, CD8+ T cells, and CD11b+ Ly6C+ monocytes. Although CD4+ T cells have been demonstrated to be vital mediators of inflammation during the late acute phase of CHIKV infection (34), the mechanism used by these pathogenic CD4+ T cells and the direct involvement of Th1 dominance CD4+ T cells remains unclear. However, a Th1-biased host response during the symptomatic period has been reported in both human studies and CHIKV animal models (31, 37, 58, 59). In addition, other mouse models with similar inflammatory characteristics at the site of pathology have reported the importance of Th1 cells as vital mediators of inflammation (60–62). In tandem with these observations, CNR20235 infection also led to lower levels of systemic IFN-γ and TNF-α and reduced T-bet expression (Th1 master regulator) in the footpad than did LR2006 OPY1 infection. In addition, CNR20235 infection led to an increased IgG1/IgG2c ratio compared to LR2006 OPY1 infection. Collectively, we provide evidence here that CNR20235 CHIKV induces a limited Th1 response that could underlie the reduced joint inflammation phenotype during acute disease. This also provides pertinent insights into functionally important cytokines and immune subsets to be monitored in these patient cohorts in order to better define the mechanisms of CHIKV immunopathogenesis by different clades.
ACKNOWLEDGMENTS
We thank Anis Larbi and the SIgN Flow Cytometry core for assistance with cytometry analyses. We thank the Advanced Molecular Pathology Laboratory (IMCB, A*STAR) for performing the histology work. We thank Cécile Baronti and Géraldine Piorkowski for kind management of viral strains and genomic sequences at the European Virus Archive.
This research was funded by SIgN (A*STAR) and supported by the Biomedical Research Council (A*STAR). T.-H.T. was supported by an A*STAR postgraduate scholarship. F.-M.L. was supported by the President's Graduate Fellowship from the Yong Loo Lin School of Medicine, National University of Singapore. W.W.L.L. was supported by the postgraduate scholarship from the NUS Graduate School for Integrative Science and Engineering.
The funders had no role in study design, data collection, and analysis, decision to publish, or preparation of the manuscript. All authors have no conflicts of interest.
REFERENCES
- 1.Weaver SC. 2006. Evolutionary influences in arboviral disease. Curr Top Microbiol Immunol 299:285–314. [DOI] [PMC free article] [PubMed] [Google Scholar]
- 2.Ng LC, Hapuarachchi HC. 2010. Tracing the path of Chikungunya virus–evolution and adaptation. Infect Genet Evol 10:876–885. doi: 10.1016/j.meegid.2010.07.012. [DOI] [PubMed] [Google Scholar]
- 3.Schwartz O, Albert ML. 2010. Biology and pathogenesis of Chikungunya virus. Nat Rev Microbiol 8:491–500. doi: 10.1038/nrmicro2368. [DOI] [PubMed] [Google Scholar]
- 4.Powers AM, Logue CH. 2007. Changing patterns of Chikungunya virus: re-emergence of a zoonotic arbovirus. J Gen Virol 88:2363–2377. doi: 10.1099/vir.0.82858-0. [DOI] [PubMed] [Google Scholar]
- 5.Sergon K, Njuguna C, Kalani R, Ofula V, Onyango C, Konongoi LS, Bedno S, Burke H, Dumilla AM, Konde J, Njenga MK, Sang R, Breiman RF. 2008. Seroprevalence of Chikungunya virus (CHIKV) infection on Lamu Island, Kenya, October 2004. Am J Trop Med Hyg 78:333–337. [PubMed] [Google Scholar]
- 6.Enserink M. 2007. Chikungunya: no longer a third world disease. Science 318:1860–1861. doi: 10.1126/science.318.5858.1860. [DOI] [PubMed] [Google Scholar]
- 7.Ravi V. 2006. Re-emergence of Chikungunya virus in India. Indian J Med Microbiol 24:83–84. doi: 10.4103/0255-0857.25175. [DOI] [PubMed] [Google Scholar]
- 8.Morens DM, Fauci AS. 2014. Chikungunya at the door: déjà vu all over again? N Engl J Med 371:885–887. doi: 10.1056/NEJMp1408509. [DOI] [PubMed] [Google Scholar]
- 9.Peyrefitte CN, Bessaud M, Pastorino BAM, Gravier P, Plumet S, Merle OL, Moltini I, Coppin E, Tock F, Daries W, Ollivier L, Pages F, Martin R, Boniface F, Tolou HJ, Grandadam M. 2008. Circulation of Chikungunya virus in Gabon, 2006-2007. J Med Virol 80:430–433. doi: 10.1002/jmv.21090. [DOI] [PubMed] [Google Scholar]
- 10.AbuBakar S, Sam IC, Wong P-F, MatRahim N, Hooi P-S, Roslan N. 2007. Reemergence of endemic Chikungunya, Malaysia. Emerg Infect Dis 13:147–149. doi: 10.3201/eid1301.060617. [DOI] [PMC free article] [PubMed] [Google Scholar]
- 11.Leo YS, Chow ALP, Tan LK, Lye DC, Lin L, Ng LC. 2009. Chikungunya outbreak, Singapore, 2008. Emerg Infect Dis 15:836–837. doi: 10.3201/eid1505.081390. [DOI] [PMC free article] [PubMed] [Google Scholar]
- 12.Theamboonlers A, Rianthavorn P, Praianantathavorn K, Wuttirattanakowit N, Poovorawan Y. 2009. Clinical and molecular characterization of Chikungunya virus in South Thailand. Jpn J Infect Dis 62:303–305. [PubMed] [Google Scholar]
- 13.Duong V, Andries A-C, Ngan C, Sok T, Richner B, Asgari-Jirhandeh N, Bjorge S, Huy R, Ly S, Laurent D, Hok B, Roces MC, Ong S, Char MC, Deubel V, Tarantola A, Buchy P. 2012. Reemergence of Chikungunya virus in Cambodia. Emerg Infect Dis 18:2066–2069. doi: 10.3201/eid1812.120471. [DOI] [PMC free article] [PubMed] [Google Scholar]
- 14.Krastinova E, Quatresous I, Tarantola A. 2006. Imported cases of chikungunya in metropolitan France: update to June 2006. Euro surveillance 11:E060824.060821. [DOI] [PubMed] [Google Scholar]
- 15.Schuffenecker I, Iteman I, Michault A, Murri S, Frangeul L, Vaney M-C, Lavenir R, Pardigon N, Reynes J-M, Pettinelli F, Biscornet L, Diancourt L, Michel S, Duquerroy S, Guigon G, Frenkiel M-P, Bréhin A-C, Cubito N, Desprès P, Kunst F, Rey FA, Zeller H, Brisse S. 2006. Genome microevolution of Chikungunya viruses causing the Indian Ocean outbreak. PLoS medicine 3:e263. doi: 10.1371/journal.pmed.0030263. [DOI] [PMC free article] [PubMed] [Google Scholar]
- 16.Sourisseau M, Schilte C, Casartelli N, Trouillet C, Guivel-Benhassine F, Rudnicka D, Sol-Foulon N, Roux KL, Prevost M-C, Fsihi H, Frenkiel M-P, Blanchet F, Afonso PV, Ceccaldi P-E, Ozden S, Gessain A, Schuffenecker I, Verhasselt B, Zamborlini A, Saïb A, Rey FA, Arenzana-Seisdedos F, Desprès P, Michault A, Albert ML, Schwartz O. 2007. Characterization of reemerging Chikungunya virus. PLoS Pathog 3:e89. doi: 10.1371/journal.ppat.0030089. [DOI] [PMC free article] [PubMed] [Google Scholar]
- 17.de Lamballerie X, Leroy E, Charrel RN, Ttsetsarkin K, Higgs S, Gould EA. 2008. Chikungunya virus adapts to tiger mosquito via evolutionary convergence: a sign of things to come? Virol J 5:33. doi: 10.1186/1743-422X-5-33. [DOI] [PMC free article] [PubMed] [Google Scholar]
- 18.Hapuarachchi HC, Bandara KB, Sumanadasa SD, Hapugoda MD, Lai YL. 2009. Re-emergence of Chikungunya virus in Southeast Asia: virologic evidence from Sri Lanka and Singapore. J Gen Virol 91(Pt 4):1067–1076. doi: 10.1099/vir.0.015743-0. [DOI] [PubMed] [Google Scholar]
- 19.Parola P, Lamballerie Xd, Jourdan J, Rovery C, Vaillant V, Minodier P, Brouqui P, Flahault A, Raoult D, Charrel RN. 2006. Novel Chikungunya virus variant in travelers returning from Indian Ocean islands. Emerg Infect Dis 12:1493–1499. doi: 10.3201/eid1210.060610. [DOI] [PMC free article] [PubMed] [Google Scholar]
- 20.Powers AM. 2011. Genomic evolution and phenotypic distinctions of Chikungunya viruses causing the Indian Ocean outbreak. Exp Biol Med 236:909–914. doi: 10.1258/ebm.2011.011078. [DOI] [PubMed] [Google Scholar]
- 21.Weaver SC, Reisen WK. 2010. Present and future arboviral threats. Antivir Res 85:328–345. doi: 10.1016/j.antiviral.2009.10.008. [DOI] [PMC free article] [PubMed] [Google Scholar]
- 22.Powers AM. 2014. Risks to the Americas associated with the continued expansion of Chikungunya virus. J Gen Virol 96:1–5. doi: 10.1099/vir.0.070136-0. [DOI] [PMC free article] [PubMed] [Google Scholar]
- 23.Fischer M, Staples JE, Arboviral Diseases Branch NCf Zoonotic Infectious Diseases ECDC . 2014. Notes from the field: Chikungunya virus spreads in the Americas: Caribbean and South America, 2013-2014. Morb Mortal Wkly Rep 63:500–501. [PMC free article] [PubMed] [Google Scholar]
- 24.Leparc-Goffart I, Nougairede A, Cassadou S, Prat C, de Lamballerie X. 2014. Chikungunya in the Americas. Lancet 383:514. doi: 10.1016/S0140-6736(14)60185-9. [DOI] [PubMed] [Google Scholar]
- 25.PAHO/WHO. 2014. PAHO/WHO data, maps, and statistics: number of reported cases of Chikungunya fever in the Americas, by country or territory, 2013-2014 (to week noted), 19 December 2014. Pan American Health Organization/World Health Organization, Geneva, Switzerland. [Google Scholar]
- 26.Couderc T, Chrétien F, Schilte C, Disson O, Brigitte M, Guivel-Benhassine F, Touret Y, Barau G, Cayet N, Schuffenecker I, Desprès P, Arenzana-Seisdedos F, Michault A, Albert ML, Lecuit M. 2008. A mouse model for Chikungunya: young age and inefficient type-I interferon signaling are risk factors for severe disease. PLoS Pathog 4:e29. doi: 10.1371/journal.ppat.0040029. [DOI] [PMC free article] [PubMed] [Google Scholar]
- 27.Schilte C, Couderc T, Chretien F, Sourisseau M, Gangneux N, Guivel-Benhassine F, Kraxner A, Tschopp J, Higgs S, Michault A, Arenzana-Seisdedos F, Colonna M, Peduto L, Schwartz O, Lecuit M, Albert ML. 2010. Type I IFN controls Chikungunya virus via its action on nonhematopoietic cells. J Exp Med 207:429–442. doi: 10.1084/jem.20090851. [DOI] [PMC free article] [PubMed] [Google Scholar]
- 28.Rudd PA, Wilson J, Gardner J, Larcher T, Babarit C, Le TT, Anraku I, Kumagai Y, Loo Y-M, Gale M, Akira S, Khromykh AA, Suhrbier A. 2012. Interferon response factors 3 and 7 protect against Chikungunya virus hemorrhagic fever and shock. J Virol 86:9888–9898. doi: 10.1128/JVI.00956-12. [DOI] [PMC free article] [PubMed] [Google Scholar]
- 29.Her Z, Teng T-S, Tan JLJ, Teo T-H, Kam YW, Lum F-M, Lee WWL, Gabriel C, Melchiotti R, Andiappan AK, Lulla V, Lulla A, Win MK, Chow A, Biswas SK, Leo YS, Lecuit M, Merits A, Rénia L, Ng LFP. 2014. Loss of TLR3 aggravates CHIKV replication and pathology due to an altered virus-specific neutralizing antibody response. EMBO Mol Med 7:24–41. doi: 10.15252/emmm.201404459. [DOI] [PMC free article] [PubMed] [Google Scholar]
- 30.Teng T-S, Foo S-S, Simamarta D, Lum F-M, Teo T-H, Lulla A, Yeo NKW, Koh EGL, Chow A, Leo Y-S, Merits A, Chin K-C, Ng LFP. 2012. Viperin restricts Chikungunya virus replication and pathology. J Clin Investig 122:4447–4460. doi: 10.1172/JCI63120. [DOI] [PMC free article] [PubMed] [Google Scholar]
- 31.Labadie K, Larcher T, Joubert C, Mannioui A, Delache B, Brochard P, Guigand L, Dubreil L, Lebon P, Verrier B, Lamballerie XD, Suhrbier A, Cherel Y, Grand RL, Roques P. 2010. Chikungunya disease in nonhuman primates involves long-term viral persistence in macrophages. J Clin Invest 120:894–906. doi: 10.1172/JCI40104. [DOI] [PMC free article] [PubMed] [Google Scholar]
- 32.Her Z, Malleret B, Chan M, Ong EKS, Wong S-C, Kwek DJC, Tolou H, Lin RTP, Tamah PA, Rénia L, Ng LFP. 2010. Active infection of human blood monocytes by Chikungunya virus triggers an innate immune response. J Immunol 184:5903–5913. doi: 10.4049/jimmunol.0904181. [DOI] [PubMed] [Google Scholar]
- 33.Poo YS, Nakaya H, Gardner J, Larcher T, Schroder WA, Le TT, Major LD, Suhrbier A. 2014. CCR2 deficiency promotes exacerbated chronic erosive neutrophil-dominated Chikungunya virus arthritis. Virol 88:6862–6872. doi: 10.1128/JVI.03364-13. [DOI] [PMC free article] [PubMed] [Google Scholar]
- 34.Teo T-H, Lum F-M, Claser C, Lulla V, Lulla A, Merits A, Rénia L, Ng LFP. 2013. A pathogenic role for CD4+ T cells during Chikungunya virus infection in mice. J Immunol 190:259–269. doi: 10.4049/jimmunol.1202177. [DOI] [PubMed] [Google Scholar]
- 35.Hawman DW, Stoermer KA, Montgomery SA, Pal P, Oko L, Diamond MS, Morrison TE. 2013. Chronic joint disease caused by persistent Chikungunya virus infection is controlled by the adaptive immune response. J Virol 87:13878–13888. doi: 10.1128/JVI.02666-13. [DOI] [PMC free article] [PubMed] [Google Scholar]
- 36.Lum F-M, Teo T-H, Lee WWL, Kam Y-W, Rénia L, Ng LFP. 2013. An essential role of antibodies in the control of Chikungunya virus infection. J Immunol 190:6295–6302. doi: 10.4049/jimmunol.1300304. [DOI] [PMC free article] [PubMed] [Google Scholar]
- 37.Gardner J, Anraku I, Le TT, Larcher T, Major L, Roques P, Schroder WA, Higgs S, Suhrbier A. 2010. Chikungunya virus arthritis in adult wild-type mice. J Virol 84:8021–8032. doi: 10.1128/JVI.02603-09. [DOI] [PMC free article] [PubMed] [Google Scholar]
- 38.Bessaud M, Peyrefitte CN, Pastorino BA, Tock F, Merle O, Colpart JJ, Dehecq JS, Girod R, Jaffar-Bandjee MC, Glass PJ, Parker M, Tolou HJ, Grandadam M. 2006. Chikungunya virus strains, Reunion Island outbreak. Emerg Infect Dis 12:1604–1606. doi: 10.3201/eid1210.060596. [DOI] [PMC free article] [PubMed] [Google Scholar]
- 39.Kam YW, Lum FM, Teo TH, Lee WW, Simarmata D, Harjanto S, Chua CL, Chan YF, Wee JK, Chow A, Lin RT, Leo YS, Le Grand R, Sam IC, Tong JC, Roques P, Wiesmuller KH, Renia L, Rotzschke O, Ng LF. 2012. Early neutralizing IgG response to Chikungunya virus in infected patients targets a dominant linear epitope on the E2 glycoprotein. EMBO Mol Med 4:330–343. doi: 10.1002/emmm.201200213. [DOI] [PMC free article] [PubMed] [Google Scholar]
- 40.Salmon AB, Murakami S, Bartke A, Kopchick J, Yasumura K, Miller RA. 2005. Fibroblast cell lines from young adult mice of long-lived mutant strains are resistant to multiple forms of stress. Am J Physiol Endocrinol Metab 289:E23–E29. doi: 10.1152/ajpendo.00575.2004. [DOI] [PubMed] [Google Scholar]
- 41.Plaskon NE, Adelman ZN, Myles KM. 2009. Accurate strand-specific quantification of viral RNA. PLoS One 4:e7468. doi: 10.1371/journal.pone.0007468. [DOI] [PMC free article] [PubMed] [Google Scholar]
- 42.Pastorino B, Bessaud M, Grandadam M, Murri S, Tolou HJ, Peyrefitte CN. 2005. Development of a TaqMan RT-PCR assay without RNA extraction step for the detection and quantification of African Chikungunya viruses. J Virol Methods 124:65–71. doi: 10.1016/j.jviromet.2004.11.002. [DOI] [PubMed] [Google Scholar]
- 43.Nougairede A, De Fabritus L, Aubry F, Gould EA, Holmes EC, de Lamballerie X. 2013. Random codon re-encoding induces stable reduction of replicative fitness of Chikungunya virus in primate and mosquito cells. PLoS Pathog 9:e1003172. doi: 10.1371/journal.ppat.1003172. [DOI] [PMC free article] [PubMed] [Google Scholar]
- 44.Smith BA, Xie BW, van Beek ER, Que I, Blankevoort V, Xiao S, Cole EL, Hoehn M, Kaijzel EL, Lowik CW, Smith BD. 2012. Multicolor fluorescence imaging of traumatic brain injury in a cryolesion mouse model. ACS Chem Neurosci 3:530–537. doi: 10.1021/cn3000197. [DOI] [PMC free article] [PubMed] [Google Scholar]
- 45.Morrison TE, Oko L, Montgomery SA, Whitmore AC, Lotstein AR, Gunn BM, Elmore SA, Heise MT. 2011. A mouse model of Chikungunya virus-induced musculoskeletal inflammatory disease: evidence of arthritis, tenosynovitis, myositis, and persistence. Am J Pathol 178:32–40. doi: 10.1016/j.ajpath.2010.11.018. [DOI] [PMC free article] [PubMed] [Google Scholar]
- 46.Snapper CM, Mond JJ. 1993. Towards a comprehensive view of immunoglobulin class switching. Immunol Today 14:15–17. doi: 10.1016/0167-5699(93)90318-F. [DOI] [PubMed] [Google Scholar]
- 47.Powers AM, Brault AC, Tesh RB, Weaver SC. 2000. Re-emergence of Chikungunya and O'Nyong-Nyong viruses: evidence for distinct geographical lineages and distant evolutionary relationships. J Gen Virol 81:471–479. [DOI] [PubMed] [Google Scholar]
- 48.Tsetsarkin KA, Vanlandingham DL, McGee CE, Higgs S. 2007. A single mutation in Chikungunya virus affects vector specificity and epidemic potential. PLoS Pathog 3:e201. doi: 10.1371/journal.ppat.0030201. [DOI] [PMC free article] [PubMed] [Google Scholar]
- 49.Vazeille M, Moutailler S, Coudrier D, Rousseaux C, Khun H, Huerre M, Thiria J, Dehecq J-S, Fontenille D, Schuffenecker I, Despres P, Failloux A-B. 2007. Two Chikungunya isolates from the outbreak of La Reunion (Indian Ocean) exhibit different patterns of infection in the mosquito, Aedes albopictus. PLoS One 2:e1168. doi: 10.1371/journal.pone.0001168. [DOI] [PMC free article] [PubMed] [Google Scholar]
- 50.Nasci RS. 2014. Movement of Chikungunya virus into the Western hemisphere. Emerg Infect Dis 20:1394–1395. doi: 10.3201/eid2008.140333. [DOI] [PMC free article] [PubMed] [Google Scholar]
- 51.Van Bortel W, Dorleans F, Rosine J, Blateau A, Rousset D, Matheus S, Leparc-Goffart I, Flusin O, Prat C, Cesaire R, Najioullah F, Ardillon V, Balleydier E, Carvalho L, Lemaître A, Noel H, Servas V, Six C, Zurbaran M, Leon L, Guinard A, van den Kerkhof J, Henry M, Fanoy E, Braks M, Reimerink J, Swaan C, Georges R, Brooks L, Freedman J, Sudre B, Zeller H. 2014. Chikungunya outbreak in the Caribbean region, December 2013 to March 2014, and the significance for Europe. Euro Surveill 19:Article 5. [DOI] [PubMed] [Google Scholar]
- 52.Gerardin P, Guernier V, Perrau J, Fianu A, Le Roux K, Grivard P, Michault A, de Lamballerie X, Flahault A, Favier F. 2008. Estimating Chikungunya prevalence in La Reunion Island outbreak by serosurveys: two methods for two critical times of the epidemic. BMC Infect Dis 8:99. doi: 10.1186/1471-2334-8-99. [DOI] [PMC free article] [PubMed] [Google Scholar]
- 53.Nakaya HI, Gardner J, Poo Y-S, Major L, Pulendran B, Suhrbier A. 2012. Gene profiling of Chikungunya virus arthritis in a mouse model reveals significant overlap with rheumatoid arthritis. Arthritis Rheum 64:3553–3563. doi: 10.1002/art.34631. [DOI] [PMC free article] [PubMed] [Google Scholar]
- 54.Teng TS, Kam YW, Lee B, Hapuarachchi HC, Wimal A, Ng LC, Ng LF. 2015. A systematic meta-analysis of immune signatures in patients with acute Chikungunya virus infection. J Infect Dis 211:1925–1935. doi: 10.1093/infdis/jiv049. [DOI] [PMC free article] [PubMed] [Google Scholar]
- 55.Rouzaire P, Luci C, Blasco E, Bienvenu J, Walzer T, Nicolas J-F, Hennino A. 2012. Natural killer cells and T cells induce different types of skin reactions during recall responses to haptens. Eur J Immunol 42:80–88. doi: 10.1002/eji.201141820. [DOI] [PubMed] [Google Scholar]
- 56.Hendel A, Hsu I, Granville DJ. 2014. Granzyme B releases vascular endothelial growth factor from extracellular matrix and induces vascular permeability. Lab Invest 94:716–725. doi: 10.1038/labinvest.2014.62. [DOI] [PMC free article] [PubMed] [Google Scholar]
- 57.Petitdemange C, Becquart P, Wauquier N, Béziat V, Debré P, Leroy EM, Vieillard V. 2011. Unconventional repertoire profile is imprinted during acute Chikungunya infection for natural killer cells polarization toward cytotoxicity. PLoS Pathog 7:e1002268. doi: 10.1371/journal.ppat.1002268. [DOI] [PMC free article] [PubMed] [Google Scholar]
- 58.Patil DR, Hundekar SL, Arankalle VA. 2012. Expression profile of immune response genes during acute myopathy induced by Chikungunya virus in a mouse model. Microbes Infect 14:457–469. doi: 10.1016/j.micinf.2011.12.008. [DOI] [PubMed] [Google Scholar]
- 59.Hoarau J-J, Jaffar Bandjee M-C, Krejbich Trotot P, Das T, Li-Pat-Yuen G, Dassa B, Denizot M, Guichard E, Ribera A, Henni T, Tallet F, Moiton MP, Gauzère BA, Bruniquet S, Jaffar Bandjee Z, Morbidelli P, Martigny G, Jolivet M, Gay F, Grandadam M, Tolou H, Vieillard V, Debré P, Autran B, Gasque P. 2010. Persistent chronic inflammation and infection by Chikungunya arthritogenic alphavirus in spite of a robust host immune response. J Immunol 184:5914–5927. doi: 10.4049/jimmunol.0900255. [DOI] [PubMed] [Google Scholar]
- 60.Ishizaki K, Yamada A, Yoh K, Nakano T, Shimohata H, Maeda A, Fujioka Y, Morito N, Kawachi Y, Shibuya K, Otsuka F, Shibuya A, Takahashi S. 2007. Th1 and type 1 cytotoxic T cells dominate responses in T-bet overexpression transgenic mice that develop contact dermatitis. J Immunol 178:605–612. doi: 10.4049/jimmunol.178.1.605. [DOI] [PubMed] [Google Scholar]
- 61.Kondo S, Beissert S, Wang B, Fujisawa H, Kooshesh F, Stratigos A, Granstein RD, Mak TW, Sauder DN. 1996. Hyporesponsiveness in contact hypersensitivity and irritant contact dermatitis in CD4 gene targeted mouse. J Investig Dermatol 106:993–1000. doi: 10.1111/1523-1747.ep12338505. [DOI] [PubMed] [Google Scholar]
- 62.Mauri C, Williams RO, Walmsley M, Feldmann M. 1996. Relationship between Th1/Th2 cytokine patterns and the arthritogenic response in collagen-induced arthritis. Eur J Immunol 26:1511–1518. doi: 10.1002/eji.1830260716. [DOI] [PubMed] [Google Scholar]