

Abstract
More than 10% of the world’s population is chronically infected with HIV, HCV or HBV, which cause severe disease and death. These viruses persist in part because continuous antigenic stimulation causes deterioration of virus-specific cytotoxic T lymphocyte (CTL) function and survival. Additionally, antiviral CTLs autonomously suppress their responses to limit immunopathology by upregulating inhibitory receptors such as Programmed cell death 1 (PD-1). Identification and blockade of the pathways that induce CTL dysfunction may facilitate clearance of chronic viral infections. We have identified that the prostaglandin E2 (PGE2) receptors EP2 and EP4 are upregulated on virus-specific CTLs during chronic LCMV infection and suppress CTL survival and function. We showed that the combined blockade of PGE2 and PD-1 signaling was therapeutic in terms of improving viral control and augmenting the numbers of functional virus-specific CTLs. Thus, PGE2 inhibition is both independent candidate therapeutic target and a promising adjunct therapy to PD-1 blockade for treatment of HIV and other chronic viral infections.
Therapeutic treatments to control or cure chronic viral infections such as HIV are in great need. Those capable of boosting the antigen-specific T cell response without excessive immunopathology would offer the most clinical promise. Many viruses that establish chronic infection have evolved strategies to evade immune detection. However, another equally important process is the host-driven immune suppression that attenuates anti-viral immunity to limit immunopathology. This autoregulation is especially notable for activated CTLs, which by nature cause collateral damage1–3. During HCV, HBV, and HIV infection in humans and lymphocytic choriomeningitis virus Clone 13 (LCMV-CL13) infection in mice, several negative CTL regulators have been identified including regulatory T cells (Tregs), TGF-β and IL-10, and the inhibitory receptors PD-1, TIM-3, CTLA-4, and LAG-31–3. Although the expression of inhibitory molecules is part of the normal autoregulatory machinery observed in all activated CTLs, over time, the persistence of antigen and inhibitory receptor signaling can impair CTL proliferation, survival and effector function (a process commonly referred to as “exhaustion”) or lead to physical depletion of certain epitope-specific CTL populations1–3. In these settings, the ability of CTLs to produce cytokines and kill infected targets is inversely proportional to viral load4,5. Although CTL exhaustion contributes to viral persistence while limiting immunopathology during chronic infection, it also helps virus-specific CTLs persist by diminishing activation induced T cell death (AICD)6–8. Exhausted CTLs are also present in tumors9–11.
Blockade of inhibitory pathways such as PD-1, IL-10, or TGF-β can boost CTL numbers and effector functions in the face of chronic infection and cancer7,11–17. Discovery of additional factors that govern CTL exhaustion may lead to more efficacious treatments. Here, we identify an important role for prostaglandin E2 (PGE2) in suppressing CTL survival and function during chronic LCMV infection. PGE2 is a lipid synthesized from arachidonic acid by the sequential actions of cyclooxygenases (COX-1 or -2) and PGE synthases (PGESs). Microsomal PGES 1 (mPGES1), encoded by Ptges, is likely the most relevant PGES during inflammation and infection in mice and is also found in humans18,19.
PGE2 has a paradoxical role in immune responses, acting as both a pro-inflammatory mediator20 and a potent immunosuppressant, especially in tumors and type I immune responses to limit NK, CD4, and CTL functions19,21,22. In tumors, PGE2 induces IL-10, Tregs, and myeloid derived suppressor cells20,23–25. In CTLs, PGE2 suppresses proliferation, cytotoxicity and IFN-γ production in vitro19, and treatment of mice infected with murine leukemic retrovirus RadLV-Rs (MAIDS) with COX-2 inhibitors restored T-cell proliferative responses26. In this study we identify that the increased expression of the PGE2 receptors EP2 (Ptger2) and EP4 (Ptger4) on virus-specific CTLs contributes to functional exhaustion and viral persistence in LCMV-CL13 infected mice, and that the PGE2 signaling pathway is a promising target of therapeutic intervention, either on its own or with PD-1 blockade.
Results
Virus-specific CTLs upregulate EP2 and EP4 during chronic infection
Whole genome expression profiling of exhausted CTLs revealed that virus-specific CTLs upregulate expression of several inhibitory receptors including the PGE2 receptors EP2 and EP4 during chronic LCMV-CL13 infection4. Using qPCR, we confirmed that Ptger2 and Ptger4 expression increased over the duration of LCMV-CL13 infection compared to cells from naïve and LCMV-Arm infected mice (Supplementary Fig. 1).
CTLs expressing very high levels of PD-1 during chronic viral infection have been demonstrated to be more functionally exhausted than those expressing intermediate levels27–29. To determine if the amount of Ptger2 or Ptger4 expressed in the virus-specific CTLs correlates with PD-1, we isolated PD-1hi and PD-1intermediate CTLs from LCMV-CL13 infected animals and assessed Ptger2 and Ptger4 mRNA by qPCR. We found that PD-1hi CTLs expressed two-fold higher levels of both Ptger2 and Ptger4 mRNA than their PD-1intermediate counterparts (Fig. 1a). Thus, the expression of EP2 and EP4 directly correlated with PD-1 and is higher on the more terminally exhausted CTL subset.
Figure 1. PGE2 signaling directly suppresses CTL function via the receptors EP2 and EP4 during LCMV infection.

(a) Ptger2 and Ptger4 mRNA was measured using qRT-PCR in PD-1hi and PD-1intermediate CD44hi CD8 T cells from LCMV-CL13 infected mice at day 21 p.i. Data are from two independent experiments with a total of 13 mice per group. (b) Whole splenocytes from mice infected with LCMV-Arm or LCMV-CL13 were harvested at day 8 p.i. and cultured for 24 hours. PGE2 was measured in the supernatant by ELISA. Data are from two independent experiments with a total of 8 mice per group. (c–d) Congenically labeled WT or EP2/4 DKO P14+ TCR CD8 T cells were adoptively transferred into WT mice depleted of CD4 T cells and infected with LCMV-CL13. At day 8 p.i., P14+ CD8 T cells were stimulated with GP33-41 peptide with or without 40μM PGE2 for 5hrs and stained for LAMP-1 and intracellular cytokines (IFN-γ, TNF-α, and IL-2). (c) Representative dot plots on left show LAMP-1 and IFN-γ production by P14+ CTLs and those on right show TNF-α and IL-2 production by IFN-γ+ P14+ CTLs. (d) Scatter plots show the compiled frequency of cytokine producing cells in the absence or presence of PGE2. Data above were compiled from three independent experiments with 13 total WT and 14 total EP2/4 DKO mice. (e) Congenically labeled WT or EP2/4 DKO P14+ TCR CD8 T cells were adoptively transferred into WT mice and infected with LCMV-Arm. At day 8 p.i., P14+ CD8 T cells were stimulated with GP33-41 peptide with or without 40μM PGE2 for 1hr. Phosphorylated ERK (pERK) and S6 (pS6) were measured by flow cytometry. Data for part e are representative of 3 independent experiments with a total of 9 mice per group. Data analysis was performed by ANOVA for part b, and by unpaired two-tailed t-test for parts a and d. Error bars depict S.E.M. *P < 0.05, **P < 0.01, and ***P < 0.001.
We also investigated whether PGE2 levels were increased during chronic viral infection by comparing PGE2 production by whole splenocytes isolated from naïve and LCMV-Arm and LCMV-CL13 infected mice (day 8 p.i.). We found that splenocytes from LCMV-CL13 infected mice produced significantly more PGE2 than those from naïve or LCMV-Arm infected mice (Fig. 1b).
PGE2 directly suppresses effector functions of virus-specific CTLs
PGE2 can suppress proliferation, cytotoxicity and cytokine production by activated CTLs in vitro30–33. To determine its effects on CTLs in vivo during chronic viral infection, we generated Ptger2−/−Ptger4fl/flGzmB-cre+ mice (henceforth referred to as “EP2/4 DKO”). In these animals, all cells lack EP2, but only cells that express granzyme B, such as virus-specific CTLs, will lack both EP2 and EP4. We then generated P14+ EP2/4 DKO mice, which express the P14 T cell receptor (TCR) that recognizes the LCMV GP33-41 peptide.
To examine the effects of PGE2 on virus-specific CTL functions, we transferred WT or EP2/4 DKO P14+ CD8 T cells into C57BL/6 mice that we subsequently infected with LCMV-CL13. Eight days later, we stimulated whole splenocytes from these mice with GP33 peptide and measured P14+ CTL cytokine production by intracellular cytokine staining (ICCS). We observed similar percentages of IFN-γ and TNF-α producing cells in WT and EP2/4 DKO P14+ CD8 T cells, but a greater proportion of EP2/4 DKO cells produced IL-2 (Fig. 1c, d). Importantly, the in vitro PGE2 treatment of WT P14+ CTLs suppressed production of all three cytokines, with the greatest effects on TNF-α and IL-2 production (~75–80% inhibition) (Fig. 1c, d). In contrast, PGE2 had very little effect on cytokine production by the EP2/4 DKO P14+ cells, indicating that deletion of EP2 and EP4 abolishes PGE2 signaling in virus-specific CTLs (Fig. 1d). Prior reports have suggested that PGE2 can activate CSK and impair TCR activation34,35. To better understand how PGE2 may suppress TCR signaling, we measured the amounts of phosphorylated ERK (pERK) and S6 (pS6), two molecules downstream of TCR activation, in P14+ CTLs after GP33-41 peptide stimulation with or without PGE2 using phospho-flow cytometry. We found that PGE2 substantially reduced pERK and pS6, indicating that PGE2 can impair both TCR signaling in virus-specific CTLs and cytokine production (Fig. 1e).
PGE2 suppresses virus-specific CTL numbers and function
Next, we examined whether PGE2 suppresses CTL responses during chronic LCMV-CL13 infection. For these studies we used EP2/4 DKO mice and mice deficient in Ptges (henceforth referred to as “mPGES1 KO”) to determine the systemic effects of reduced PGE2 synthesis during LCMV-CL13 infection. We infected WT, EP2/4 DKO, and mPGES1 KO mice with LCMV-CL13 and sacrificed them at day 8 or 21 p.i. Using MHC class I tetramers to measure the frequency and numbers of LCMV-specific CTLs, we observed no significant increase in the virus-specific CTL populations in the EP2/4 DKO and mPGES1 KO mice relative to the WT controls at day 8 p.i. (Supplementary Fig. 2a). However, by day 21 p.i., there was a significant increase (~2 fold) in the frequency and number of virus-specific CTLs in EP2/4 DKO and mPGES1 KO mice versus the WT mice (Fig. 2a, b). The increased numbers of virus-specific CTLs in EP2/4 DKO mice appeared specific to the dual deletion of both PGE2 receptors on CTLs because this was not observed in mice that contained only a germline Ptger2-deficiency (i.e. EP2 KO) (Supplementary Fig. 3).
Figure 2. PGE2-deficient mice have greater numbers of antigen-specific cytokine producing CD8 T cells.

WT, EP2/4 DKO, or mPGES1 KO mice were infected with LCMV-CL13, sacrificed at day 21 p.i., and analyzed by MHC Class I tetramer staining and IFN-γ, TNF-α, and IL-2 ICCS. (a) Representative FACS plots of splenic DbGP33+ CD8 T cells are shown. (b) Stacked bar graphs show the frequency and number of DbNP396-, DbGP33-, and DbGP276-specific CD8 T cells. (c) Representative dot plots of cytokine producing CD8 T cells after GP33-41 peptide stimulation. Plots in left panel are gated on CD8 T cells and plots in right panel are gated on IFN-γ+ CD8 T cells. (d) Stacked bar graphs show numbers of cytokine-producing CD8 T cells for the indicated epitope-specific CD8 T cells. Data were compiled from four experiments with a total of 13 WT, 16 EP2/4 DKO, and 8 mPGES1 KO mice. Statistical analysis was performed using ANOVA. Error bars depict S.E.M. *P < 0.05, **P < 0.01, and ***P < 0.001.
We then measured the ability of the virus-specific CTL populations to produce cytokines in response to peptide stimulation and observed an increase in the percentage and number of cytokine producing cells in the EP2/4 DKO and mPGES1 KO mice relative to the WT mice at day 21 p.i. (Fig. 2c, d, and Supplementary Fig. 4). The number of cells producing IFN-γ and TNF-α was increased ~2–3 fold and the number of IL-2 producing cells was augmented even more (~4–5 fold) in the animals with reduced PGE2 signaling. These data demonstrated that PGE2 signaling directly suppressed CTL cytokine production and contributed to their functional exhaustion. However, despite the clear boost in the number and function of the antiviral CTLs, there was no significant improvement in viral control in the serum, spleen or liver by reducing PGE2 signaling alone (data not shown).
EP2/4 DKO mouse CTLs express more PD-1
During LCMV-CL13 infection, several inhibitory receptors are upregulated on virus-specific CTLs to desensitize their TCRs to antigen4. Despite the increased numbers and cytokine production of virus-specific CTLs, we observed that the expression of PD-1 was increased in the EP2/4 DKO CTLs (Fig. 3). A marginal, but insignificant, increase in PD-1 expression was also observed in the mPGES1 KO mice. Furthermore, PD-1 was also expressed at higher levels on EP2/4 DKO P14+ CTLs versus their WT counterparts (Supplementary Fig. 5), indicating CTL-autonomous upregulation of PD-1. Given that PGE2 can suppress TCR signaling (Fig. 1e) and TCR signaling is a potent inducer of PD-1 expression36, it is possible that TCR signaling is more robust in CTLs lacking PGE2 signaling and this further upregulates their PD-1 expression.
Figure 3. PD-1 expression in antiviral CD8 T cells in WT, EP2/4 DKO and mPGES1 KO mice.
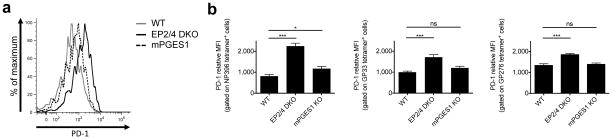
WT, EP2/4 DKO, or mPGES1 KO mice were infected with LCMV-CL13, and sacrificed at day 8 p.i. Splenic CD8 T cells were then stained with MHC class I tetramers and anti-PD-1 antibodies. (a) Histogram plot shows representative expression of PD-1 on DbNP396 tetramer-positive CD8 T cells. (b) Average MFIs of PD-1 expression for the indicated tetramer-positive populations were compiled from two experiments with a 7 total mice per group and analyzed by ANOVA. MFIs were normalized for each experiment to facilitate comparison across experiments. Error bars depict S.E.M. *P < 0.05, ***P < 0.001, and ns indicates not significant.
Co-blockade of PGE2 and PD-1 boosts CTL responses
Recent studies have shown that combined blockade of two or more inhibitory pathways can have additive effects in improving CTL responses during LCMV-CL13 infection28,37. For this reason and because PD-1 was increased on EP2/4 DKO CTLs, we tested the effects of simultaneous blockade of PD-1 and PGE2 on CTL responses and viral control. Following a protocol similar to that used previously7, we depleted WT, EP2/4 DKO, or mPGES1 KO mice of CD4 T cells using GK1.5 (anti-CD4) monoclonal antibody (mAb) treatment, infected them with LCMV-CL13 and then treated them with anti-PD-L1 mAb or vehicle control from days 28–42 p.i.. The loss of CD4 T cell help causes persistent high titer viremia, rapid depletion of NP396-specific CTLs and profound functional exhaustion38. Prior work has shown that blockade of PD-1:PD-L1 signaling in this system enhances CTL numbers and function and reduces viral titers7.
In the CD4 depleted (“helpless”) system, the deletion of EP2 and EP4 had little effect on the LCMV-specific CTL popululation (Fig. 4b). However, the systemic reduction of PGE2 in the mPGES1 KO mice led to an increase (~2-fold) in the number of virus-specific CTLs versus WT mice (Fig. 4c). As expected, anti-PD-L1 treatment in WT mice caused an increase in the numbers of LCMV-specific CTLs versus the vehicle-treated WT controls (Fig. 4a–c). Specifically, anti-PD-L1 blockade in WT mice caused expansion of the GP276- and GP33-specific CTLs, and to a lesser extent, the NP396-specific CTLs (Fig. 4a–c). PD-L1 blockade increased the number of IFN-γ and TNF-α producing CTLs, but did not affect IL-2 production (Fig. 4d–f).
Figure 4. Combination blockade of PD-L1 and PGE2 signaling substantially augments antiviral CTL numbers and function, restores immunodominance hierarchy, and enhances viral control.

EP2/4 DKO, mPGES1 KO, and WT mice were depleted of CD4 T cells and infected with LCMV-CL13. From days 28 to 42 p.i., mice were treated every third day with either anti-PD-L1 (200μg) or PBS and then analyzed at day 42 p.i. (a) Representative FACS plots for splenic DbNP396+ CD8 T cells are shown. (b and c) Stacked bar graphs show the frequency and number of DbNP396-, DbGP33-, and DbGP276-specific CD8 T cells. (d) Representative dot plots of cytokine-producing CD8 T cells after NP396-404 peptide stimulation. Plots in left panel are gated on CD8 T cells and plots in right panel are gated on IFN-γ+ CD8 T cells. (e and f) Stacked bar graphs show numbers of cytokine-producing CD8 T cells for the indicated virus-specific CD8 T cells. Data were compiled from 6 experiments with a total of 19 vehicle-treated WT, 17 vehicle treated EP2/4 DKO, 18 anti-PD-L1 treated WT, and 18 anti-PD-L1 treated EP2/4 DKO mice for the EP2/4 DKO experiments and 2 experiments with a total of 5 vehicle-treated WT, 6 vehicle-treated mPGES1 KO, 6 anti-PD-L1 treated WT, and 7 anti-PD-L1 treated mPGES1 KO mice for the mPGES1 experiments and statistically analyzed using ANOVA. (g) Spleen and serum were harvested from mice infected with LCMV-CL13 at day 42 p.i. Scatter plots show viral titers in serum and spleen measured by plaque assay. Dashed lines indicate limit of detection of the assay (50 pfu/ml for serum assay). Data were compiled from 2 independent experiments with a total of 7 vehicle-treated WT, 5 vehicle-treated mPGES1 KO, 7 anti-PD-L1 treated WT, and 6 anti-PD-L1 treated mPGES1 KO mice and statistically analyzed using ANOVA. Error bars depict S.E.M. *P < 0.05, **P < 0.01, and ***P < 0.001.
The effects of anti-PD-L1 blockade were substantially enhanced in mice deficient in PGE2 signaling. Notably, there was a particularly strong boost (~5 fold or more) in the frequency and numbers of NP396-specific CTLs in the EP2/4 DKO or mPGES1 KO mice treated with anti-PD-L1 versus their WT counterparts (Fig. 4a–c). Blockade of PD-L1 in the EP2/4 DKO mice also increased the numbers of GP34-specific CTLs (Supplementary Fig. 6), another immunodominant virus-specific CTL population normally deleted during LCMV-CL13 infection39. Thus, blockade of PGE2 signaling complemented the effects of anti-PD-L1 therapy and helped restore immunodominant CTLs typically deleted during chronic LCMV-CL13 infection.
We next examined the effects of blocking PD-L1 and PGE2 signaling on antiviral CTL cytokine production. PD-L1 blockade alone potently boosted the frequency and number of IFN-γ - and TNF-α-producing cells (Fig. 4d–f), but a more profound effect was observed on the NP396-specific CTL population when both PD-1 and PGE2 signaling were reduced concomitantly. Notably, we observed four-fold more IL-2-producing CTLs in the EP2/4 DKO and mPGES1 KO mice treated with anti-PD-L1 versus the WT mice treated with anti-PD-L1 (Fig. 4d–f). Moreover, we found 12–15 fold more NP396-specific IL-2 producing CTLs in the anti-PD-L1 treated EP2/4 DKO and mPGES1 KO mice versus anti-PD-L1 treated WT mice, demonstrating that reducing PGE2 signaling increased the functionality of the CTLs in addition to their numbers (Fig. 4d–f).
Co-blockade of PD-L1 and PGE2 enhances viral control
To determine if the combined effects of reduced PD-1:PD-L1 and PGE2 signaling enhanced viral clearance in the (CD4 depleted) “helpless” system, we measured viral titers in the serum and spleen at day 42 p.i. We observed significant reductions in the viral titers in the spleens of mPGES1 KO mice compared to their WT counterparts, indicating that systemic reduction of PGE2 alone enhances viral control (Fig. 4g). However there was no significant difference between the WT and the EP2/4 DKO mice (data not shown). As previously reported7, blockade of PD-L1 alone enhanced viral clearance in the serum and spleen. Notably, the blockade of PD-L1 in mPGES1 KO mice further enhanced viral control. Compared to WT (vehicle treated) controls, the combination of reducing PGE2 and PD-1 signaling simultaneously decreased viral titers by as much as 10–100 fold depending on the tissue examined (Fig. 4g).
Pharmacologic PGE2 inhibition with PD-1 blockade
PGE2 production can be dramatically attenuated via pharmacologic inhibition of COX-2, a key enzyme responsible for the synthesis of PGE2 during immune responses. We tested whether daily oral administration of celecoxib (100mg/kg of chow) could boost anti-viral CTL responses. Mice were depleted of CD4 T cells, infected with LCMV-CL13 and fed celecoxib or control diet. Then, beginning on day 28 p.i., we treated mice with either anti-PD-L1 mAbs or PBS for two weeks. Mice treated with celecoxib alone showed no difference in virus specific CTL percentages, numbers, or cytokine production versus untreated mice (Fig. 5). Moreover, mice treated with anti-PD-L1 mAbs or those co-treated with celecoxib and anti-PD-L1 had similar increases in the total numbers of virus-specific CTLs. However, blockade of both PGE2 and PD-L1 signaling together boosted the percentages of NP396-specific CTLs by ~3–4 fold versus the mice treated with anti-PD-L1 alone, (Fig. 5), mirroring the effects seen in the genetic models (Fig. 4). Co-treatment with celecoxib and anti-PD-L1 increased the number of cytokine-producing NP396-specific CTLs over that of anti-PD-L1 alone, and as observed in the genetic models there was a significant elevation in the numbers of IL-2 producing CTLs (a 4.2-fold increase in the co-treated mice versus those treated with anti-PD-L1 alone). However, this augmentation of T cell function in the co-treated mice was insufficient to lower viral titers over that of anti-PD-L1 alone (data not shown). Nonetheless, these results provide additional support that pharmacological disruption of PGE2 signaling could serve as an adjunct to PD-L1 blockade for boosting the responses of protective, immunodominant CTL populations during chronic antigen exposure.
Figure 5. Pharmacologic PGE2 inhibition with celecoxib enhances antiviral CD8+ T cell response.

WT mice were depleted of CD4 T cells and infected with LCMV-CL13. From days 0–42 p.i., mice received chow milled with or without celecoxib (100mg/kg). From days 28 to 42 p.i., mice were treated every third day with either anti-PD-L1 (200μg) or PBS and then analyzed at day 42 p.i. (a) Representative FACS plots for splenic DbNP396+ CD8 T cells are shown. (b) Stacked bar graphs show the frequency and number of DbNP396-, DbGP33-, and DbGP276-specific CD8 T cells. (c) Representative dot plots of cytokine-producing CD8 T cells after NP396-404 peptide stimulation. Plots in left panel are gated on CD8 T cells and plots in right panel are gated on IFN-γ+ CD8 T cells. (d) Stacked bar graphs show numbers of cytokine-producing CD8 T cells for the indicated virus-specific CD8 T cells. Data were compiled from 3 experiments with a total of 15 vehicle treated, 14 celecoxib-treated, 15 anti-PD-L1 treated, and 15 celecoxib and anti-PD-L1 co-treated mice. Statistical analysis was performed using ANOVA. Error bars depict S.E.M. *P < 0.05.
PGE2 promotes Bim expression in exhausted CTLs
We investigated whether the increased number of NP396-specific CTLs in the anti-PD-L1 treated EP2/4 DKO mice was due to enhanced cell division or survival. To measure T cell proliferation, WT or EP2/4 DKO mice (depleted of CD4 T cells), treated with or without anti-PD-L1, received BrdU in their drinking water during the second week of anti-PD-L1 treatment. The NP396-specific CTLs divided at similar rates in the vehicle-treated WT and EP2/4 DKO mice (~40–50% of the cells incorporated BrdU), indicating reduced PGE2 signaling had little effect on CTL division (Fig. 6a). The rates of cell division increased greatly when PD-1:PD-L1 signaling was blocked (>90% of the cells incorporated BrdU). However, there was no additive effect of blocking PGE2 and PD-1 signaling simultaneously (Fig. 6a). These data suggested that PGE2 signaling was not suppressing division of the virus-specific CTLs during chronic viral infection.
Figure 6. PGE2 signaling suppresses virus-specific CD8 T cell survival but not division.

EP2/4 DKO and WT mice were depleted of CD4 T cells and infected with LCMV-CL13. From days 28 to 42 p.i., mice were treated every third day with either anti-PD-L1 (200μg) or PBS and given BrdU in their drinking water from days 35–42 p.i. At day 42 p.i., the LCMV-specific CD8 T cells were stained for BrdU, active caspases, and intracellular Bim. (a) Representative histogram plots on the top show the amount of BrdU incorporation in the DbNP396+ CD8 T cells and the compiled averages are shown in the bar graph below. (b) LCMV-specific CD8 T cells were stained for active caspases with CaspGLOW to detect apoptosis. Representative dot plots show the percentage of CaspGLOW+ DbNP396+ CD8 T cells and the compiled averages are shown in the bar graph below. (c) Representative histogram plots on the top show the amount of Bim in the DbNP396+ CD8 T cells and the compiled averages are shown in the bar graph below. Data were compiled from 2 experiments with a total of 7 vehicle-treated WT, 6 vehicle treated EP2/4 DKO, 7 anti-PD-L1 treated WT, and 7 anti-PD-L1 treated EP2/4 DKO mice and analyzed using ANOVA. Error bars depict S.E.M. *P < 0.05 and ***P < 0.001.
Next, we analyzed the frequency of CTLs undergoing apoptosis by staining the cells for the pro-apoptotic molecules Bim40 and active caspase-3 (using CaspGLOW reagents)41. Based on these parameters, NP396-specific CTLs in EP2/4 DKO mice exhibited significantly lower rates of apoptosis than their WT counterparts (Fig. 6b, c). The frequency of CaspGLOW positivity and the amounts of Bim within the NP396-specific CTLs in the EP2/4 DKO mice were approximately half that of the WT controls (Fig. 6b, c). A similar reduction in pro-apoptotic NP396-specific CTLs was observed in mice treated with anti-PD-L1, and this effect was enhanced incrementally when PGE2 and PD-1 signaling was blocked simultaneously (Fig. 6b, c). Blocking PGE2 also led to a significant reduction in CaspGLOW positivity in GP33-specific CTLs, but no difference in Bim expression was noted (Supplementary Fig. 7). Blocking PGE2 had no effect on CaspGLOW positivity in GP276-specific CTLs (Supplementary Fig. 7). Thus, PGE2 appears to play a more dominant role in suppressing CTL survival than cell division. These findings indicate that when PGE2 and PD-1 signaling were reduced simultaneously, the combination of decreased CTL death and increased cell division effectively restored the immunodominant NP396-specific CTL population and restrained viral load.
Discussion
A new approach to control or cure chronic viral infections is to augment the numbers and function of virus-specific CTLs via blockade of inhibitory signaling pathways. Here, we demonstrate that PGE2 impairs CTL survival and effector functions during chronic LCMV infection. Blockade of PGE2 signaling either directly on the CTLs (via EP2 and EP4 deletion) or systemically (via mPGES1 deletion or through celecoxib treatment) increased antigen-specific CTL numbers and cytokine production, especially IL-2 production. The reduction of PGE2 in mice lacking mPGES1 also led to improved viral control when CD4 T cell help was absent, a situation typically associated with persistent viremia and marked CTL exhaustion. It is likely that the enhanced viral control observed in the absence of CD4 T cell help in mPGES1 KO mice but not EP2/4 DKO mice, resulted in part from the effects of PGE2 on cell types other than CTLs19,20. Similarly, the finding that EP2/4 DKO mice exhibited a greater increase in viral-specific CTL numbers in CD4 replete versus depleted environments may indicate that PGE2 signaling also suppresses antiviral CD4 T cell responses. Thus, systemic blockade of PGE2 signaling as opposed to focused targeting to CTLs may be of greater therapeutic benefit for boosting T cell responses.
Importantly, we found that simultaneous inhibition of PGE2 and PD-1 signaling during LCMV-CL13 infection had additive effects in boosting CTL numbers, function and viral control, in part by restoring the immunodominant populations of virus-specific CTLs that are typically deleted. Furthermore, administration of celecoxib with anti-PD-L1 boosted NP396-specific CTL responses and IL-2 production, consistent with the phenotype observed in the genetically mutated mice. This provides a rationale for combining NSAID treatment with PD-1:PD-L1 blockade in patients undergoing immunotherapy for cancer or viral infection.
While few studies directly address the effects of blocking PGE2 signaling on dysfunctional CTLs, indirect evidence indicates that therapeutic PGE2 blockade may boost CTL function. For example, T cells from HIV infected individuals have greater amounts of cAMP, and PKA type I antagonists can augment T cell proliferation and IL-2 production42,43. Moreover, treatment of HIV infected individuals with COX-2 inhibitors increased perforin and IFN-γ expression and proliferative responses in T cells32,44,45. The smaller effect size in the celecoxib experiments versus the genetic models might be simply a result of suboptimal celecoxib dosing or alternatively, it is possible that other prostanoids downstream of COX-2 play beneficial roles in antiviral immunity. Nonetheless, the results of the pharmacologic co-treatment studies underscore the potential therapeutic implications of our findings and because NSAIDs have been used worldwide for decades, inhibition of PGE2 signaling is likely to be a safe and affordable adjunctive therapy to PD-1:PD-L1 blockade. Furthermore, several studies have shown that people who take aspirin, and in some cases NSAIDs, on a regular basis have a lower-risk of developing multiple types of cancer46,47. It will be of interest to further explore therapeutic possibilities for enhancement of CTL function using COX-2 blockade, with or without blockade of the PD-1 pathway, in patients with chronic infection or cancer.
PGE2 may impair CTL survival in part by increasing expression of Bim, which is responsible for the deletion of virus-specific CTLs during chronic infection48,49. However, it is unclear which factors induce Bim in antigen-specific CTLs during chronic viral infection. Our data indicate that PGE2 may be one such factor. PGE2-induced cAMP may increase Bim levels in CTLs as increased cAMP and PKA activity stabilizes BimEL and induces apoptosis in thymocytes and lymphoma cell lines50–53. IL-2 is necessary for maintenance of virus-specific CTLs during chronic LCMV infection54–56, and PGE2-mediated repression of IL-2 production may lead to CTL apoptosis, particularly in the NP396-specific T cells. Given that PGE2-induced cAMP has been shown to increase CSK activation and inhibit TCR signaling34,35, altered TCR signaling may account for our observed changes in IL-2 expression.
Reversal of T cell dysfunction is a new and promising approach for treating both chronic viral infection and cancer. Here, we have shown that the lipid, PGE2, suppresses exhausted antigen-specific CTL function and promotes CTL apoptosis. Additionally, we discovered that combined blockade of PGE2 and PD-1 is therapeutically superior to blockade of either one alone in controlling chronic viral infection. Comodulation of PGE2 and PD-1 signaling may represent a potent therapeutic avenue in the treatment of certain chronic diseases.
Online Methods
Mice, infections, treatments, and plaque assays
Six-week-old female C57BL/6 mice were obtained from NCI and used as hosts for the P14+ adoptive transfer experiments (Frederick, MD). Ptger2−/− mice57 and Ptger4-floxed mice58 on the C57BL/6 line were obtained from Vanderbilt University. We used Ptger2+/+Ptger4+/+GzmB-cre+ mice derived from the knockout strains as littermate controls and are referred to as “WT” throughout the manuscript. Genotyping for the WT allele used the primers 5′-CCGGGGTTCTGGGGAATC-3′ and 5′-GTGCATGCGAATGAGGTTGAG-3′. Genotyping for the Ptger2 mutant allele used the primers 5′-TTGCCAAGTTCTAATTCCATCAGA-3′ and 5′-GTGCATGCGAATGAGGTTGAG-3′. Genotyping the Ptger4-floxed mice used the primers 5′GTTAGATGGGGGGAGGGGACAACT-3′ and 5′TCTGTGAAGCGAGTCCTTAGGCT-3′. The floxed gene produced a 334bp band, while the WT allele produced a 243bp band. Ptges−/− mice59 on the C57BL/6 line were obtained from the University of Connecticut Health Center. Genotyping for the mutant allele used the primers 5′-GGAAAACCTCCCGGACTTGGTTTTCAG-3′ and 5′-ATCGCCTTCTATCGCCTTCTTGACGAG-3′. Genotyping for the WT allele used the primers 5′-GGAAAACCTCCCGGACTTGGTTTTCAG-3′ and 5′-CAGTATTACAGGAGTGACCCAGATGTG-3′. Ptger4-floxed mice were crossed to Granzyme B-cre mice60 and then to the Ptger2−/− mice to generate EP2/4 DKO mice. EP2/4 DKO mice were also crossed to Thy1.1+ P14 TCR transgenic (Tg) mice and 5,000 EP2/4 DKO P14+ or WT P14+ CD8 T cells were transferred i.v. into WT C57BL/6 mice to create P14 “chimeric” mice61. Age and gender-matched mice between five and seven weeks of age that were housed in the same room of the same facility were used for each experiment. Mice were randomized to mouse size and litter. The investigators were not blinded to mouse allocation. Group size was chosen to ensure proper statistical reporting and calculation of all relevant metrics. Mice were infected with 2×10⁵ PFU of LCMV-Armstrong (i.p.) or 2×10⁶ PFU of LCMV-CL13 (i.v.)61. For indicated experiments, mice were treated with 200μg i.p. anti-CD4 antibody (Bio X Cell, West Lebanon, NH, clone GK1.5, administered at 1mg/mL) on the day before and after infection and/or 200μg i.p. anti-PD-L1 (Bio X Cell, West Lebanon, NH; clone 10F-982, administered at 1mg/mL) every third day from days 28–42 post LCMV-CL13 infection. For indicated experiments, Celecoxib (Cayman Chemical, Ann Arbor, MI) was milled into mouse chow at a concentration of (100mg/kg). Plaque assays to measure viral load were performed in vero cells as previously described62. All animal experiments followed approved Yale University’s Institutional Animal Care and Use Committee protocols.
Cell isolation, BrdU treatments, and surface and intracellular staining
BrdU (Sigma, St. Louis, MO) was administered at 1mg/mL in the drinking water from days 35–42 post LCMV-CL13 infection and CD8 T cell division was assessed by staining for BrdU incorporation according to manufacturer’s instructions (BD, San Jose, CA). CaspGLOW staining was performed according to manufacturer’s instructions (eBioscience, San Diego, CA). Tetramer staining, surface staining, and T cell stimulation with LCMV peptide was performed as previously described63. DbNP396, DbGP33, and DbGP276 tetramers were generated in house, whereas KbGP34 tetramers were obtained from University of Pennsylvania. Antibodies from the following companies were used to assess protein expression: (1) eBioscience (San Diego, CA): CD8 (clone 53-6.7), CD44 (IM7), IFN-γ (XMG1.2), IL-2 (JES6-5H4), TNF-α (MP6-XT22), Thy1.1 (HIS51), and Thy1.2 (53-2.1); (2) Becton Dickinson (San Jose, CA): Lamp1 (1D4B); (3) BioLegend (San Diego, CA): PD-1 (RMP1-30); and (4) Cell Signaling Technology (Danvers, MA): BIM (polyclonal, Cat#2819). Dead cells were excluded from gating analysis using LIVE/DEAD Fixable Aqua Dead Cell Stain Kit according to the manufacturer’s instructions (Life Technologies, Grand Island, NY). To calculate relative fluorescence for Fig. 3, PD-1 median fluorescence intensities (MFIs) were averaged for DbGP33 tetramer-positive cells from the vehicle-treated WT mice within each replicate experiment. This average MFI was divided through 1,000 to generate a scaling factor by which each sample’s absolute MFI could be divided to yield a normalized relative PD-1 MFI. FoxP3 Fix/Perm Buffer (BioLegend, San Diego, CA) and Perm/Wash Buffer (BD, San Jose, CA) were used for Bim staining. PGE2 (Cayman Chemical, Ann Arbor, MI) was administered at 40μM at the time of peptide administration for the indicated in vitro stimulations. Flow cytometry data were collected using a LSRII machine (BD, San Jose, CA) and analyzed using FlowJo software (Tree Star, Ashland, OR). Cells were sorted using a FACSAria machine (BD, San Jose, CA).
Gene expression by qRT-PCR and ELISAs
For qRT-PCR, RNA was isolated from ~500,000 sorted cells following the instructions provided with the Qiashredder and RNeasy kits (Qiagen, Valencia, CA). cDNA was then synthesized using SSRTII (Invitrogen, Carlsbad, CA). Real time was performed on a Stratagene Mx3000P as previously described61. Relative fold changes were calculated using Rpl9 (L9) expression as a normalization constant.
PGE2 measurement was performed by ELISA (Cayman Chemical, Ann Arbor, MI). For PGE2 measurement, media was harvested from cultures 24 hours after they were set up. Media was spun to precipitate out cellular debris, and the resulting supernatant’s PGE2 content was measured by ELISA.
Statistical Analysis
Statistical analysis was performed using JMP Pro software (SAS institute, Cary, NC). Analysis was performed using unpaired two-tailed t test when comparing two groups. Analysis of three or more groups was performed using one-way ANOVA, followed by LS Means Differences Student’s t post-test of pairings identified as significant by ANOVA. Analysis of anti-PD-L1 treatment versus genotype data used two-way ANOVA. For two-way ANOVA analyses involving cell numbers, percentages, viral titers, and MFI, a log transformation of each datum was performed to normalize each data set prior to running the ANOVA. Assumptions for statistical analyses were met (i.e. normal distribution, equal variance). The single exception was Fig. 5d, which was found to have unequal variances. For this analysis, a non-parametric (Kruskal-Wallis) ANOVA, followed by Dunn’s multiple comparison test was used.
Supplementary Material
Acknowledgments
The authors would like to acknowledge C. Hao (Vanderbilt Univ.) and E. Wherry (Univ. of Pennsylvania) for generously providing EP2- and EP4-deficient mice and KbGP34 tetramers, respectively. This work was supported by RO1AI074699 (SMK), the Yale Medical Scientist Training Program (T32GM07205 (JHC)), and the Howard Hughes Medical Institute (SMK).
FUNDING STATEMENT:
This article was supported by NIH. The grant number is P30 CA016672.
Footnotes
Author Contributions
J.H.C. designed and performed experiments, analyzed data, and wrote the paper; C.J.P., Y-C.T., M.M.S., and C.X.P. designed and performed experiments; I.A.P. analyzed data and designed experiments; D.W.R. provided critical reagents; S.M.K. designed experiments, analyzed data, and wrote the paper.
Competing Financial Interests
The authors declare competing financial interests: Jonathan Chen and Susan Kaech have applied for a patent based, in part, on the findings outlined in this paper.
References
- 1.Shin H, Wherry EJ. CD8 T cell dysfunction during chronic viral infection. Curr Opin Immunol. 2007;19:408–415. doi: 10.1016/j.coi.2007.06.004. [DOI] [PubMed] [Google Scholar]
- 2.Virgin HW, Wherry EJ, Ahmed R. Redefining chronic viral infection. Cell. 2009;138:30–50. doi: 10.1016/j.cell.2009.06.036. [DOI] [PubMed] [Google Scholar]
- 3.Wherry EJ. T cell exhaustion. Nat Immunol. 2011;131:492–499. doi: 10.1038/ni.2035. [DOI] [PubMed] [Google Scholar]
- 4.Wherry E, et al. Molecular Signature of CD8+ T Cell Exhaustion during Chronic Viral Infection. Immunity. 2007 doi: 10.1016/j.immuni.2007.09.006. [DOI] [PubMed] [Google Scholar]
- 5.Lechner F, et al. Analysis of successful immune responses in persons infected with hepatitis C virus. J Exp Med. 2000;191:1499–1512. doi: 10.1084/jem.191.9.1499. [DOI] [PMC free article] [PubMed] [Google Scholar]
- 6.Staron MM, et al. The Transcription Factor FoxO1 Sustains Expression of the Inhibitory Receptor PD-1 and Survival of Antiviral CD8+ T Cells during Chronic Infection. Immunity. 2014;41:802–814. doi: 10.1016/j.immuni.2014.10.013. [DOI] [PMC free article] [PubMed] [Google Scholar]
- 7.Barber D, Wherry E, Masopust D, Zhu B, et al. Restoring function in exhausted CD8 T cells during chronic viral infection. Nature. 2006 doi: 10.1038/nature04444. [DOI] [PubMed] [Google Scholar]
- 8.Mueller S, Matloubian M, Clemens D, Sharpe A, et al. Viral targeting of fibroblastic reticular cells contributes to immunosuppression and persistence. Proceedings of the National Academy of Sciences; 2007. [DOI] [PMC free article] [PubMed] [Google Scholar]
- 9.Baitsch L, et al. Exhaustion of tumor-specific CD8(+) T cells in metastases from melanoma patients. J Clin Invest. 2011;121:2350–2360. doi: 10.1172/JCI46102. [DOI] [PMC free article] [PubMed] [Google Scholar]
- 10.Jin HT, Ahmed R, Okazaki T. Role of PD-1 in regulating T-cell immunity. Current topics in microbiology and immunology. 2011;350:17–37. doi: 10.1007/82_2010_116. [DOI] [PubMed] [Google Scholar]
- 11.Sakuishi K, et al. Targeting Tim-3 and PD-1 pathways to reverse T cell exhaustion and restore anti-tumor immunity. J Exp Med. 2010;207:2187–2194. doi: 10.1084/jem.20100643. [DOI] [PMC free article] [PubMed] [Google Scholar]
- 12.Topalian SL, et al. Safety, activity, and immune correlates of anti-PD-1 antibody in cancer. The New England journal of medicine. 2012;366:2443–2454. doi: 10.1056/NEJMoa1200690. [DOI] [PMC free article] [PubMed] [Google Scholar]
- 13.Day CL, et al. PD-1 expression on HIV-specific T cells is associated with T-cell exhaustion and disease progression. Nature. 2006;443:350–354. doi: 10.1038/nature05115. [DOI] [PubMed] [Google Scholar]
- 14.Tinoco R, Alcalde V, Yang Y, Sauer K, Zuniga EI. Cell-intrinsic transforming growth factor-beta signaling mediates virus-specific CD8+ T cell deletion and viral persistence in vivo. Immunity. 2009;31:145–157. doi: 10.1016/j.immuni.2009.06.015. [DOI] [PMC free article] [PubMed] [Google Scholar]
- 15.Ejrnaes M, et al. Resolution of a chronic viral infection after interleukin-10 receptor blockade. J Exp Med. 2006;203:2461–2472. doi: 10.1084/jem.20061462. [DOI] [PMC free article] [PubMed] [Google Scholar]
- 16.Brooks DG, et al. Interleukin-10 determines viral clearance or persistence in vivo. Nat Med. 2006;12:1301–1309. doi: 10.1038/nm1492. [DOI] [PMC free article] [PubMed] [Google Scholar]
- 17.Redford PS, Murray PJ, O’Garra A. The role of IL-10 in immune regulation during M. tuberculosis infection. Mucosal Immunol. 2011;4:261–270. doi: 10.1038/mi.2011.7. [DOI] [PubMed] [Google Scholar]
- 18.Hara S, et al. Prostaglandin E synthases: Understanding their pathophysiological roles through mouse genetic models. Biochimie. 2010;92:651–659. doi: 10.1016/j.biochi.2010.02.007. [DOI] [PubMed] [Google Scholar]
- 19.Harris SG, Padilla J, Koumas L, Ray D, Phipps RP. Prostaglandins as modulators of immunity. Trends in immunology. 2002;23:144–150. doi: 10.1016/s1471-4906(01)02154-8. [DOI] [PubMed] [Google Scholar]
- 20.Kalinski P. Regulation of immune responses by prostaglandin e2. J Immunol. 2012;188:21–28. doi: 10.4049/jimmunol.1101029. [DOI] [PMC free article] [PubMed] [Google Scholar]
- 21.Linnemeyer PA, Pollack SB. Prostaglandin E2-induced changes in the phenotype, morphology, and lytic activity of IL-2-activated natural killer cells. J Immunol. 1993;150:3747–3754. [PubMed] [Google Scholar]
- 22.Sreeramkumar V, Fresno M, Cuesta N. Prostaglandin E(2) and T cells: friends or foes? Immunology and cell biology. 2011 doi: 10.1038/icb.2011.75. [DOI] [PMC free article] [PubMed] [Google Scholar]
- 23.Strassmann G, Patil-Koota V, Finkelman F, Fong M, Kambayashi T. Evidence for the involvement of interleukin 10 in the differential deactivation of murine peritoneal macrophages by prostaglandin E2. J Exp Med. 1994;180:2365–2370. doi: 10.1084/jem.180.6.2365. [DOI] [PMC free article] [PubMed] [Google Scholar]
- 24.Demeure CE, Yang LP, Desjardins C, Raynauld P, Delespesse G. Prostaglandin E2 primes naive T cells for the production of anti-inflammatory cytokines. European journal of immunology. 1997;27:3526–3531. doi: 10.1002/eji.1830271254. [DOI] [PubMed] [Google Scholar]
- 25.Gabrilovich DI, Nagaraj S. Myeloid-derived suppressor cells as regulators of the immune system. Nat Rev Immunol. 2009;9:162–174. doi: 10.1038/nri2506. [DOI] [PMC free article] [PubMed] [Google Scholar]
- 26.Rahmouni S, et al. Cyclo-oxygenase type 2-dependent prostaglandin E2 secretion is involved in retrovirus-induced T-cell dysfunction in mice. Biochem J. 2004;384:469–476. doi: 10.1042/BJ20031859. [DOI] [PMC free article] [PubMed] [Google Scholar]
- 27.Paley MA, et al. Progenitor and terminal subsets of CD8+ T cells cooperate to contain chronic viral infection. Science. 2012;338:1220–1225. doi: 10.1126/science.1229620. [DOI] [PMC free article] [PubMed] [Google Scholar]
- 28.Blackburn SD, et al. Coregulation of CD8+ T cell exhaustion by multiple inhibitory receptors during chronic viral infection. Nat Immunol. 2009;10:29–37. doi: 10.1038/ni.1679. [DOI] [PMC free article] [PubMed] [Google Scholar]
- 29.Blackburn SD, Shin H, Freeman GJ, Wherry EJ. Selective expansion of a subset of exhausted CD8 T cells by alphaPD-L1 blockade. Proc Natl Acad Sci USA. 2008;105:15016–15021. doi: 10.1073/pnas.0801497105. [DOI] [PMC free article] [PubMed] [Google Scholar]
- 30.Khan MM, Tran AC, Keaney KM. Forskolin and prostaglandin E2 regulate the generation of human cytolytic T lymphocytes. Immunopharmacology. 1990;19:151–161. doi: 10.1016/0162-3109(90)90064-l. [DOI] [PubMed] [Google Scholar]
- 31.Obermajer N, Muthuswamy R, Lesnock J, Edwards RP, Kalinski P. Positive feedback between PGE2 and COX2 redirects the differentiation of human dendritic cells toward stable myeloid-derived suppressor cells. Blood. 2011;118:5498–5505. doi: 10.1182/blood-2011-07-365825. [DOI] [PMC free article] [PubMed] [Google Scholar]
- 32.Pettersen FO, et al. An Exploratory Trial of Cyclooxygenase Type 2 Inhibitor in HIV-1 Infection: Downregulated Immune Activation and Improved T Cell-Dependent Vaccine Responses. J Virol. 2011;85:6557–6566. doi: 10.1128/JVI.00073-11. [DOI] [PMC free article] [PubMed] [Google Scholar]
- 33.Su Y, Jackson EK, Gorelik E. Receptor desensitization and blockade of the suppressive effects of prostaglandin E(2) and adenosine on the cytotoxic activity of human melanoma-infiltrating T lymphocytes. Cancer immunology, immunotherapy: CII. 2011;60:111–122. doi: 10.1007/s00262-010-0924-z. [DOI] [PMC free article] [PubMed] [Google Scholar]
- 34.Brudvik KW, Tasken K. Modulation of T cell immune functions by the prostaglandin E(2) - cAMP pathway in chronic inflammatory states. British journal of pharmacology. 2011 doi: 10.1111/j.1476-5381.2011.01800.x. [DOI] [PMC free article] [PubMed] [Google Scholar]
- 35.Vang T, et al. Activation of the COOH-terminal Src kinase (Csk) by cAMP-dependent protein kinase inhibits signaling through the T cell receptor. J Exp Med. 2001;193:497–507. doi: 10.1084/jem.193.4.497. [DOI] [PMC free article] [PubMed] [Google Scholar]
- 36.Chemnitz JM, Parry RV, Nichols KE, June CH, Riley JL. SHP-1 and SHP-2 associate with immunoreceptor tyrosine-based switch motif of programmed death 1 upon primary human T cell stimulation, but only receptor ligation prevents T cell activation. J Immunol. 2004;173:945–954. doi: 10.4049/jimmunol.173.2.945. [DOI] [PubMed] [Google Scholar]
- 37.Jin HT, et al. Cooperation of Tim-3 and PD-1 in CD8 T-cell exhaustion during chronic viral infection. Proc Natl Acad Sci USA. 2010;107:14733–14738. doi: 10.1073/pnas.1009731107. [DOI] [PMC free article] [PubMed] [Google Scholar]
- 38.Zajac AJ, et al. Viral immune evasion due to persistence of activated T cells without effector function. J Exp Med. 1998;188:2205–2213. doi: 10.1084/jem.188.12.2205. [DOI] [PMC free article] [PubMed] [Google Scholar]
- 39.Wherry EJ, Blattman JN, Murali-Krishna K, van der Most R, Ahmed R. Viral persistence alters CD8 T-cell immunodominance and tissue distribution and results in distinct stages of functional impairment. J Virol. 2003;77:4911–4927. doi: 10.1128/JVI.77.8.4911-4927.2003. [DOI] [PMC free article] [PubMed] [Google Scholar]
- 40.Bouillet P, et al. Proapoptotic Bcl-2 relative Bim required for certain apoptotic responses, leukocyte homeostasis, and to preclude autoimmunity. Science. 1999;286:1735–1738. doi: 10.1126/science.286.5445.1735. [DOI] [PubMed] [Google Scholar]
- 41.Callus BA, Vaux DL. Caspase inhibitors: viral, cellular and chemical. Cell death and differentiation. 2007;14:73–78. doi: 10.1038/sj.cdd.4402034. [DOI] [PubMed] [Google Scholar]
- 42.Aandahl EM, et al. Additive effects of IL-2 and protein kinase A type I antagonist on function of T cells from HIV-infected patients on HAART. Aids. 1999;13:F109–114. doi: 10.1097/00002030-199912030-00001. [DOI] [PubMed] [Google Scholar]
- 43.Aandahl EM, et al. Protein kinase A type I antagonist restores immune responses of T cells from HIV-infected patients. FASEB J. 1998;12:855–862. doi: 10.1096/fasebj.12.10.855. [DOI] [PubMed] [Google Scholar]
- 44.Kvale D, et al. Immune modulatory effects of cyclooxygenase type 2 inhibitors in HIV patients on combination antiretroviral treatment. Aids. 2006;20:813–820. doi: 10.1097/01.aids.0000218544.54586.f1. [DOI] [PubMed] [Google Scholar]
- 45.Johansson CC, et al. Treatment with type-2 selective and non-selective cyclooxygenase inhibitors improves T-cell proliferation in HIV-infected patients on highly active antiretroviral therapy. Aids. 2004;18:951–952. doi: 10.1097/00002030-200404090-00015. [DOI] [PubMed] [Google Scholar]
- 46.Algra AM, Rothwell PM. Effects of regular aspirin on long-term cancer incidence and metastasis: a systematic comparison of evidence from observational studies versus randomised trials. Lancet Oncol. 2012;13:518–527. doi: 10.1016/S1470-2045(12)70112-2. [DOI] [PubMed] [Google Scholar]
- 47.Baron JA, et al. A randomized trial of aspirin to prevent colorectal adenomas. The New England journal of medicine. 2003;348:891–899. doi: 10.1056/NEJMoa021735. [DOI] [PubMed] [Google Scholar]
- 48.Grayson JM, Weant AE, Holbrook BC, Hildeman D. Role of Bim in regulating CD8+ T-cell responses during chronic viral infection. J Virol. 2006;80:8627–8638. doi: 10.1128/JVI.00855-06. [DOI] [PMC free article] [PubMed] [Google Scholar]
- 49.Lopes AR, et al. Bim-mediated deletion of antigen-specific CD8 T cells in patients unable to control HBV infection. J Clin Invest. 2008;118:1835–1845. doi: 10.1172/JCI33402. [DOI] [PMC free article] [PubMed] [Google Scholar]
- 50.Zhang L, Insel PA. The pro-apoptotic protein Bim is a convergence point for cAMP/protein kinase A- and glucocorticoid-promoted apoptosis of lymphoid cells. J Biol Chem. 2004;279:20858–20865. doi: 10.1074/jbc.M310643200. [DOI] [PubMed] [Google Scholar]
- 51.Zhang L, et al. Gene expression signatures of cAMP/protein kinase A (PKA)-promoted, mitochondrial-dependent apoptosis. Comparative analysis of wild-type and cAMP-deathless S49 lymphoma cells. J Biol Chem. 2008;283:4304–4313. doi: 10.1074/jbc.M708673200. [DOI] [PMC free article] [PubMed] [Google Scholar]
- 52.Moujalled D, et al. Cyclic-AMP-dependent protein kinase A regulates apoptosis by stabilizing the BH3-only protein Bim. EMBO Rep. 2011;12:77–83. doi: 10.1038/embor.2010.190. [DOI] [PMC free article] [PubMed] [Google Scholar]
- 53.Zambon AC, Wilderman A, Ho A, Insel PA. Increased expression of the pro-apoptotic protein BIM, a mechanism for cAMP/protein kinase A (PKA)-induced apoptosis of immature T cells. J Biol Chem. 2011;286:33260–33267. doi: 10.1074/jbc.M111.268979. [DOI] [PMC free article] [PubMed] [Google Scholar]
- 54.West EE, et al. PD-L1 blockade synergizes with IL-2 therapy in reinvigorating exhausted T cells. J Clin Invest. 2013;123:2604–2615. doi: 10.1172/JCI67008. [DOI] [PMC free article] [PubMed] [Google Scholar]
- 55.Bachmann MF, Wolint P, Walton S, Schwarz K, Oxenius A. Differential role of IL-2R signaling for CD8+ T cell responses in acute and chronic viral infections. European journal of immunology. 2007;37:1502–1512. doi: 10.1002/eji.200637023. [DOI] [PubMed] [Google Scholar]
- 56.Blattman JN, et al. Therapeutic use of IL-2 to enhance antiviral T-cell responses in vivo. Nat Med. 2003;9:540–547. doi: 10.1038/nm866. [DOI] [PubMed] [Google Scholar]
- 57.Kennedy CR, et al. Salt-sensitive hypertension and reduced fertility in mice lacking the prostaglandin EP2 receptor. Nat Med. 1999;5:217–220. doi: 10.1038/5583. [DOI] [PubMed] [Google Scholar]
- 58.Schneider A, et al. Generation of a conditional allele of the mouse prostaglandin EP4 receptor. Genesis. 2004;40:7–14. doi: 10.1002/gene.20048. [DOI] [PubMed] [Google Scholar]
- 59.Trebino CE, et al. Impaired inflammatory and pain responses in mice lacking an inducible prostaglandin E synthase. Proc Natl Acad Sci USA. 2003;100:9044–9049. doi: 10.1073/pnas.1332766100. [DOI] [PMC free article] [PubMed] [Google Scholar]
- 60.Jacob J, Baltimore D. Modelling T-cell memory by genetic marking of memory T cells in vivo. Nature. 1999;399:593–597. doi: 10.1038/21208. [DOI] [PubMed] [Google Scholar]
- 61.Joshi NS, et al. Inflammation directs memory precursor and short-lived effector CD8(+) T cell fates via the graded expression of T-bet transcription factor. Immunity. 2007;27:281–295. doi: 10.1016/j.immuni.2007.07.010. [DOI] [PMC free article] [PubMed] [Google Scholar]
- 62.Ahmed R, Salmi A, Butler LD, Chiller JM, Oldstone MB. Selection of genetic variants of lymphocytic choriomeningitis virus in spleens of persistently infected mice. Role in suppression of cytotoxic T lymphocyte response and viral persistence. J Exp Med. 1984;160:521–540. doi: 10.1084/jem.160.2.521. [DOI] [PMC free article] [PubMed] [Google Scholar]
- 63.Fuller MJ, Khanolkar A, Tebo AE, Zajac AJ. Maintenance, loss, and resurgence of T cell responses during acute, protracted, and chronic viral infections. J Immunol. 2004;172:4204–4214. doi: 10.4049/jimmunol.172.7.4204. [DOI] [PubMed] [Google Scholar]
Associated Data
This section collects any data citations, data availability statements, or supplementary materials included in this article.