Abstract
Determination of the refractive index of hemoglobin solutions over a wide wavelength range remains challenging. A famous detour approach is the Kramers-Kronig (KK) analysis which can resolve the real part of complex refractive index from the imaginary part. However, KK analysis is limited by the contradiction between the requirement of semi-infinite frequency range and limited measured range. In this paper, based on the Multi-curve fitting method (MFM), continuous refractive index dispersion (CRID) of oxygenated and deoxygenated hemoglobin solutions are measured using a homemade symmetrical arm-linked apparatus in the continuous wavelength range with spectral resolution of about 0.259nm. A novel method to obtain the CRID is proposed.
OCIS codes: (160.4760) Optical properties, (260.2030) Dispersion, (260.6970) Total internal reflection
1. Introduction
As a strongly chromophoric protein, hemoglobin existed in erythrocytes play an important role for blood optical property. The Soret band shift of blood is highly sensitive to the physiological and pathological status of the hemoglobin solution, for example, porphyria. Normally, the absorption spectrum of porphyrins has its Soret band at the UV−VIS edge of 400 nm [1]. Exploiting the related changes in the refractive index (RI) of hemoglobin may provide useful information for diagnostic and therapeutic applications [2], while determination of the continuous refractive index dispersion (CRID) of hemoglobin solution over a wide wavelength range remains challenging. Although insights have been gained through these studies, previous studies have largely focused on several separated wavelengths [3–6]. The Fresnel reflectance measurement [5, 6] can calculate the RI of oxygenated hemoglobin (HbO2) solution, while for high concentrated deoxygenated hemoglobin (Hb) solution, the light is almost saturated. For high concentrated Hb solution, traditional Abbe refractometer also failed.
Spectrometer is now routinely used to resolve the absorption coefficient of hemoglobin [7–10]. A famous roundabout approach to calculate RI is the Kramers-Kronig (KK) analysis [11–13]. With the aid of a half Fourier transform, the real part of complex refractive index can be solved from the imaginary part by measuring the absorption coefficient. As a brilliant method to deal with the causality of the optic filed, KK analysis still has some disadvantages. One of the main drawbacks is the contradiction between the requirement of semi-infinite frequency range of KK analysis and limited measured range [5]. Addition information of RI at anchor point may compensate for this drawback, at the expense of more time-consuming and costly measurements. For example, the optical coherence tomography (OCT) at certain wavelength was carried out when using KK analysis [12].
In this work, based on the multi-curve fitting method (MFM), the CRID of Hb and HbO2 solutions are measured using a homemade symmetrical arm-linked apparatus. The spectral resolution is about 0.259nm in the wavelength range of 400-750nm. We compare the RI values at a certain wavelength measured by CRID measurement with our previous study of derivative total reflection method (DTRM) [14]. Then comparisons among CRID measurement, the Fresnel reflectance measurement [6] and KK analysis [12, 13] are made. CRID measurement greatly contributes as a new characterization technique for its great advantage of for automatic, high resolution, short-time and convenient.
2. Material and method
2.1 Materials
The Hb and HbO2 solutions (Sigma-Aldrich Company Ltd) were prepared by the same procedures as described in Ref.4. Briefly, lyophilized powder of bovine hemoglobin was dissolved in phosphate buffered saline (PBS) to maintain pH at 7.4. Then 10 g/L sodium dithioniteand and 15 g/L sodium bicarbonate solutions were added to get Hb and HbO2 solutions with concentrations of 20, 40, 60, 80, 100, 120, 140, 280, 320 g/L, respectively. All experiments were taken at room temperature.
2.2 CRID measurement and multi-curve fitting method (MFM)
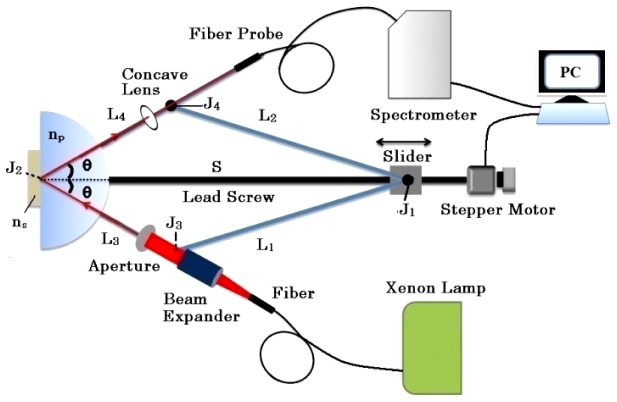
The homemade symmetrical arm-linked apparatus is schematically shown in Fig. 1, which is similar to Ref. 15. Four arms (labeled L1, L2, L3, and L4,) are connected by high precision bearings with intersection points, , , and, respectively. A slider fixed on can move along the lead screw S, driven by a stepper motor. coincides with the center of the semi-cylindrical prism. L1 and L2 function as towed arms. The incident arm L3 is used to mount a light source fiber, a beam expander and an aperture. Light from L3 is first reflected by the prism, then passes through the concave lens () and finally reaches the spectrometer (HR4000, Ocean Optics) on the reflector arm L4. The triangle labeled should satisfy the Law of Cosines, as
| (1) |
where , , and denote the lengths of , and , respectively. ,.
Fig. 1.
Experimental setup for reflectance measurement.
The complex refractive index of sample is defined as . The CRID of water is used for system calibration [16]. As the slider moves along S, totally i*jth reflectance data were collected at ith incident angle and jth wavelength. A computer is used to record all the movement and reflection spectrum information. At a fixed jth wavelength, a Matlab program is used to pick up all the reflectance data for the entire ith incident angle. For unpolarized light at a fixed jth wavelength of ith incident angle, the theoretical reflectance is
| (2) |
here, according to the Fresnel Formula [17], and are the reflectance for TE and TM wave, respectively. and . is the RI of prism. is the reflective angle at the prism-sample interface.
A Multi-curve fitting method (MFM) based on Nelder–Mead simplex algorithm is adopted. For the nonlinear fitting program, from each of the angle-dependent reflectance curve at jth wavelength, can be resolved by minimizing the sum
| (3) |
here, is the measured reflectance. Here,,. is used to calculate the reliability of the fit. is the mean value of measured reflectance over all incident angles. ranges from 0 to 1 and is closer to 1 for a reliable fitting. First, we can obtain the angle-dependent reflection curves and calculate by Eq. (3) at each wavelength. Then we get the CRID of sample over the whole wavelength.
2.3 Kramers-Kronig (KK) analysis
For comparison, KK analysis is used to calculate the RI of Hb and HbO2 solutions. The standard KK analysis can deduce the real component from the imaginary component [13], which is
| (4) |
where is the angular frequency and denotes the Cauchy principal value. , where stands for the speed of light in vacuum and is the absorption coefficient of sample. is measured by CRID measurement. is measured by a spectrometer (U4100, Hitach).
3. Results and discussion
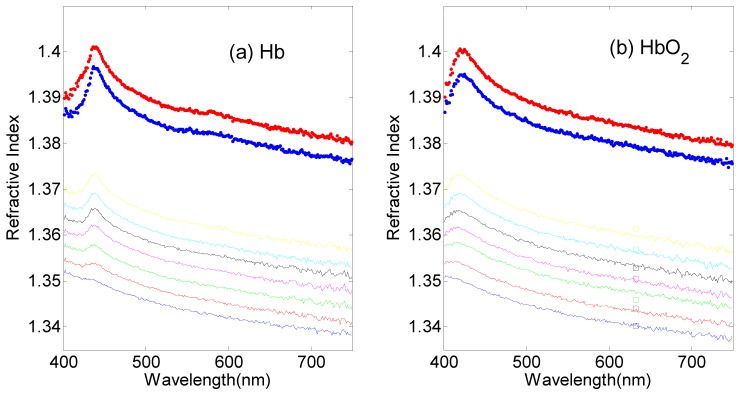
The CRID of Hb and HbO2 solutions with different concentrations are shown in Fig. 2, which vary almost linearly with concentration. We can find the Soret band clearly, which is 438nm for Hb and 421nm for HbO2 solution. For comparison, we measured the RI of some HbO2 solutions at the incident wavelength of 632.8nm by DTRM [14]. According to the Snell’s Law, the RI of sample can be calculated by . is the RI of the prism. By derivative of the reflectance curve, we can obtain at the peak position and then calculate . As shown in Fig. 2(b), the RI values measured by DTRM and CRID measurement fit very well, with a discrepancy of less than 0.002.
Fig. 2.

Plots of the CRID of (a) Hb and (b)HbO2 solutions with concentrations of 20, 40, 60, 80, 100, 120, 140, 280 and 320g/L (from lower to upper lines), respectively. Squares in (b) indicate RI values measured by DTRM at 632.8nm.
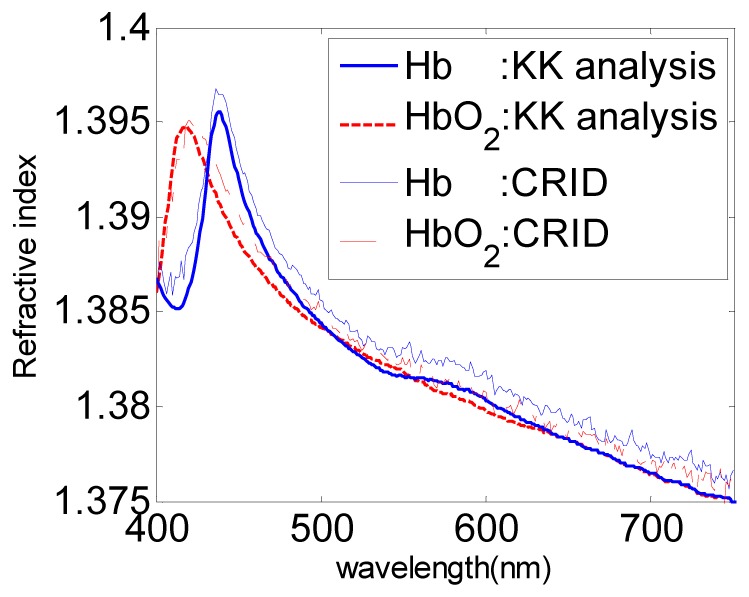
In Fig. 3, we compare CRID of 280g/L HbO2 and Hb solutions calculated by CRID measurement and KK analysis. The Soret band appears almost at the same location for the two methods and the CRID results give fair agreement, with a shift of no more than 0.002. By the way, we have proved the rightness of the work of O. Sydoruk [13] for amendment of Ref.12, which emphasize that the influence of the substrate material should be taken into account when doing the KK analysis. We compare the measured CRID with the Fresnel reflectance measurement [6] and KK analysis [12], and find that our values are much smaller. We speculate that these differences are mainly contributed by the sample difference. Samples in Ref.6 are not highly purified, and other compounds may increase the RI of the solution.
Fig. 3.

The measured CRID of 280g/L HbO2 and Hb solutions, compared with KK analysis.
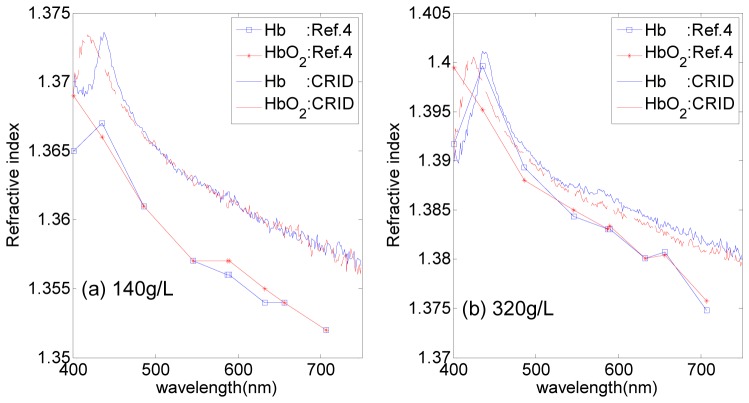
For bovine hemoglobin we used here and human hemoglobin used in Ref.4 were bought from the same Company, we compared the 140g/L and 320g/L solutions with Ref.4 in Fig. 4. For 140g/L Hb solution, the Soret band appears almost at the same position in Fig. 4(a), which is about 438nm for CRID measurement and 436nm for Ref.4. For both 140g/L HbO2 and Hb solutions, we get RI of 1.374 at the peak position of CRID curves. For a fixed wavelength of 140g/L solution, the RIs of bovine HbO2 and Hb solutions are about 0.01 higher than human. For 320g/L solutions, the CRID measurement and Ref.4 fit better, as shown in Fig. 4(b). For HbO2 solution, we can also clearly recognize the Soret band near 421nm for CRID measurement, while for measurement taken at discrete wavelengths in Ref.4, obviously, the position of Soret band was lost just as shown in Fig. 4(b). The results have proved the great advantage of CRID measurement for continuous spectrum.
Fig. 4.
CRID of HbO2 and Hb with concentration of (a) 140g/L, (b) 320g/L, compared with Ref.4
For providing the detailed RI information over a continuous spectral range, CRID measurement shows its great advantage compared with previous studies focused on several separated wavelengths, which may cause the loss of some important information, such as the Soret band [3–6]. As an automated technique, CRID measurement is more convenient compared with Fresnel reflectance measurement [5, 6] and KK analysis [11–13]. Especially, for highly concentrated Hb solutions, CRID measurement is superior to the Fresnel reflectance measurement, for avoiding the problem of light saturation. Compared with KK analysis, we don’t need the spectrometer to measure the absorption coefficient or other approaches to matching the theoretical RI curve to a measured value at a single wavelength. The system error of the CRID measurement is detailed in Ref.15, which is about 0.001.
4. Conclusion
For this study, a homemade symmetrical arm-linked apparatus in combination with the multi-curve fitting method are used to determine the CRID of Hb and HbO2 solutions. CRID measurement is another promising method to resolve the RI of samples over a continuous spectral region, which overcomes the shortages of the existing methods, such as Fresnel reflectance measurement and KK analysis. The setup of CRID measurement shows its great advantage for automatic, high resolution, short-time and convenient.
Acknowledgements
The authors thank the Chinese National Key Basic Research Special Fund (grant 2011CB922003), the Natural Science Foundation of China (grant 61475078, 61405097), the Science and Technology Program of Tianjin (Grant 15JCQNJC02300, 15JCQNJC02600), the International Science & Technology Cooperation Program of China (grant 2013DFA51430).
References and links
- 1.Fuhrhop J.-H., “Porphyrin assemblies and their scaffolds,” Langmuir 30(1), 1–12 (2014). 10.1021/la402228g [DOI] [PubMed] [Google Scholar]
- 2.Mazarevica G., Freivalds T., Jurka A., “Properties of erythrocyte light refraction in diabetic patients,” J. Biomed. Opt. 7(2), 244–247 (2002). 10.1117/1.1463043 [DOI] [PubMed] [Google Scholar]
- 3.Jin Y. L., Chen J. Y., Xu L., Wang P. N., “Refractive index measurement for biomaterial samples by total internal reflection,” Phys. Med. Biol. 51(20), N371–N379 (2006). 10.1088/0031-9155/51/20/N02 [DOI] [PubMed] [Google Scholar]
- 4.Zhernovaya O., Sydoruk O., Tuchin V., Douplik A., “The refractive index of human hemoglobin in the visible range,” Phys. Med. Biol. 56(13), 4013–4021 (2011). 10.1088/0031-9155/56/13/017 [DOI] [PubMed] [Google Scholar]
- 5.Friebel M., Meinke M., “Determination of the complex refractive index of highly concentrated hemoglobin solutions using transmittance and reflectance measurements,” J. Biomed. Opt. 10(6), 064019 (2005). 10.1117/1.2138027 [DOI] [PubMed] [Google Scholar]
- 6.Friebel M., Meinke M., “Model function to calculate the refractive index of native hemoglobin in the wavelength range of 250-1100 nm dependent on concentration,” Appl. Opt. 45(12), 2838–2842 (2006). 10.1364/AO.45.002838 [DOI] [PubMed] [Google Scholar]
- 7.Prahl S. A., “Optical absorption of hemoglobin,” http://omlc.ogi.edu/spectra/hemoglobin/index.html (1999).
- 8.Meinke M., Gersonde I., Friebel M., Helfmann J., Müller G., “Chemometric determination of blood parameters using visible-near-infrared spectra,” Appl. Spectrosc. 59(6), 826–835 (2005). 10.1366/0003702054280603 [DOI] [PubMed] [Google Scholar]
- 9.Nonoyama A., Garcia-Lopez A., Garcia-Rubio L. H., Leparc G. F., Potter R. L., “Hypochromicity in red blood cells: an experimental and theoretical investigation,” Biomed. Opt. Express 2(8), 2126–2143 (2011). 10.1364/BOE.2.002126 [DOI] [PMC free article] [PubMed] [Google Scholar]
- 10.Bosschaart N., Edelman G. J., Aalders M. C. G., van Leeuwen T. G., Faber D. J., “A literature review and novel theoretical approach on the optical properties of whole blood,” Lasers Med. Sci. 29(2), 453–479 (2014). 10.1007/s10103-013-1446-7 [DOI] [PMC free article] [PubMed] [Google Scholar]
- 11.Shumilina S. F., “Dispersion of real and imaginary part of the complex refractive index of hemoglobin in the range 450 to 820 nm,” Bullet. Beloruss. SSR Acad. Sci. 1, 79–84 (1984). [Google Scholar]
- 12.Faber D. J., Aalders M. C. G., Mik E. G., Hooper B. A., van Gemert M. J. C., van Leeuwen T. G., “Oxygen saturation-dependent absorption and scattering of blood,” Phys. Rev. Lett. 93(2), 028102 (2004). 10.1103/PhysRevLett.93.028102 [DOI] [PubMed] [Google Scholar]
- 13.Sydoruk O., Zhernovaya O., Tuchin V., Douplik A., “Refractive index of solutions of human hemoglobin from the near-infrared to the ultraviolet range: Kramers-Kronig analysis,” J. Biomed. Opt. 17(11), 115002 (2012). 10.1117/1.JBO.17.11.115002 [DOI] [PubMed] [Google Scholar]
- 14.Ye Q., Wang J., Deng Z. C., Zhou W. Y., Zhang C. P., Tian J. G., “Measurement of the complex refractive index of tissue-mimicking phantoms and biotissue by extended differential total reflection method,” J. Biomed. Opt. 16(9), 097001 (2011). 10.1117/1.3615657 [DOI] [PubMed] [Google Scholar]
- 15.Deng Z., Wang J., Ye Q., Sun T., Zhou W., Mei J., Zhang C., Tian J., “Continuous refractive index dispersion measurement based on derivative total reflection method,” Rev. Sci. Instrum. 86(4), 043101 (2015). 10.1063/1.4916256 [DOI] [PubMed] [Google Scholar]
- 16.Born M., Wolf E., Principles of Optics, Pergamon, New York: (1959). [Google Scholar]
- 17.Daimon M., Masumura A., “Measurement of the refractive index of distilled water from the near-infrared region to the ultraviolet region,” Appl. Opt. 46(18), 3811–3820 (2007). 10.1364/AO.46.003811 [DOI] [PubMed] [Google Scholar]


