

Abstract
The in-vivo optical properties of the human head are investigated in the 600–1100 nm range on different subjects using continuous wave and time domain diffuse optical spectroscopy. The work was performed in collaboration with different research groups and the different techniques were applied to the same subject. Data analysis was carried out using homogeneous and layered models and final results were also confirmed by Monte Carlo simulations. The depth sensitivity of each technique was investigated and related to the probed region of the cerebral tissue. This work, based on different validated instruments, is a contribution to fill the existing gap between the present knowledge and the actual in-vivo values of the head optical properties.
OCIS codes: (170.5280) Photon migration, (170.3660) Light propagation in tissues, (170.6935) Tissue characterization, (300.0300) Spectroscopy
1. Introduction
The term Neurophotonics has been recently coined to refer to all the scientific disciplines that are working actively and in synergy at the interface between optics and neuroscience. [1] In particular, optical methods like fast optical signal (FOS) [2,3], diffuse correlation spectroscopy (DCS) [4] and functional near infrared spectrosocpy (fNIRS) [5–7] use red and near infrared light (e.g. 600–900 nm) to noninvasively investigate brain structures and brain functions, and proved to be complementary to existing neuroimaging techniques like electroencephalography, functional magnetic resonance imaging or positron emission tomography.
A common aspect among FOS, DCS and fNIRS is the fact that the useful information is encoded by photons that, after travelling through the intact head and interacting with brain cortex, are eventually remitted. Independently from the nature of the interaction with brain cortex (e.g. mediated by cell swelling in FOS or by the neurovascular coupling in DCS and fNIRS), photons strongly interact with all head structures.
To a first approximation, the human head can be considered, from an optical point of view, an heterogeneous layered structure constituted by a derma layer (scalp), a bone layer (skull), an irregular and relatively thin layer of cerebrospinal fluid (CSF), a layer of gray matter and finally a deep region of white matter [8]. Light propagation is strongly affected by this heterogeneity. In particular the CSF has been object of a lot of investigations due to its “light guiding” effect depending on its transparency [9] and to its reticular structure composed by arachnoids that can strongly affect the scattering of light [10–12].
A robust knowledge of the optical properties (namely the absorption coefficient and the reduced scattering coefficient) of head structures is undoubtedly fundamental, not only for the technical optimisation of these techniques, but also for a deeper understanding of their potential. For example, the assessment of basic parameters like the volume probed by light, the light penetration depth and also the mean optical pathlength can be made if a priori information on both anatomical and optical parameters are available [13]. Moreover, the knowledge of the optical properties on a broad spectral range provides further information on the tissue: the scattering spectrum is related to the structure and the absorption spectrum to the composition [14].
In literature there are studies reporting on ex-vivo or post-mortem measurements for the characterization of the human head optical properties, [15–20] but they are not representative of an in-vivo condition.
Few studies focus on in vivo optical properties [21–23], but the data presented are preliminary, or limited to few subjects, or obtained after approximations (e.g. the head was modelled as homogeneous medium). Further, cross-validation with other methodology was not reported.
Therefore optical parameters remain poorly determined: intra- and inter-subject variations are scarcely present, as well as age dependence. This reduces the overall matching between simulations and measurements, and therefore may have confounding effects on the design of tailored instrumentation.
In this work we approached the complex study of light propagation in the human head by a combined effort set forth by multiple collaborating groups. Instead of dealing with a global approach based on 3D tomographic reconstruction on a realistic anatomical map of the whole head [24–26], we have preferred the robustness and simplicity of a local approach aiming at determining the optical properties in a specific location of the head. Different experimental methods, namely continuous wave and time domain diffuse reflectance spectroscopy, and robust physical models derived from photon diffusion or transport theory (e.g. Monte Carlo) were used. The local approach has been also explored by Hallacoglu et al [27] with a frequency-domain setup. The added value of this work, besides the higher number of volunteers involved, is the application of the different experimental techniques to the same subjects.
The paper is structured as follows: in section 2 all the experimental setups used in the work are reported; section 3 is focused on the measurement protocol adopted for each instrument; in section 4 data analysis algorithms and models are described; in sections 5 and 6 absorption and scattering spectra are presented and discussed, respectively; in section 7 experimental data are validated with Monte Carlo simulations; final remarks are pointed out in section 8.
2. Experimental setups
2.1. Continuous wave camera-based system (CW-camera)
ILM (see affiliation list) developed a CW apparatus [Fig. 1(a)] for measurement of the spatially resolved reflectance [28]. A CCD camera (Pixis 512B, Princeton Instruments, USA) was used as detector and a Xenon lamp with a monochromator was the source of illumination which is tunable between 450 nm and 950 nm. The forehead was illuminated with a top hat profile (600 μm diameter) and the spatially resolved reflectance was averaged for all pixels with the same distance to the center of the illumination profile. The signal was evaluated from a distance of 1 mm over a dynamic range of approximately three orders of magnitude up to a maximum distance of 23 mm. The spatial resolution using a 512 x 512 pixel sensor was approximately 90 μm. The raw data measured with the CCD chip was corrected for the system response function and the actual beam profile of the illumination. For application on the subjects an ophthalmologic head holder was used to reproducibly adjust the forehead with respect to the optical setup.
Fig. 1.

Experimental setups: a) Continuous-wave camera-based system (CW-camera), b) Time-resolved broadband spectroscopy system (TR-spectr), c) Discrete wavelength time-resolved spectroscopy system (TR-discr), d) Single wavelength time-resolved system (TR-single).
2.2. Time-resolved broadband spectroscopy system (TR-spectr)
The system [29] developed by POLIMI (see affiliation list), used also in a variety of applications, [30–32] is depicted in Fig. 1(b). A supercontinuum pulsed laser source (SC450, Fianium, UK) operating at the repetition rate of 40 MHz was used for illumination. Wavelength selection was achieved by means of the rotation of a Pellin-Broca prism, and then focusing the dispersed light onto an adjustable slit acting as a band-pass filter, using an achromatic doublet (f=150 mm). A 4x telescope was inserted before the prism to reduce the beam divergence and improve spectral resolution. The radiation was subsequently coupled into a 100 μm core graded-index fibre by a couple of achromatic doublets and sent to the sample. Light diffused through the head was collected using a 1 mm core multimodal step-index fibre and then focused on a cooled microchannel plate photomultiplier, with a S1 surface with sensitivity extending over 1100 nm (R1564U, Hamamatsu, Japan). The overall temporal resolution was <70 ps (FWHM of the instrument response function) over the whole spectral range used for in-vivo measurements (600–1100 nm). The injection and collection fibres were put in contact with the head using a soft black rubber band that was bent over the head. The signal from the detector was driven to a Time-Correlated Single Photon Counting (TCSPC) board together with the synchronization signal, routed directly from the laser. To allow for short measurement times and higher reproducibility, the acquisition of the time-resolved curves was completely automated.
2.3. Discrete wavelength time-resolved spectroscopy system (TR-discr)
The system [33] developed by POLIMI is depicted in Fig. 1(c). The instrument was operated at few discrete wavelengths (650, 690, 730, 830, 850 nm) with the goal to derive few spectral measurements at a high S/N ratio. The system was based on a supercontinuum laser (SC450, Fianium, UK) operating at the repetition rate of 40 MHz and a hybrid detector (HPM-100-50, Becker & Hickl, Germany) coupled to a TCSPC board. The synchronization signal taken directly from the laser. A wheel of interference filters provided spectral selection both on the injection and collection side. Measurements were obtained on the head at 2 interfiber distances (2 and 4 cm) using an EEG cuff properly modified to host NIRS optodes.
2.4. Single wavelength time-resolved system (TR-single)
The system [34] developed by IBIB (see affiliation list) is shown in Fig. 1(d). A femtosecond laser (MaiTai, Spectra Physics, USA) was used to generate laser pulses at wavelength of 760 nm with a frequency of 80 MHz. The light was delivered to the investigated medium with the use of an optical fiber (diameter of 600 μm). On the surface of the head a beam expander was applied in order to distribute the laser light (power of 300 mW) on a tissue area with a diameter of 15 mm. The detector was a small-size photomultiplier tube (ϕ=8 mm, R7400U-02, Hamamatsu, Japan) equipped with a high-voltage power supplier (C4900-01, Hamamatsu, Japan) and a preamplifier (HFA-D, Becker & Hickl). The detector was mounted in a metallic box and it was positioned directly on the surface of the head at a distance of 9 cm from the center of the source.
3. Measurement protocol
The details on the specific protocols used for the measurements with the 4 setups are summarized in Table 1. The measurements obtained with CW-camera, TR-spectr and TR-discr were taken on the same 9 subjects.
Table 1. Measurement protocol.
| Setup/Partner | Spectral range | Num. subjects | Positions | Source-detector distance | Acq. time per point/wavelength |
|---|---|---|---|---|---|
| CW-camera (ILM) | 450–950 nm | 9 | center forehead | 0.1 – 2.3 cm | 5–60 s |
| TR-spectr (POLIMI) | 600–1100 nm step of 20 nm | 9 | right forehead | 1.7, 2.7 cm | 10 s |
| TR-discr (POLIMI) | 650, 690, 730, 830, 850 nm | 9 | left/right forehead | 2, 4 cm | 60 s |
| TR-single (IBIB) | 760 nm | 2 | left hemisphere | 9 cm | 60 s |
4. Data analysis
4.1. Homogeneous CW model (CW-homo)
The CW reflectance data was analyzed by fitting the experimental data with an analytical solution of the CW reflectance of a semi-infinite homogeneous medium calculated by means of the diffusion approximation of the Radiative Transport Equation. Hereby, the improved solution of the diffusion equation [35] applying a combination of the flux and the fluence under consideration of extrapolated boundary conditions was used. The best fit for the reduced scattering coefficient and for the absorption coefficient (μa) was reached with a Levenberg-Marquardt algorithm [36].
4.2. Homogeneous time-resolved model (TR-homo)
The reduced scattering and absorption (μa) spectra were constructed by plotting, versus wavelength, the values obtained from fitting an analytical solution of the diffusion approximation of the radiative transport equation for an homogeneous semi-infinite medium, using the extrapolated boundary conditions [37] to the experimental data. The theoretical time-dispersion curve was convolved with the instrument response function and normalized to the area of the experimental curve. The fitting range included all points with a number of counts higher than 80% of the peak value on the rising edge of the curve and 1% on the tail. The best fit was reached with a Levenberg-Marquardt algorithm by varying both and μa to minimize the error norm χ2 [36].
4.3. Two-layers time-resolved model (TR-2L)
Data were analyzed as for the previous (TR-homo) approach, apart from the solution of the diffusion equation, that was derived for a 2-layer slab geometry, with a semi-infinite lower layer [38]. A total of 5 free fitting parameters were used in the inversion procedure, namely, the absorption and reduced scattering coefficients of the upper and the lower layer, and the upper layer thickness. The fit was performed using simultaneously the photon distributions at the two interfiber distances [39,40].
4.4. Homogeneous diffusive sphere (TR-sphere)
Data obtained at the longest interfiber distance with TR-single have been analyzed using the analytical solution under the diffusion approximation for a homogeneous diffusive sphere taking into account the non-negligible curvature effect of the head [41]. A curvature radius of 10 cm was used.
5. Results
Figure 2 shows the absorption and reduced scattering coefficients for 9 volunteers obtained by fitting the homogeneous CW model (CW-homo) to the measurement acquired with the camera-based system (CW-camera). Absorption spectra show a strong variability among subjects possibly influenced by the different optical properties and thickness of the scalp. For all the subjects is clear the steep absorption increase towards short wavelength dominated by the deoxyhaemoglobin spectrum and the week peak around 760 nm due to oxyhaemoglobin. The reduced scattering coefficient strongly decreases with increasing wavelength possibly due to the high collagen content of the scalp.
Fig. 2.
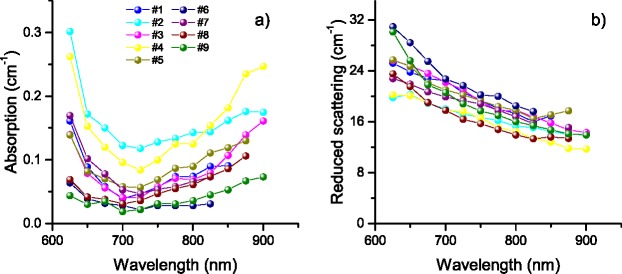
CW-camera system: retrieved absorption (a) and reduced scattering spectra (b) for 9 volunteers.
Figure 3 shows the absorption and reduced scattering spectra derived using the TR broadband system (TR-spectr) and the homogeneous model for analysis (TR-homo). The absorption spectra for each volunteer exhibit the deoxy-haemoglobin absorption tail in the red spectral region and the peak around 760 nm, together with the water absorption peak at 970 nm. Scattering spectra are lower and less steep than in the CW case. Both the absorption and the reduced scattering spectra show large intersubject variations, that could be ultimately responsible for large differences both in signal level and amount of activation in functional NIR spectroscopy measurements.
Fig. 3.

TR-spectr system: retrieved absorption (a) and reduced scattering spectra (b) for 9 volunteers.
Figure 4 shows the analysis performed on each subject on the forehead using the 2-layer model (TR-2L) applied to the measurements taken using the discrete-wavelength TR spectroscopy system (TR-discr). Also in this case there is a large intersubject variability but there is a clear difference between upper layer spectra [Fig. 4(a)–(b)] and lower layer spectra [Fig. 4(c)–(d)]. On the average, upper layer absorption spectra are flatter and lower in absolute value than the spectra related to the lower layer. Reduced scattering spectra are higher in the upper than the lower layer and they are weakly wavelength-dependent. The retrieved thicknesses present large intersubject variability ranging from a minimum value of 5 mm to a maximum of 10 mm. The data fitted with the diffusive sphere model (TR-sphere) and collected using the single-wavelength setup (TR-single) are μa = 0.17, and μa = 0.15 cm−1, for the two subjects, respectively.
Fig. 4.

TR-discr system: retrieved absorption and reduced scattering spectra for 9 volunteers. (a) and (c) represent the absorption for the upper and lower layer, respectively. (b) and (d) represent the reduced scattering for the upper and lower layer, respectively.
6. Discussion
A comparison of the results obtained with the different methods by all the partners involved in this work is reported in Fig. 5 where absorption (a) and reduced scattering (b) spectra are shown for different setups and models. The plots refer to the median value of all subjects, while the bars represent the 25th and 75th percentile. Concerning absorption, these findings are consistent with a lower absorption coefficient detected in the upper layer (the scalp, and possibly the skull). The results from TR-discr analyzed with the 2-layer model (TR-2L) are, in fact, in good agreement with the CW camera measurements, that probes the most superficial structure. Conversely, the time-resolved measurements analyzed with a homogeneous model (TR-homo) probe more the deeper layers (skull, clear layer and brain), retrieving a higher absorption, in substantial agreement with the estimate of the deeper layer properties derived using the 2-layer model (TR-2L). For the reduced scattering coefficient, the CW data exhibit quite large values, well distinct from time-resolved results. Also looking at the steepest slope, that resembles the collagen fibrils rapidly descending scattering [14], it is possible to make the hypothesis that CW methods provide the optical properties of the scalp (with high scattering contribution from the skin), while time-resolved homogeneous data is more related to the skull (with the typical flat scattering of bone filled with bone marrow). The scattering of the lower layer obtained with the 2-layer model is quite small possibly due to the clear layer influence. The thickness of the first layer retrieved with the 2-layer model has a median value of 7.8 mm with 25th and 75th percentile respectively of 7.1 and 8.4 mm, in good agreement with data reported in literature [12]. We observe also that the measurement obtained with TR-single at 9 cm interfiber distance presents a reduced scattering closer to the one of the lower layer. This confirms the fact that, provided a high enough S/N ratio, signal due to photons with a long time-of-flight are related to deep regions of the tissue. Nonetheless, when dealing with reflectance measurements, photon migration is mostly influenced by the optical properties of the medium covering the activation spot, and effective values related to some average properties can be just crucial in predicting the detected signal or interpreting in vivo data. All these findings will be further validated in section 7 using simulations applying the derived optical properties. It is worth noting that all methods display a similar range of variability, possibly ascribed to the intersubject differences.
Fig. 5.
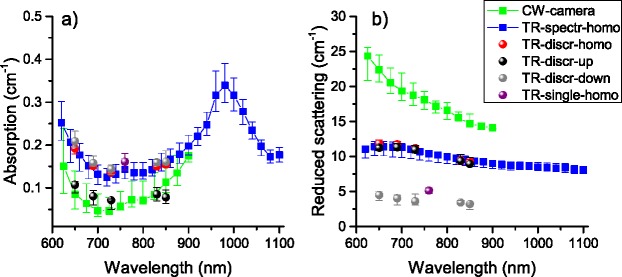
Median absorption (a) and reduced scattering spectra (b) among 9 subjects. Bars refer to the 25th and 75 percentile limits.
7. Validation by simulations
To validate all the findings discussed in section 6, Monte Carlo simulations have been performed using the code provided by UNIFI (see affiliation list) based on the microscopic Beer-Lambert method [42, 43]. A 3-layer laterally-infinite medium was simulated using two combinations of reduced scattering and thicknesses (Table 2). Reduced scattering values are taken from the values at 830 nm of the measurements discussed in section 6 and thicknesses are derived from literature [11, 12, 44]. Homogeneous refractive index (1.4) and anisotropy factor (0.8) have been fixed. In case 1 the reduced scattering coefficient of the first layer is derived from CW measurements, assuming these are related to the superficial layer (scalp); reduced scattering coefficient for the second and third layers are derived from TR measurements analyzed with the two-layers model. In case 2 the reduced scattering of the first layer is changed to the same value of the second layer for studying the effect of a variation in the first layer scattering, being this layer the most effective in determining photon trajectories inside the diffusive medium. The absorption coefficients used, also derived by measurements, are: 0.05 and 0.15 cm−1. These values have been imposed in all the three layers and all the combinations have been studied. It is worth noting that, using a MC code based on the microscopic Beer-Lambert method, it is possible to introduce different combinations of absorption without running new simulations.
Table 2. Reduced scattering coefficients and thicknesses for the three layers used for MC simulations.
| Reduced scattering (cm−1) | Case 1 | Case 2 |
|---|---|---|
| 16 | 10 | |
| 10 | 10 | |
| 3.5 | 3.5 | |
|
| ||
| Thickness (cm) | ||
|
| ||
| s1 | 0.4 | 0.4 |
| s2 | 0.8 | 0.8 |
| s3 | 10 | 10 |
7.1. Homogeneous CW model (CW-homo)
CW diffuse reflectance was computed for distances up to 23 mm simulating the experimental condition. Data have been fitted as a whole using a maximum dynamic range of three orders of magnitude. A summary of the results is shown in Fig. 6. As expected, the fitted reduced scattering is close to the value of the first layer. This is obvious as the small distances in the spatially resolved reflectance bears photons that have travelled mainly short path lengths through the medium. In addition the retrieved can be even higher than the highest value of the simulation and depends on the absorption coefficient. Results for the absorption coefficient show that the fitted values mainly follow the trend of the second layer, although there are huge errors in the absolute values due to the influence of the first layer. In fact, the calculation from MC data of the mean pathlength spent by photons inside each layer shows a predominant contribution of the second layer with respect to the others.
Fig. 6.

CW-homo: case 1 (left column) and case 2 (right column).
7.2. Homogeneous TR model (TR-homo)
Time-resolved diffuse reflectance has been simulated at 2 and 9 cm interfiber distance. Results are shown in Fig. 7 and 8. The reduced scattering coefficient is almost intermediate between first and second layer for the measurement at 2 cm and intermediate between the second and third layer for the measurement at 9 cm. This confirms the assumption that TR data analyzed with an homogeneous model are mainly related to the scattering of the skull at a short distance, with the possibility to probe also the scattering of the brain as long as there is enough signal to increase the source-detector separation and thus collecting photons with a longer time-of-flight. Results on the fitted absorption confirm that at 2 cm interfiber distance, TR measurements analyzed with an homogenous model provide intermediate results between the second and third layer, notwithstanding a change in both absorption and scattering of the first layer. This shows a higher sensitivity to deeper layers in the time domain with respect to CW data [13]. Finally the absorption retrieved using the longer source-detector separations (9 cm) is related to the third layer, confirming our hypothesis.
Fig. 7.

TR-homo: reflectance at 2 cm interfiber distance. Case 1 (left column) and case 2 (right column).
Fig. 8.

TR-homo: reflectance at 9 cm interfiber distance. Case 1 (left column) and case 2 (right column).
7.3. Two-layers time-resolved model (TR-2L)
Time-resolved diffuse reflectance was simulated at 2 and 4 cm interfiber distance like in the experimental measurements. Five free parameters were fitted: absorption and reduced scattering of upper and bottom layers and the thickness of the upper layer. A summary of the results is shown in Fig. 9. The reduced scattering fitted for the upper layer is intermediate between the first (4 mm thick) and second (8 mm thick) simulated layers, also in good agreement with the TR data fitted with the homogeneous model. The reduced scattering of the lower layer follows well the third layer. Results on the fitted absorption show that the upper absorption is mostly related to the second layer with a slight influence in absolute value due to the first layer. The absorption fitted for the bottom layer perfectly follows the trend of the third layer. This behaviour can be justified by calculating the mean pathlengths spent by photons in each layer as a function of the time-of-flight [38]: for all the investigated cases roughly after 2–3 ns the pathlength spent in the bottom layer is predominant on the one spent in the other layers. Finally, the fitted thickness is about 10 mm for case 1 representing an intermediate depth between the first and the second layer, and about 12 mm for case 2 in agreement with the simulation parameters.
Fig. 9.

TR-2L: case 1 (left column) and case 2 (right column).
A diagram showing a summary of the comparison between measurements and simulations is shown in Fig. 10.
Fig. 10.
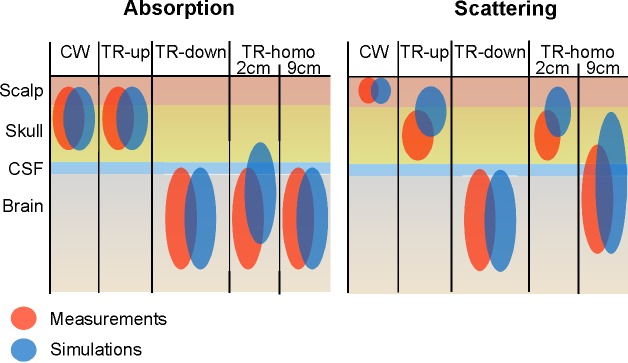
Schematic of the comparison between measurements and simulations. Colored bubbles represents a possible estimate on the volume probed by the measurements performed using the technique/data analysis in the column header.
8. Conclusions
In this work we approached the in vivo assessment of the optical properties of the human head using different experimental techniques and data analysis provided by different collaborating groups and applied to the same subject. Measurements show a large intersubject variation both in absorption and scattering. From the combined analysis of measurements and MC simulations it is possible to identify two regions for the absorption: the upper one (scalp and skull) with lower absorption (e.g. 0.07 cm−1@830 nm) and the lower (brain and CSF) with high absorption (e.g. 0.15 cm−1@830 nm). For the reduced scattering three regions can be identified: upper (scalp) with very high scattering (e.g. 16 cm−1@830 nm), medium (skull) with intermediate scattering (e.g. 10 cm−1@830 nm) and lower (brain and CSF) with small scattering (e.g. 4 cm−1@830 nm). Clearly, for the low reduced scattering in the lowest layer and the small volume compared to the brain, CSF contribution cannot be ruled out.
In the literature there is an evident lack of experimental investigations on the actual values of the optical properties of the different tissues of the adult head. Looking back at previously published papers [21–23, 45, 46] we can see that the few existing works were obtained using homogeneous models of the head and this makes the use of these numbers uncertain due to the complex structure of such medium. Moreover, the few existing studies and the lack of standardization procedures among the instruments employed make this knowledge still not yet consolidated. This fact is also revealed by the large spread between the different values retrived in different papers that cannot be always explained by the intersubject variability. In the recent review paper by Jacques [14], the values shown for the reduced scattering coefficient of the brain at wavelengths in the range 500–1000 nm can also differ by about 100%. For this evident reason the present study, based on measurements obtained with different types of instrumentation, is a contribution to filling in the gap existing between the present knowledge and the actual values of the optical properties of the head. This uncertain knowledge can be also noted in the numbers for the optical properties used in the forward models developed for the head and proposed in tissues optics that show a large spread of values through the years [11,12,24,26,38,44,47–49]. Thus, a better knowledge of the optical properties of the head would help to improve the modelling of photon migration for applications of near infrared light for the head.
Acknowledgments
The research leading to these results has received funding from the European Community’s Seventh Framework Programme under the nEUROPt Project (grant agreement FP7-HEALTH-2007-201076). The authors are also grateful to Simon Arridge and Heidrun Wabnitz for collaboration and fruitful discussions.
References and links
- 1.Boas D., “Welcome to neurophotonics,” Neurophoton 1, 10101 (2014). 10.1117/1.NPh.1.1.010101 [DOI] [PMC free article] [PubMed] [Google Scholar]
- 2.Chiarelli A. M., Di Vacri A., Romani G. L., Merla A., “Fast optical signal in visual cortex: improving detection by general linear convolution model,” Neuroimage 66, 194–202 (2013). 10.1016/j.neuroimage.2012.10.047 [DOI] [PubMed] [Google Scholar]
- 3.Sun B., Zhang L., Gong H., Sun J., Luo Q., “Detection of optical neuronal signals in the visual cortex using continuous wave near-infrared spectroscopy,” Neuroimage 87, 190–198 (2014). 10.1016/j.neuroimage.2013.11.003 [DOI] [PubMed] [Google Scholar]
- 4.Durduran T., Yodh A. G., “Diffuse correlation spectroscopy for non-invasive, micro-vascular cerebral blood flow measurement,” Neuroimage 85, 5163 (2014). 10.1016/j.neuroimage.2013.06.017 [DOI] [PMC free article] [PubMed] [Google Scholar]
- 5.Ferrari M., Quaresima V., “A brief review on the history of human functional near-infrared spectroscopy (fNIRS) development and fields of application,” Neuroimage 63, 921–935 (2012). 10.1016/j.neuroimage.2012.03.049 [DOI] [PubMed] [Google Scholar]
- 6.Scholkmann F., Kleiser S., Metz A. J., Zimmermann R., MataPavia J., Wolf U., Wolf M., “A review on continuous wave functional near-infrared spectroscopy and imaging instrumentation and methodology,” Neuroimage 85, 6–27 (2014). 10.1016/j.neuroimage.2013.05.004 [DOI] [PubMed] [Google Scholar]
- 7.Torricelli A., Contini D., Pifferi A., Caffini M., Re R., Zucchelli L., Spinelli L., “Time domain functional NIRS imaging for human brain mapping,” Neuroimage 85, 28–50 (2014). 10.1016/j.neuroimage.2013.05.106 [DOI] [PubMed] [Google Scholar]
- 8.Ellis H., “Anatomy of head injury,” Surgery 30, 99–101 (2012). [Google Scholar]
- 9.Villringer A., Chance B., “Non-invasive optical spectroscopy and imaging of human brain function,” Trends Neurosci. 20, 435–442 (1997). 10.1016/S0166-2236(97)01132-6 [DOI] [PubMed] [Google Scholar]
- 10.Dehghani H., Delpy D. T., “Near-infrared spectroscopy of the adult head: effect of scattering and absorbing obstructions in the cerebrospinal fluid layer on light distribution in the tissue,” Appl. Opt. 39, 4721–4729 (2000). 10.1364/AO.39.004721 [DOI] [PubMed] [Google Scholar]
- 11.Okada E., Delpy D. T., “Near-infrared light propagation in an adult head model. I. Modeling of low-level scattering in the cerebrospinal fluid layer,” Appl. Opt. 42, 2906–2914 (2003). 10.1364/AO.42.002906 [DOI] [PubMed] [Google Scholar]
- 12.Custo A., Wells W. M., Barnett A. H., Hillman E. M. C., Boas D. A., “Effective scattering coefficient of the cerebral spinal fluid in adult head models for diffuse optical imaging,” Appl. Opt. 45, 4747–4755 (2006). 10.1364/AO.45.004747 [DOI] [PubMed] [Google Scholar]
- 13.Del Bianco S., Martelli F., Zaccanti G., “Penetration depth of light re-emitted by a diffusive medium: theoretical and experimental investigation,” Phys. Med. Biol. 47, 4131–4144 (2002). 10.1088/0031-9155/47/23/301 [DOI] [PubMed] [Google Scholar]
- 14.Jacques S. L., “Optical properties of biological tissues: a review,” Phys. Med. Biol. 58, 37–61 (2013). 10.1088/0031-9155/58/11/R37 [DOI] [PubMed] [Google Scholar]
- 15.Cheong W. F., Prahl S. S., Welch A. A., “A review of the optical properties of biological tissues,” IEEE J. Quantum Electron. 26, 2166–2185 (1990). 10.1109/3.64354 [DOI] [Google Scholar]
- 16.Van der Zee P., Essenpreis M., Delpy D. T., “Optical properties of brain tissue,” Proc. SPIE 1888 454 (1993). [Google Scholar]
- 17.Firbank M., Hiraoka M., Essenpreis M., Delpy D. T., “Measurement of the optical properties of the skull in the wavelength range 650–950 nm,” Phys. Med. Biol. 38, 503–510 (1993). 10.1088/0031-9155/38/4/002 [DOI] [PubMed] [Google Scholar]
- 18.Simpson C. R., Kohl M., Essenpreis M., Cope M., “Near-infrared optical properties of ex vivo human skin and subcutaneous tissues measured using the Monte Carlo inversion technique,” Phys. Med. Biol. 43, 2465–2478 (1998). 10.1088/0031-9155/43/9/003 [DOI] [PubMed] [Google Scholar]
- 19.Yaroslavsky A. N., Schulze P. C., Yaroslavsky I. V., Schober R., Ulrich F., Schwarzmaier H. J., “Optical properties of selected native and coagulated human brain tissues in vitro in the visible and near infrared spectral range,” Phys. Med. Biol. 47, 2059–2073 (2002). 10.1088/0031-9155/47/12/305 [DOI] [PubMed] [Google Scholar]
- 20.Taddeucci A., Martelli F., Barilli M., Ferrari M., Zaccanti G., “Optical properties of brain tissue,” J. Biomed. Opt. 1, 117 (1996). 10.1117/12.227816 [DOI] [PubMed] [Google Scholar]
- 21.Bevilacqua F., Piguet D., Marquet P., Gross J. D., Tromberg B. J., Depeursinge C., “In vivo local determination of tissue optical properties: applications to human brain,” Appl. Opt. 38, 4939–4950 (1999). 10.1364/AO.38.004939 [DOI] [PubMed] [Google Scholar]
- 22.Choi J., Wolf M., Toronov V., Wolf U., Polzonetti C., Hueber D., Safonova L. P., Gupta R., Michalos A., Mantulin W., Gratton E., “Noninvasive determination of the optical properties of adult brain: near-infrared spectroscopy approach,” J. Biomed. Opt. 9, 221 (2004). 10.1117/1.1628242 [DOI] [PubMed] [Google Scholar]
- 23.Comelli D., Bassi A., Pifferi A., Taroni P., Torricelli A., Cubeddu R., Martelli F., Zaccanti G., “In vivo time-resolved reflectance spectroscopy of the human forehead,” Appl. Opt. 46, 1717–1725 (2007). 10.1364/AO.46.001717 [DOI] [PubMed] [Google Scholar]
- 24.Okada E., Firbank M., Schweiger M., Arridge S. R., Cope M., Delpy D. T., “Theoretical and experimental investigation of near-infrared light propagation in a model of the adult head,” Appl. Opt. 36, 21–31 (1997). 10.1364/AO.36.000021 [DOI] [PubMed] [Google Scholar]
- 25.Barnett A. H., Culver J. P., Sorensen A. G., Dale A., Boas D. A., “Robust inference of baseline optical properties of the human head with three-dimensional segmentation from magnetic resonance imaging,” Appl. Opt. 42, 3095–3108 (2003). 10.1364/AO.42.003095 [DOI] [PubMed] [Google Scholar]
- 26.Fukui Y., Ajichi Y., Okada E., “Monte Carlo prediction of near-infrared light propagation in realistic adult and neonatal head models,” Appl. Opt. 42, 2881–2887 (2003). 10.1364/AO.42.002881 [DOI] [PubMed] [Google Scholar]
- 27.Hallacoglu B., Sassaroli A., Fantini S., “Optical Characterization of Two-Layered Turbid Media for Non-Invasive, Absolute Oximetry in Cerebral and Extracerebral Tissue,” PLoS One 8, e64095 (2013). 10.1371/journal.pone.0064095 [DOI] [PMC free article] [PubMed] [Google Scholar]
- 28.Foschum F., Jäger M., Kienle A., “Fully automated spatially resolved reflectance spectrometer for the determination of the absorption and scattering in turbid media,” Rev. Sci. Instrum. 82, 103104 (2011). 10.1063/1.3648120 [DOI] [PubMed] [Google Scholar]
- 29.Bargigia I., Tosi A., BahgatShehata A., Della Frera A., Farina A., Bassi A., Taroni P., Dalla Mora A., Zappa F., Cubeddu R., Pifferi A., “Time-resolved diffuse optical spectroscopy up to 1700 nm by means of a time-gated InGaAs/InP single-photon avalanche diode,” Appl. Spectrosc. 66, 944–950 (2012). 10.1366/11-06461 [DOI] [PubMed] [Google Scholar]
- 30.Bassi A., Farina A., D’Andrea C., Pifferi A., Valentini G., Cubeddu R., “Portable, large-bandwidth time-resolved system for diffuse optical spectroscopy,” Opt. Express 15, 14482–14487 (2007). 10.1364/OE.15.014482 [DOI] [PubMed] [Google Scholar]
- 31.Farina A., Bargigia I., Janeček E.-R., Walsh Z., D’Andrea C., Nevin A., Ramage M., Scherman O. a., Pifferi A., “Nondestructive optical detection of monomer uptake in wood polymer composites,” Opt. Lett. 39, 228–231 (2014). 10.1364/OL.39.000228 [DOI] [PubMed] [Google Scholar]
- 32.D’Andrea C., Obraztsova E. A., Farina A., Taroni P., Lanzani G., Pifferi A., “Absorption spectroscopy of powdered materials using time-resolved diffuse optical methods,” Appl. Opt. 51, 7858–7863 (2012). 10.1364/AO.51.007858 [DOI] [PubMed] [Google Scholar]
- 33.Torricelli A., Spinelli L., Kaethner J., Selbeck J., Franceschini A., Rozzi P., Zude M., “Non-destructive optical assessment of photon path lengths in fruit during ripening: implications on design of continuous-wave sensors,” in “Int. Conf. Agric. Eng.”, (Valencia, 2012). [Google Scholar]
- 34.Liebert A., Sawosz P., Milej D., Kacprzak M., Weigl W., Botwicz M., Maczewska J., Fronczewska K., Mayzner-Zawadzka E., Królicki L., Maniewski R., “Assessment of inflow and washout of indocyanine green in the adult human brain by monitoring of diffuse reflectance at large source-detector separation,” J. Biomed. Opt. 16, 046011 (2011). 10.1117/1.3574018 [DOI] [PubMed] [Google Scholar]
- 35.Kienle A., Patterson M. S., “Improved solutions of the steady-state and the time-resolved diffusion equations for reflectance from a semi-infinite turbid medium,” J. Opt. Soc. Am. A 14, 246–254 (1997). 10.1364/JOSAA.14.000246 [DOI] [PubMed] [Google Scholar]
- 36.Press W. H., Teukolsky S. A., Vetterling W. T., Flannery B. P., Numerical Recipes: The Art of Scientific Computing (Cambridge University Press, Cambridge, 1988). [Google Scholar]
- 37.Martelli F., Contini D., Taddeucci A., Zaccanti G., “Photon migration through a turbid slab described by a model based on diffusion approximation. II. Comparison with Monte Carlo results,” Appl. Opt. 36, 4600–4612 (1997). 10.1364/AO.36.004600 [DOI] [PubMed] [Google Scholar]
- 38.Martelli F., Sassaroli A., Del Bianco S., Zaccanti G., “Solution of the time-dependent diffusion equation for a three-layer medium: application to study photon migration through a simplified adult head model,” Phys. Med. Biol. 52, 2827–2843 (2007). 10.1088/0031-9155/52/10/013 [DOI] [PubMed] [Google Scholar]
- 39.Martelli F., Del Bianco S., Zaccanti G., Pifferi A., Torricelli A., Bassi A., Taroni P., Cubeddu R., “Phantom validation and in vivo application of an inversion procedure for retrieving the optical properties of diffusive layered media from time-resolved reflectance measurements,” Opt. Lett. 29, 2037–2039 (2004). 10.1364/OL.29.002037 [DOI] [PubMed] [Google Scholar]
- 40.Kienle A., Patterson M. S., Dögnitz N., Bays R., Wagnières G., Van den Bergh H., “Noninvasive Determination of the Optical Properties of Two-Layered Turbid Media,” Appl. Opt. 37, 779 (1998). 10.1364/AO.37.000779 [DOI] [PubMed] [Google Scholar]
- 41.Sassaroli A., Martelli F., Zaccanti G., Yamada Y., “Performance of Fitting Procedures in Curved Geometry for Retrieval of the Optical Properties of Tissue from Time-Resolved Measurements,” Appl. Opt. 40, 185–197 (2001). 10.1364/AO.40.000185 [DOI] [PubMed] [Google Scholar]
- 42.Sassaroli A., Martelli F., “Equivalence of four Monte Carlo methods for photon migration in turbid media,” J. Opt. Soc. Am. A. Vis. 29, 2110–2117 (2012). 10.1364/JOSAA.29.002110 [DOI] [PubMed] [Google Scholar]
- 43.Martelli F., Del Bianco S., Ismaelli A., Zaccanti G., Light Propagation through Biological Tissue and Other Diffusive Media, Press Monographs (SPIE Press, Bellingham, WA, USA,2010). 10.1117/3.824746 [DOI] [Google Scholar]
- 44.Okada E., Delpy D. T., “Near-infrared light propagation in an adult head model. II. Effect of superficial tissue thickness on the sensitivity of the near-infrared spectroscopy signal,” Appl. Opt. 42, 2915–2922 (2003). 10.1364/AO.42.002915 [DOI] [PubMed] [Google Scholar]
- 45.Zhao J., Ding H. S., Hou X. L., Zhou C. L., Chance B., “In vivo determination of the optical properties of infant brain using frequency-domain near-infrared spectroscopy,” J. Biomed. Opt. 10, 024028 (2005). 10.1117/1.1891345 [DOI] [PubMed] [Google Scholar]
- 46.Sassaroli A., Martelli F., Tanikawa Y., Tanaka K., Araki R., Onodera Y., Yamada Y., “Time-Resolved Measurements of in vivo Optical Properties of Piglet Brain,” Opt. Rev. 7, 420–425 (2000). 10.1007/s10043-000-0420-3 [DOI] [Google Scholar]
- 47.Selb J., Ogden T. M., Dubb J., Fang Q., Boas D. a., “Comparison of a layered slab and an atlas head model for Monte Carlo fitting of time-domain near-infrared spectroscopy data of the adult head,” J. Biomed. Opt. 19, 16010 (2014). 10.1117/1.JBO.19.1.016010 [DOI] [PMC free article] [PubMed] [Google Scholar]
- 48.Ogoshi Y., Okada E., “Analysis of light propagation in a realistic head model by a hybrid method for optical brain function measurement,” Opt. Rev. 12, 264–269 (2005). 10.1007/s10043-005-0264-y [DOI] [Google Scholar]
- 49.Kim S., Lee J. H., “Near-Infrared Light Propagation in an Adult Head Model with Refractive Index Mismatch,” ETRI J. 27, 377–384 (2005). 10.4218/etrij.05.0104.0056 [DOI] [Google Scholar]