Summary
Spatial working memory, the caching of behaviorally relevant spatial cues on a timescale of seconds, is a fundamental constituent of cognition. While the prefrontal cortex and hippocampus are known to jointly contribute to successful spatial working memory, the anatomical pathway and temporal window for interaction of these structures critical to spatial working memory has not yet been established. Here, we find that direct hippocampal-prefrontal afferents are critical for encoding, but not for maintenance or retrieval, of spatial cues. These cues are represented by the activity of individual prefrontal units in a manner that is dependent on hippocampal input only during the cue-encoding phase of a spatial working memory task. Successful encoding of these cues appears to be mediated by gamma-frequency synchrony between the two structures. These findings indicate a critical role for the direct hippocampal-prefrontal afferent pathway in the continuous updating of task-related spatial information during spatial working memory.
Introduction
Spatial working memory (SWM) is an essential feature of goal-directed action. Locating a resource, a threat, or even oneself within a dynamic or unfamiliar environment requires a cached representation of relevant spatial features that must be continuously updated, preserved, and applied as needed to the execution of adaptive behaviors 1. Despite long-standing interest in the neurobiological underpinnings of SWM, its multiple cognitive components, distributed anatomical constituents, and distinct temporal phases have rendered its underlying circuit mechanisms elusive 2-6. Nevertheless, an extensive body of work supports the idea that the prefrontal cortex (PFC) plays a central role in the successful execution of tasks requiring SWM 7. Moreover, the joint contribution of medial prefrontal cortex (mPFC) and hippocampus (HPC) supports successful SWM in rodents 8-12. It remains unclear, however, which phase(s) of SWM (encoding, maintenance, and/or retrieval) require the joint participation of the HPC and mPFC, what behaviorally relevant information is conveyed between the two structures, and by what anatomical pathway(s) they interact.
Direct HPC-mPFC connectivity is confined to a unidirectional projection from the CA1/subiculum of the ventral-most two-thirds of the hippocampus (vHPC) 13-15. Cells in both vHPC and mPFC exhibit location-specific firing 16-19, and damage to the vHPC disrupts goal-related activity in the mPFC 16, suggesting that the direct vHPC-mPFC projection may transmit critical location information during SWM tasks.
Here, we use a rodent delayed non-match-to-place (DNMTP) task, known to require activity in the vHPC and mPFC, to test the role of vHPC-mPFC afferents in SWM. We applied a projection-specific, optogenetic silencing approach that afforded anatomical and temporal precision. Inhibiting vHPC-mPFC direct input disrupted encoding, but not maintenance or retrieval, of location cues necessary for task performance. Furthermore, we found that goal-selective firing in the mPFC was dependent on vHPC direct input exclusively during the encoding phase of each trial. Finally, we found evidence suggesting that the transmission of task-critical information in the vHPC-mPFC pathway is mediated by the synchronization of mPFC units to gamma oscillations in the vHPC. Together, these findings suggest the direct vHPC-mPFC pathway enables the encoding of salient spatial cues during SWM performance.
Optogenetic inhibition of vHPC terminals
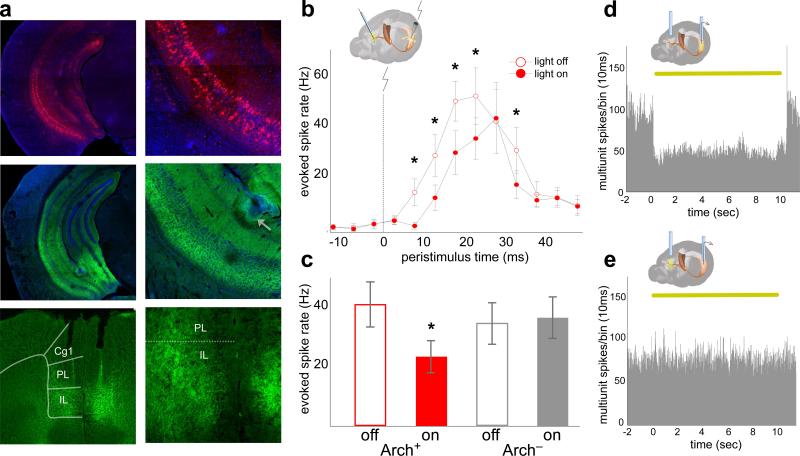
To specifically interfere with vHPC-mPFC inputs, a projection-specific targeting approach was used. An adeno-associated virus vector (AAV2/5) engineered to express fluorescently-labeled archaerhodopsin (eArch3.0-eYFP) 20,21 was targeted to subfield CA1 of vHPC in mice (Methods). Robust expression was seen in dendrites and axons of vHPC and in projection axons in the mPFC (1a).
Arch-mediated hyperpolarization of distal axon terminals disrupted synaptic transmission in vivo without affecting spontaneous vHPC firing. The effect of terminal illumination on synaptic transmission was measured in acutely anesthetized mice. Electrical stimuli were delivered via a bipolar stimulating electrode to ventral CA1 in both Arch-expressing (Arch+) mice and Arch-negative controls (Arch−). Postsynaptic multiunit responses were observed in the mPFC (Fig. 1b). Light pulses delivered to the mPFC on interleaved trials reduced the evoked response by ~40% for Arch+ animals but not Arch− animals (Fig. 1b,c). To measure the effects of terminal illumination on vHPC cell bodies, mice were implanted with optical fiber-coupled stereotrodes in the vHPC and optical fibers in the mPFC. In the awake, resting state, light pulses delivered to vHPC reduced local spontaneous multiunit activity by ~50% (Fig. 1d), while illumination of terminal fields in the mPFC had no effect on multi-unit activity in the vHPC (Fig. 1e). These experiments demonstrated successful and specific inhibition of terminals in vivo, an approach which was then applied to a behavioral paradigm to examine what role the vHPC-mPFC projection plays in spatial working memory.
Fig. 1. Optogenetic inhibition of vHPC-mPFC terminals in vivo.
(a) Expression of Arch (middle row, green) and mCherry (top row, red) in ventral CA1. Arrow, lesion marking electrode location. Bottom row, Arch in terminals in the prelimbic (PL) and infralimbic (IL) mPFC.
(b) mPFC multi-unit responses to vHPC stimulation in Arch+ mice (n=16 sites from 3 animals, ANOVA F=5.6, p=0.02 for light effect, *p<0.05, post-hoc t-test. Baseline rate=6.1 +/− 0.14Hz). Error bars, +/− s.e.m. (throughout, unless otherwise noted).
(c) Group mean evoked mPFC spike rate summed across 5-40ms post-stimulus. (ANOVA F=31.4, p=4×10⁻⁶ for virus-light interaction; n=16 sites from 3 mice, t=6.68, p=0.0004; n=17 sites from 3 mice, t=1.57, p=0.3, for Arch+ and Arch− mice, respectively).
(d, e) Multiunit activity (MUA) traces from vHPC of Arch+ mice during somatic (d) and terminal field (e) illumination in vivo. Yellow bar, light on (throughout).
Terminal inhibition impairs encoding
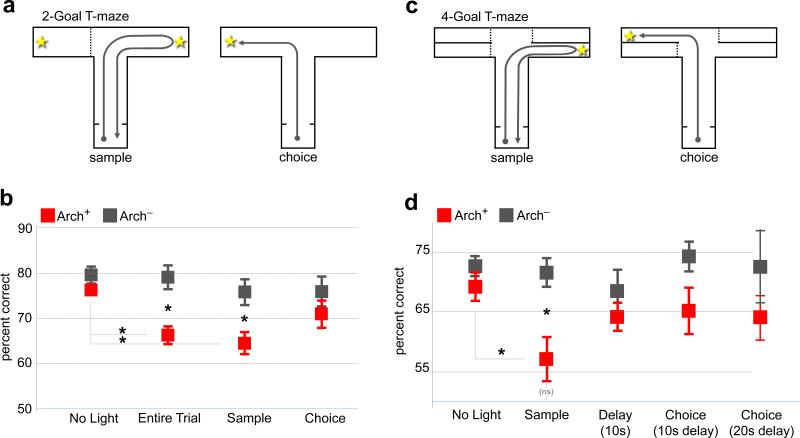
To assay working memory performance, a T-maze DNMTP task was employed. In this task, each trial is divided into three phases (Fig. 2a). In the sample phase, one of two goal locations is blocked by a wall, and the mouse is directed toward a food reward in the open location; during this phase the animal must encode the location of the sample goal. In the delay phase, the mouse returns to the start box and must maintain the sample goal in working memory during a variable delay (Methods). In the choice phase, the wall is removed, and the mouse must select the previously closed arm in order to receive a second reward. Following successful task acquisition, light was delivered to vHPC-mPFC terminal fields in Arch+ and Arch− mice during the Entire Trial, the sample phase only (Sample Light), or the choice phase only (Choice Light). Trial types were randomly interleaved.
Fig. 2. Inhibition of vHPC-mPFC terminals impairs encoding.
(a) 2 Goal DNMTP task.
(b) Effect of mPFC illumination on performance in the 2-Goal task differed by trial phase and virus type (ANOVA, virus-by-light interaction, F=5.92, p=0.02). Post-hoc tests revealed effects of Entire Trial (t=3.96, p=0.002) and Sample (t=2.98, p=0.011) but not Choice (t=1.1, p=0.29) illumination in Arch+ (n=8) vs. Arch− (n=6) animals. Entire Trial and Sample but not Choice performance differed from the No Light condition in Arch+ (t=4.9, p=0.002, Entire Trial; t=4.5, p=0.003, Sample; t=1.7, p=0.125; Choice) but not Arch− animals (t=0.18, p=0.87; t=1.1, p=0.3; t=1.3, p=0.25, respectively).
(c) 4-Goal DNMTP task.
(d) Effect of illumination of mPFC terminal fields on performance in the 4-Goal task (Arch+, n=7 Arch−, n=6, ANOVA F=3.1, p=0.03 for virus-by-light interaction). Impairment was restricted to Sample trials (t=3.1, p=0.0093; and t=1.1, p=0.29; t=1.0, p=0.34; t=1.91, p=0.08; t=1.2, p=0.24, for No Light, Delay, Choice 10s, and Choice 20s, respectively). No Light and Sample performance were significantly reduced in Arch+ (t= 2.5, p=0.04) but not Arch− mice (t=0.35, p=0.73). Performance of Arch+ mice during Sample Light runs was not significantly above chance (t=1.9, p=0.11).
In Arch+ but not Arch− mice, performance was impaired in Entire Trial and Sample Light conditions; Choice Light did not result in a statistically significant impairment (Fig. 2b). These data raised the possibility that vHPC-mPFC input is critical for the encoding of location cues associated with sample goal but may not be required for the retrieval of such cues.
This native version of the T-maze task, however, is not optimized to discriminate between encoding and retrieval of the sample goal location, as the animal could begin forming a motor action plan (i.e. “go into the opposite arm”) any time after it encounters the sample goal. To better segregate the encoding, maintenance, and retrieval phases within each trial, a modified, 4-goal T-maze was constructed (Fig. 2c). Here, as in the 2-goal task, a single goal was made available for retrieval of the sample reward. During the choice run, the sample goal and one of the other three arms were open. This design prevents the mouse from formulating a spatially-directed action plan until the choice phase, when, at the end of its center arm run, it is presented with two of the four goals as options (Supplementary Video). Thus, selection of the choice goal was temporally restricted to the choice phase, separating out encoding from retrieval.
Again, performance was impaired in the Sample Light condition, confirming the requirement for vHPC-mPFC input during encoding (Fig. 2d). In the Choice Light condition (repeated here with either 10 or 20 second delays), a slight trend toward impairment did not reach significance, and post-hoc power analysis revealed that an n of 37 animals/group would have been required to detect a paired difference given the observed effect size. There was also no significant impairment with terminal illumination during the delay period (Delay Light; Fig. 2d). Although we cannot conclusively rule out an effect of terminal inhibition during choice, these experiments indicate that input from the vHPC to the mPFC is critical for encoding of spatial cues.
Effect on spatial representation in mPFC
The behavioral findings suggested that task-related spatial locations may be represented by firing rates in the mPFC in a vHPC input-dependent manner. Therefore, recordings of multiple single units were obtained from the prelimbic region of the mPFC in mice performing the 4-goal task (Extended Data Fig. 1). 792 well-isolated single units were obtained from 9 mice. 44% of mPFC single units displayed selectivity for one or both spatial dimensions that distinguished goal arms (left/right, back/front), and/or their interaction, as assayed by 2-way ANOVA (Extended Data Fig. 2a-d). Given the inhomogeneous and distributed nature of the representation of spatial information among recorded mPFC units, a maximum margin linear classifier 22 was used to decode sample goal location from binned population firing rate vectors and to quantify the strength and reliability of the neural representation (Fig. 3). The classifier was cross-validated by training on data from half of the trials and testing the model's performance on data from the remainder (see Methods).
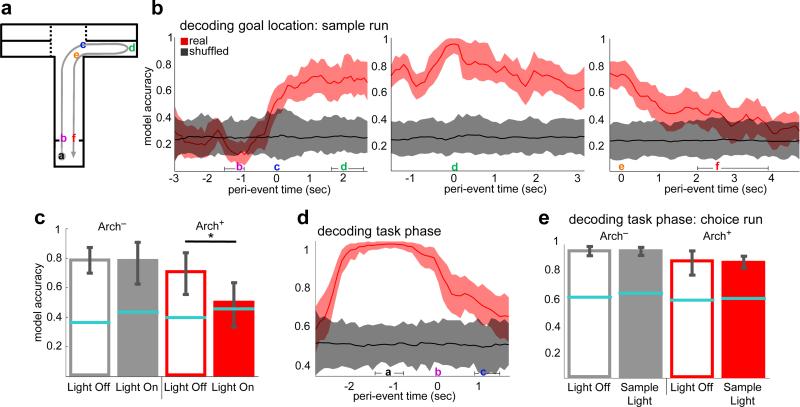
Fig. 3. mPFC units require vHPC input to encode location but not task phase.
(a) Schematic of sample run.
(b) Accuracy of goal decoding during sample run with light off. Solid lines, mean decoder accuracy; shaded areas, 95% confidence intervals. (n=727 units from 9 mice).
(c) Decoding accuracy for sample goal upon arrival at the reward port (location d in (a)) in the presence (closed bars) and absence (open bars) of illumination of vHPC-mPFC terminals (269 units from 4 Arch+ mice, 285 units from 5 Arch− mice; n=100 permutations; ANOVA F=1978, p=5×10-105 for virus-by-light interaction; t=0.48, p=0.64 for Arch−; *t =161.2, p=1.2 × 10−121 for Arch+). Error bars represent 95% confidence intervals; blue lines represent upper bounds of 95% confidence intervals for shuffled data.
(d) Decoding of task phase (sample vs. choice) as a function of time relative to departure from the start box. Conventions as in (b) (792 units from 9 mice).
(e) Decoding of task phase at door opening (location a in (a)) as a function of trial type (ANOVA, F=1.94, p=0.17 for virus-by-light interaction.
The sample goal was decoded from spike histograms aligned to multiple trial events (Fig. 3a). Sample goal identity was decoded from the mPFC population at accuracies well above chance from the time the animals entered the T-intersection, and peaked at 96% upon arrival at the reward port in the sample goal (Fig. 3b).
Sample goal representation at goal arrival time was then assessed during inhibition of vHPC input by training the model on firing rates from non-Sample Light trials (No Light, Delay Light, and Choice Light trials combined) and testing on rates from Sample Light trials. For Arch− animals, sample goal was decoded equally well with or without mPFC illumination, while in Arch+ animals accuracy was reduced to chance by mPFC illumination (Fig. 3c). This result demonstrates that vHPC input is critical for the representation of sample goal among mPFC units during encoding.
To assess the impact of terminal inhibition on encoding of non-spatial, task-relevant cues, the same classifier was trained to decode task phase (sample vs. choice) at the time the start-box doors opened immediately prior to running down the center arm. Because this epoch was behaviorally equivalent in sample and choice runs, an accurate representation of task phase at this time point must rely upon a memory of the preceding task phase. Task phase was decoded with near perfect accuracy (0.98) at the time bin corresponding with the opening of the doors, revealing a memory trace for the preceding task phase (Fig. 3d). When the decoder was trained on firing rates from this epoch in No Light trials and tested on choice runs from Sample Light trials, model accuracy was not affected (Fig. 3e), suggesting that vHPC-mPFC terminal inhibition does not generally interfere with the encoding of task-relevant information.
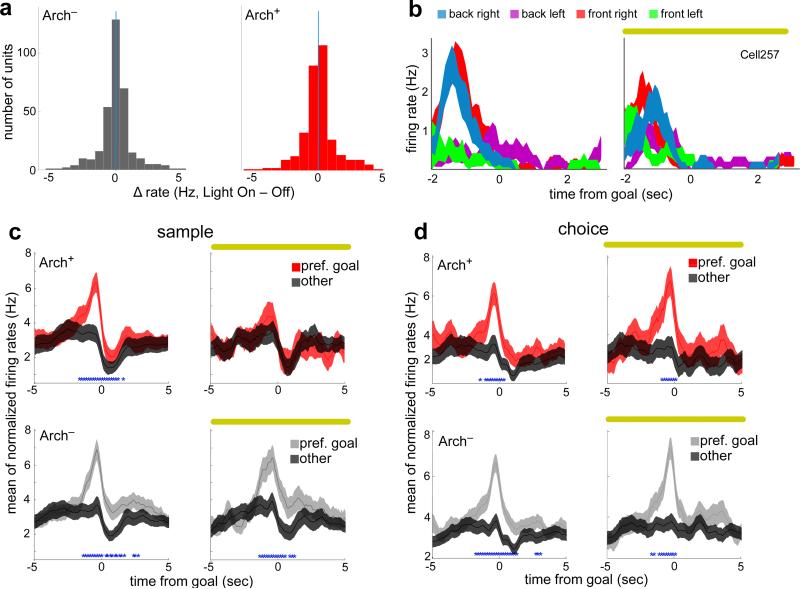
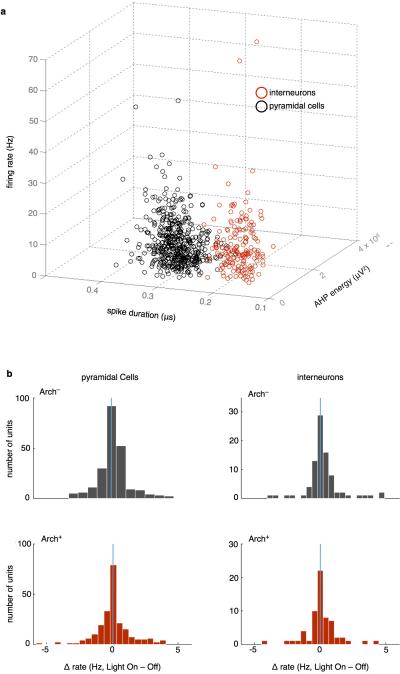
The finding of vHPC input-dependent location coding in mPFC leaves open the question of how vHPC input influences mPFC neurons. Overall firing rates of mPFC units were unaffected by terminal illumination in both Arch− and Arch+ animals, whether all were considered together (Fig. 4a), or if putative pyramidal cells and interneurons were separated based on waveform features (Extended Data Fig. 4). Nonetheless, consistent effects of vHPC inputs might be revealed by a finer-grained analysis.
Fig. 4. Location selectivity requires vHPC input during encoding but not retrieval.
(a) Differences in firing rate with terminal illumination (n=433 units, sign rank z=−0.23, p=0.82; n=359, z=−0.97, p=0.33, for Arch+ and Arch− animals, respectively).
(b) Mean binned spike rates for an example mPFC unit from an Arch+ animal, aligned to arrival at each of the 4 sample goals (color coded) without (left) or with (right) terminal illumination.
(c) Peri-event firing rates during the sample phase for all location-selective units as they approach the preferred (red/grey) and non-preferred (black) goals (blue asterisks, time points with Bonferroni-corrected significance) during light on (right) and light off (left) trials. n=67 units from 7 Arch+ mice, and 78 units from 6 Arch− mice.
(d) Same as (c), but during the choice phase. n=145 units from 7 Arch− mice, and 77 units from 6 Arch+ mice.
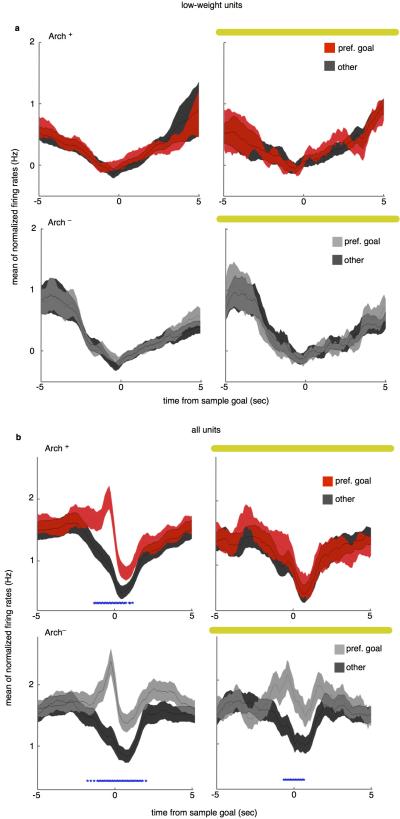
Each unit's preferred goal (that in which firing rate was most different from the mean rate across the other three goals) was identified using weights generated by the classifier (Methods). Although this separation criterion allowed for the possibility that any given unit might represent location by an increase or decrease in rate, the difference was observed as an elevation in mean firing rate relative to other goals, when averaged across all units (Extended Data Fig. 5), and especially those units with high goal selectivity (Fig. 4b-d). The effect of Sample Light was striking. Inhibition of terminals during the sample phase prevented the increase in firing rate that occurred in units’ preferred goals, without affecting baseline rates (Fig. 4c, top). The same results were obtained when including all units in the analysis (Extended Data Fig. 5). These results reveal an excitatory role for vHPC input in the location-selective firing rate enhancement seen in mPFC units.
To address, whether direct vHPC input is necessary for all mPFC spatial representation, firing rate in preferred and non-preferred goals was examined during choice runs. As in sample runs, firing rate for high goal selective units during choice runs was also higher in the preferred goal than in non-preferred goals. However, unlike in sample runs, this elevation was unaffected by vHPC-mPFC terminal inhibition (Fig. 4d). In this finding, physiology mirrored the behavioral result, indicating that goal selectivity following encoding is no longer dependent on vHPC input.
vHPC gamma organizes mPFC spike timing
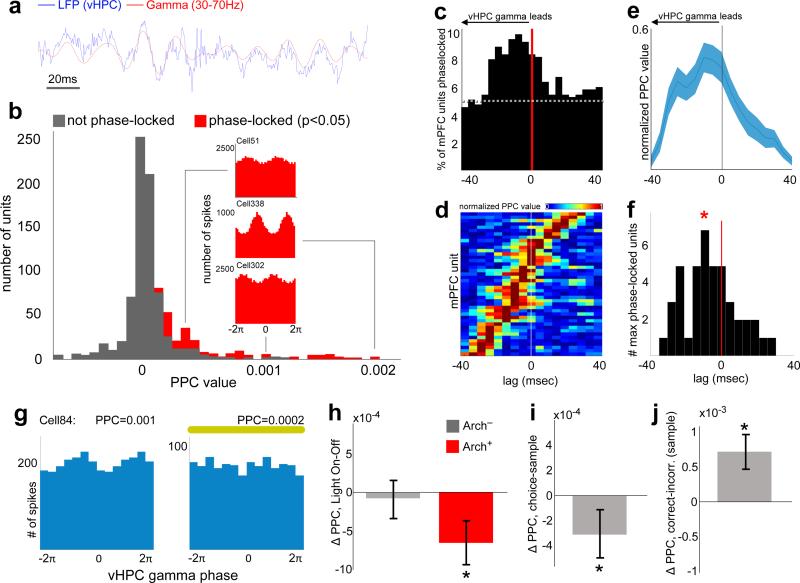
Activity in distant brain regions can be coordinated by gamma oscillations 23, and long-range gamma synchrony in both cortex and hippocampus has been linked to spatial learning and memory 24,25. Therefore, long-range synchrony was quantified using the magnitude (pairwise phase consistency, PPC 26) and significance (Rayleigh's test 9) of phase non-uniformity of spike times in one brain region relative to LFP oscillations in another. To determine the temporal directionality of synchronous activity, lag analysis was performed, in which phase-locking was calculated at various temporal shifts; preferential phase-locking at a nonzero lag indicates a predictive relationship between oscillatory phase and spike timing.
A subset of mPFC units were significantly phase-locked to vHPC gamma (Fig. 5b-c), and the percentage of significantly phase-locked units was greatest at lags in which vHPC gamma preceded mPFC spiking (Fig. 5c). Moreover, the mean strength of mPFC unit phase-locking to vHPC gamma was maximal at lags in which vHPC led (Fig. 5d-f). These findings suggest the possibility that gamma-frequency inputs from the vHPC influence mPFC spike timing. Consistent with this suggestion, inhibition of vHPC-mPFC terminals reduced the overall strength of gamma phase-locking (Fig. 5g-h), indicating that the observed synchrony is mediated by direct vHPC-mPFC input. Importantly, this directionality was specific to gamma oscillations, as lag analysis of phase-locking in the theta range revealed an opposite directionality; mPFC led vHPC (but not dHPC) activity in the theta range, and theta synchrony was unaffected by terminal inhibition (Extended Data Fig. 7).
Fig. 5. Task-dependent modulation of mPFC Spiking by vHPC gamma.
(a) Example raw and gamma-filtered vHPC LFP.
(b) Distribution of phase-locking values for all units from spikes recorded at all times, colored by significance (Rayleigh's test, p<0.05). Insets, vHPC gamma phase histograms from example mPFC units (Cell51: z=−3.24, p<0.001, PPC=0.0003; Cell338: z<−6, p<0.0001, PPC=0.002; Cell324: z=−2.8, p=0.002, PPC=0.001).
(c) Percentage of mPFC units significantly phase-locked to vHPC gamma across a range of lags. Dashed line, chance.
(d) Pseudocolor plot of normalized PPC values, sorted by lag of maximal phase-locking, for mPFC units with Bonferroni-corrected significance (p<0.0029).
(e) Mean normalized PPC value by lag.
(f) Distribution of lags at peak phase-locking strength; shifted towards a vHPC lead (n=43 units, Sign rank, z=−2.2, p=0.014). *, mean lag.
(g) Distribution of gamma phases for spikes from an example mPFC unit from an Arch+ animal during all Light Off runs (Rayleigh's p=0.03) and Light On runs (Rayleigh's p=0.3).
(h-j) Change in phase locking comparing (h) light on vs off (n=140 units from 7 Arch+ mice, z=−3.9, p=8.7×10⁻⁵; and n=222 units from 6 Arch− mice, z=−1.83, p=0.07); (i) choice vs sample phases (n=458 units z=−3.2, p=0.0016); and (j) correct vs incorrect trials (n=270 units, z=−4.2, p=3.5×10⁻⁵). Significance by sign rank.
vHPC-mPFC gamma synchrony correlated with behavior in two key ways. PPC values were higher during sample than choice runs, demonstrating that stronger gamma phase-locking is associated with the encoding phase of the trial (Fig. 5i). Additionally, phase-locking was stronger during sample runs of correct trials than of incorrect trials (Fig. 5j), suggesting that it may support effective encoding of location cues.
Discussion
Here we have leveraged a temporally precise, projection-specific manipulation to test the role of the vHPC-mPFC afferent pathway in spatial working memory. We found that direct vHPC-mPFC input is essential for successful encoding of task-related cues, both behaviorally, and at the level of neural representation within the mPFC. vHPC-mPFC gamma synchrony correlated with successful cue encoding and was also disrupted by vHPC terminal inhibition. These findings point to a role for the vHPC-mPFC afferent pathway as a conduit for the updating of task-critical location cues.
The finding of a dependence of task performance on vHPC input only during sample runs, replicated across both behavioral paradigms used in this study, provides a strong argument for the importance of vHPC-mPFC afferent input during the trial phase in which relevant spatial cues are encoded. The role of vHPC-mPFC input in encoding of goal location is further supported by the effect of terminal inhibition on the neural representation of goal location in the mPFC. Moreover, while contemporaneous location was robustly represented as a goal-selective enhancement of firing in preferred goals during both sample and choice runs, this representation depended on vHPC input only during the sample run. Here the physiology agrees with the behavioral observation that vHPC-mPFC input is critical for encoding, not retrieval, of task-relevant location cues.
Interestingly, we find no evidence of retrospective location coding in mPFC activity (Fig. 3 and Extended Data Fig. 3). Within the parameters of this study, this argues against persistent firing within mPFC neurons as a means of maintaining the stimulus representation between encoding and retrieval. Previously, retrospective and prospective location representation have been seen in mPFC cells of rodents during delays in spatial alternation tasks in which past and future location are intertwined 27,28, while in primates there is ample evidence for stimulus-specific delay-period firing in dorsolateral prefrontal cortex 29,30. The primate dorsolateral prefrontal cortex is functionally analogous to, but anatomically distinct from, the rodent prelimbic region of the mPFC 30,31. But retrospective place firing has been shown to be absent in rodent mPFC when past and future location are independent 17. While the delays used here were relatively brief (10-20s), multiple prior studies have demonstrated a requirement for the mPFC at similar delays 11,32-35.
The combined results that vHPC-mPFC input is necessary only during cue encoding, that mPFC lacks retrospective location representation during maintenance and retrieval, and that mPFC representation of contemporaneous location during retrieval is not dependent on direct vHPC input, suggest that the mPFC processes sample goal location transiently and that some downstream structure(s) may maintain the information thereafter. Likely candidate structures would include dHPC and the thalamic nucleus reuniens. We cannot, however, rule out the possibility that retrospective location is persistently represented in the mPFC in a form not detectable using the analytic techniques presented here, such as in temporary changes in synaptic weights, or transient reactivation that is too brief to be reliably decoded from binned spike histograms.
We find that vHPC-mPFC gamma synchrony is correlated with successful location encoding and that inhibition of this input disrupts long-range gamma-frequency but not theta-frequency synchrony. vHPC gamma oscillations entrain local output in a phase-coherent manner (Extended Data Fig. 6), which influences mPFC spiking at putatively monosynaptic delays. These findings demonstrate that entrainment of mPFC spikes to vHPC gamma oscillations is a physiological signature of task-critical long-range signal propagation. This phenomenon is subtle – at the lag with the greatest phase-locking, fewer than 10% of mPFC units were significantly phase-locked to vHPC gamma. Nevertheless, the observed correlation between vHPC-mPFC gamma synchrony and successful encoding suggests that gamma synchrony could be a behaviorally-relevant marker of effective long-range functional connectivity 25.
The finding that mPFC theta activity leads vHPC theta, and that theta synchrony between the two structures did not appear to depend upon vHPC-mPFC afferents, ran counter to our initial hypotheses. Prior work had shown that dHPC theta leads mPFC theta 36,37, that theta waves travel from dHPC to vHPC 38,39, and that silencing of vHPC activity affects dHPC-mPFC theta synchrony 40, supporting the idea that the vHPC theta-patterned activity might directly entrain mPFC theta. The current findings regarding theta synchrony suggest there may be an alternative explanation for the previous finding of reduced dHPC-mPFC synchrony with vHPC silencing. It is possible that pharmacological inactivation of vHPC affected downstream targets in the dHPC, disrupting dHPC theta activity and thus dHPC-mPFC theta synchrony. This possibility is supported by the finding that vHPC silencing with muscimol reduces dHPC theta power 40.
Our findings point to a role for the vHPC-mPFC afferent pathway as a conduit for the updating of task-critical location cues, extending previous work that implicates vHPC and mPFC in contextual learning to brief time-scales 41-43. Future work in this area should seek to implicate intermediary and/or upstream structures in the transmission of theta-patterned activity between HPC and mPFC, to determine what (if any) role mPFC has in maintenance and/or retrieval of task-related cues, and to identify which of the other major inputs to mPFC serve to mediate the performance of spatial working memory.
Methods
Subjects
Male C57BL/6 mice (Jackson Labs) were used for all experiments, aged 8-12 weeks at first use. Mice were housed in a New York State Psychiatric Institute satellite facility and were maintained on a 12-hour light-dark cycle. Except when food-restricted for the purpose of behavioral training and testing, all mice were given ad libitum access to food and water. Presurgical mice were group-housed with littermates, while mice with chronic recording implants were singly housed in divided cages with visual, auditory and olfactory contact with another implanted mouse. 6 mice were used in the acute anesthetized experiment (3 Arch+, 3 Arch−), 14 in the 2-goal T-maze experiment (8 Arch+, 6 Arch−), and 13 in the 4-goal T-maze experiment (7 Arch+, 6 Arch−). The effect size for behavioral impairment in the Arch+ group in the 4-goal experiment was 1.48, and the probability of observing a significant effect (statistical power) was 90% for an N of 7, 83% for an N of 6 (Arch+ and Arch− group sizes, respectively). Mice were randomized to a given viral type; All procedures were approved by Columbia University and the New York State Psychiatric Institute IACUCs.
Surgical Preparation
Animals were placed inside a flow box and anesthetized with isoflurane gas (2%) until sedated, at which point they were placed in a stereotax and maintained on 0.5% isoflurane for the duration of the surgery. Craniotomies were made bilaterally above mPFC, dHPC and vHPC (coordinates below), and skull screws placed over cerebellum and olfactory bulb served as ground and reference, respectively. In the acute anesthetized experiment, surgical depth was maintained with isoflurane for the duration of the experiment.
Viral Transduction
AAV2/5 of titer exceeding 1012vg/ml (Karl Deisseroth via UNC Vector Core and UPenn Vector Core) was used to package the virus. In the acute stimulation/silencing experiment and the 2-goal t-maze experiment, a CamKIIα-eArch3.0-eYFP sequence was used to express the opsin and CamKIIα-mCherry was used as an opsin-negative control. For the 4-goal experiment, hSyneArch-eYFP and hSyn-eYFP were used for opsin and control, respectively. The hSynapsin promoter was chosen for the 4-goal experiment to account for possible long-range GABAergic vHPC-mPFC projections and to avoid potential toxicity effects resulting from opsin expression under the stronger CamKIIα promoter. Virus was targeted to multiple targets within stratum pyramidal of ventral CA1 (2 mediolateral rows at AP 2.95 and 3.25, with sites at ML/DV: 2.65/4.5, 3.0/4.3, 3.35/3.9, 3.7/3.3-2.9. An additional row was made at AP 3.1, with ML/DV sites at 2.8/1.55 and 3.15/1.7. All coordinates reported in mm, all AP and ML w.r.t. bregma, DV w.r.t. brain surface. A 200nL bolus was delivered to each site via glass micropipette (20-40μM diameter) at a rate of 100nL/min continuous infusion, with a wait time of 5 minutes between infusion and retraction.
Electrode and Fiber Implantation
Local field potentials were recorded using 50μM-diameter tungsten wire, while spikes and LFPs were recorded using stereotrodes (mPFC) and tetrodes (vHPC) made from 13μM-diameter tungsten fine wire. For the 2-goal t-maze experiment, stereotrodes were coupled to ferrule-bound optical fibers (Thorlabs, 200μM-diameter core, 0.39NA) positioned 300-500μM dorsal to the stereotrode tips, which were arrayed semicircularly around the lateral edge of the fiber. Fiber-coupled stereotrode bundles were then implanted bilaterally in mPFC (1.8mm anterior, 0.4mm lateral, 1.4mm ventral), while LFP wires were implanted bilaterally in dHPC (1.85mm posterior, 1.25mm lateral, 1.45mm ventral) and vHPC (3.1mm posterior, 3.0mm lateral, 3.9mm ventral). For the 4-goal experiment, 9 of the 13 animals were implanted as described above, while 4 animals (2 Arch+ and 2 Arch−) were instead implanted with tetrodes over the vHPC (3.7mm ventral), which were advanced until spikes with putative pyramidal-cell waveforms were detected (Extended Data Fig. 4). mPFC optical fibers in these 4 animals were coupled to stationary bilateral LFP wires. All movable microdrives were advanced at a rate of 40μM per day across all recording days. Recording sites were histologically confirmed by visual examination of electrothermolytic lesions made prior to sacrificing and perfusing implanted animals. Lesions were induced by passing current through an electrode at each implanted site (50μA, 20sec). Perfused and fixed tissue was then sectioned, and DNA was stained using DAPI Fluoromount-G mounting medium (Southern Biotech). vHPC LFP wires used for phase-locking analysis were located either in stratum pyramidale, stratum radiatum, and stratum lacunosum-moleculare of ventral Ca1; no differences in gamma power, peak frequency, or synchrony with mPFC units were seen for the different laminar locations.
Recording and Spike Sorting
Recordings were amplified, band-pass filtered (1-1000Hz LFPs, 600-6000Hz spikes), and digitized using the Neuralynx Digital Lynx system. LFPs were collected at a rate of 2kHz, while spikes were detected by online thresholding and collected at 32kHz. Units were initially clustered using Klustakwik (Ken Harris), sorted according to the first two principal components, voltage peak, and energy from each channel. Clusters were then accepted, merged, or eliminated based on visual inspection of feature segregation, waveform distinctiveness and uniformity, stability across recording session, and ISI distribution.
Behavioral Training
Mice undergoing behavioral testing were given 5 weeks to recover from surgery and allow for expression and transport of the opsins, at which time they were placed on a food-restricted diet consisting of 1.5-2.5 grams of food per day as needed to maintain 85% of their post-recovery bodyweight. The researcher responsible for training and running the mice was blinded as to viral group by another lab member, who randomly assigned opsin and control viruses. Mice were then given 2 days of habituation to the maze, which consisted of 10 minutes free exploration and foraging (plugged into optical fibers and recording tether) with all doors open, followed by 5 minutes of interleaved laser light pulses in the start box with doors closed (5-10sec on, 30sec off, 5 min). On the subsequent 2 days mice underwent behavioral shaping consisting of 10 minutes of running to baited goal arms in alternating directions. Mice then underwent training on the t-maze task until criterion performance, consisting of 70% correct trials on 2 out of 3 consecutive days) was achieved, in the absence of illumination. All animals that underwent successful surgeries met criterion. Inter-trial delay was 20 seconds. On the 2-goal experiment, reward consisted of dustless pellets (Bio-Serv). Also in the 2-goal experiment only, to minimize across-session performance drift, and ceiling effects, intra-trial delay was adjusted according to the preceding day's performance, beginning at 10sec and progressively increasing delay by an additional 5 seconds following days on which performance was above 80% (as in Wang et al., 2006). For the 4-goal experiment, reward consisted of sweetened condensed milk (~50μL, 3:1 dilution). To allow for direct comparison of delay within animals in this task, intra-trial delay was fixed at 10sec, with the addition of a single session of 20sec delays as the final session for each animal. Light stimulation was 532nm, 10mW in all cases. Task performance was lower when sample and choice goals matched in the left/right dimension than when they differed (n=13 mice; mean=0.65 +/− 0.01 and 0.71 +/− 0.02, respectively; t=−3.91, p=0.001), but performance on these trials remained above chance (t=4.0 × 10³, p=3.1 × 10−38).
Statistics
All effects presented as statistically significant exceeded an α-threshold of 0.05. All independence tests were two-tailed. All independence testing of paired values (i.e. changes across conditions) utilized paired t-tests or (where stated) signed rank tests. All ANOVA tests involving multiple observations per subject/unit (every figure except Extended Fig. 2D) were done as repeated measures group-by-condition tests. All t-tests and rank tests performed with more than 2 groups were done post-hoc to ANOVA tests except where Bonferroni correction for multiple comparisons is specifically cited.
Spike Analysis Using a Linear Classifier
A maximum margin linear classifier was used to decode sample goal location from binned population firing rate vectors and to quantify the strength and reliability of the neural representation. This type of classifier had the advantage of integrating comparisons between each pair of goal locations into a single inference, thus capturing all possible schemes of location discrimination in a way that can be applied across a diverse neural population. Matlab scripts available for sharing upon request.
Analyses were performed on all units for which there was at least one training and one testing trial per condition.
Analysis using the population decoder was performed on binned spike vectors (500ms bins, 100ms increments) of all recorded units from sessions with at least 2 trials for each feature class under consideration. As in previous work with spike data from prefrontal cortex, we therefore took advantage of the accumulated data to decode task-relevant features by treating all units as a single, pseudosimultaneously recorded population 44. This approach assumes equivalent spike statistics across animals and recording sessions, and ignores potential contributions to population coding from correlated spike variability that would be observed if all units were indeed simultaneously recorded 45.
Model training was performed using constrained quadratic programming 46,47 that employed a maximal margin perceptron 47-49. The training samples to this algorithm are generated by averaging the recorded spike counts within the relevant conditions that need to be decoded, and across a specified training set of trials. This procedure gives a mean activity vector per condition, in which each component of the vector represents the trial-averaged activity of a given neuron at a given condition. The quadratic programing procedure then aims at finding a set of readout weights that maximally separate the mean activity vectors corresponding to the conditions that have to be discriminated. Multi-class discrimination problems are reduced to a set of binary discrimination problems involving all pairwise combinations of conditions 50.
The model was then tested by cross-validating its performance on a test set of recorded trials. Given a task condition, a test vector is generated by sampling its components from the distribution of spike counts recorded from the corresponding neuron during the test trials. At each test phase 100 test vectors per condition are randomly resampled with replacement, and the performance of the model is quantified as the average accuracy in classifying them. For each time bin, model training and testing was performed 100 times (at which point estimates of model accuracy approached asymptote) on non-overlapping subsets of trials (half of trials to train, half to test, random subsampling without replacement), with subsets constrained to include at least one trial corresponding with each feature class under consideration. For training and testing across separate trial conditions (Fig. 4), the same trial number requirement was applied across training and testing sets to ensure equal population sizes and equal representation of feature classes in the two trial sets.
For identification of each unit's preferred goal, absolute values of model weights for each goal's 3 binary classifications (comparison with each other goal) were summed, and the goal with the highest summed value was judged to be the preferred goal. To segregate units with high and low goal selectivity, the absolute model weights for all 6 binary classifications (each goal-goal comparison) were summed; units in the upper and lower quintiles were judged to have high and low goal selectivity, respectively.
Phase-locking Analysis
Phase-locking of spikes to the oscillatory phase of LFPs was performed using pairwise phase consistency, which, unlike other commonly used measures of phase-locking, is unbiased by spike number 26. Nevertheless, to ensure a representative estimate of spike phase, we set a threshold of 100 spikes for all analysis; in comparisons of phase-locking across conditions (Figs. 6G and 7F-H), only units which fired 100 spikes in each condition were included. LFP signal was digitally band-pass filtered (4-12Hz for theta, 30-70Hz for gamma) using a zero-phase-delay filter (filter- provided by K. Harris and G. Buzsaki, order = sample frequency). The phase component was calculated by a Hilbert transform, and a corresponding phase was assigned to each spike.
Extended Data
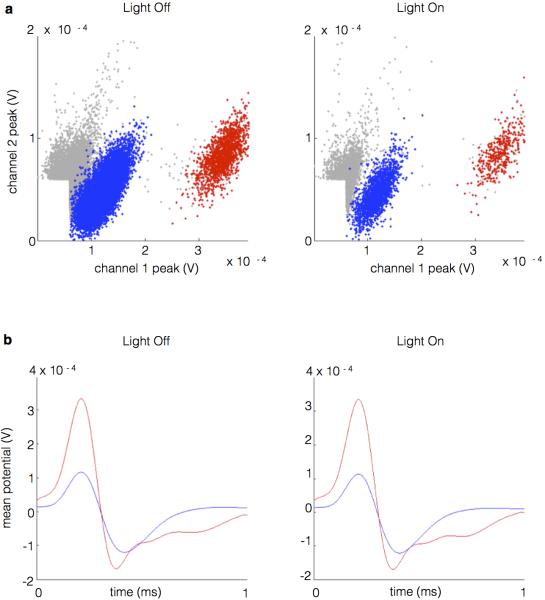
Extended Data Figure 1. Individual mPFC Units Clustered from Fiber-Coupled Stereotrodes.
(a) Multiple individual units clustered from stereotrode recordings in mPFC in the absence and presence of illumination.
(b) Mean waveforms of extracellular potentials from example units in (a).
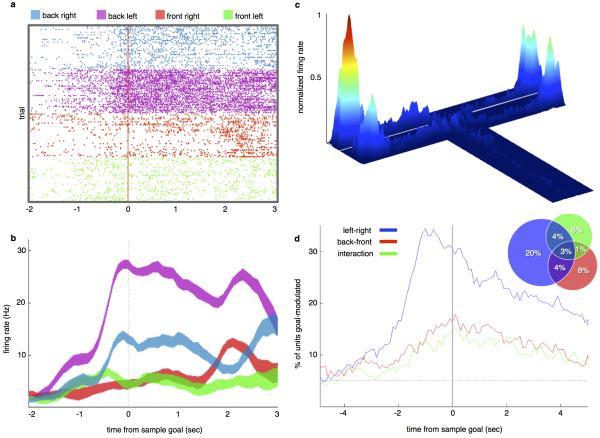
Extended Data Figure 2. mPFC Cells Encode Goal Location Both Categorically and Globally.
(a) A raster plot of spikes fired by an example single unit across trials, sorted by sample goal, temporally aligned to arrival at sample goal.
(b) Traces of firing rates averaged across trials by sample goal location, for the unit from (a). This unit shows location selectivity, firing preferentially in the back left goal. Traces are mean +/− s.e.m.
(c) Spatial map of firing rates for the same unit for the full recording session. Goal-selective units tended to fire more at the preferred goal than at the other goals, and more at all goals than in the rest of the environment.
(d) Percentage of units that were goal-selective as a function of time from sample goal, according to 2-way repeated measures ANOVAs performed on binned spike rates. Units were identified as having selectivity for left/right (blue), back/front (red), and/or combined spatial dimensions (green). Dashed line represents chance (p=0.05). Inset, % of units having each type and/or combination of selectivity at time zero (arrival at sample goal). Percentages are out of 792 recorded units.
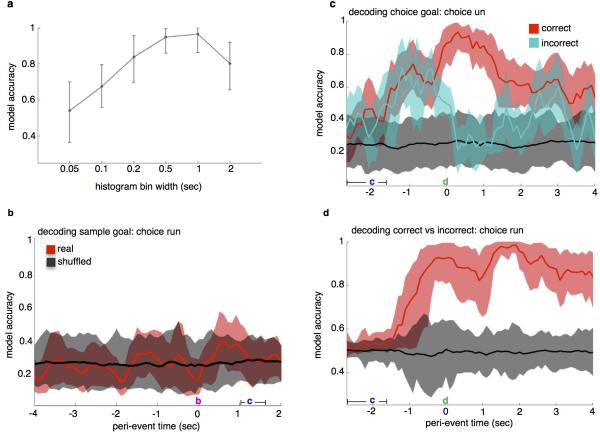
Extended Data Figure 3. mPFC Units Represent Choice Goal Location, Not Sample Goal Location, During Choice Runs.
(a) Model accuracy at the time bin corresponding with arrival at the sample goal port during the 4-goal task was highest for spike histograms with time bins of 500ms and 1000ms. 500ms time bins were used for spike analyses.
(b) Decoding sample goal location during subsequent choice run during the 4-goal task. Using the linear decoder, previously visited location was not detectable above chance accuracy. 10- and 20-second delay trials were combined.
(c) Decoding choice goal during choice run, correct vs. incorrect trials during the 4-goal task. Location decoded for this analysis was chosen goal, (i.e., the mouse's current location) rather than correct goal. Model accuracy reached 0.93 upon arrival at the goal on correct trials. On incorrect trials, model accuracy exceeded chance during goal approach but dropped to chance levels upon reaching the goal. 10- and 20-second delay trials were combined.
(d) Decoding choice accuracy (correct vs. incorrect) during choice trials. Model accuracy peaked at 0.99 at 1.9 seconds following arrival at the goal. Histograms aligned to departure from start box here in (b) through (d). 10- and 20-second delay trials were combined.
Extended Data Figure 4. vHPC-mPFC Terminal Inhibition Does Not Alter mPFC Spike Rate.
(a) Waveform features used to separate putative cell types. Spike duration was defined as the peak-to-trough time, while afterhyperpolarization (AHP) energy was taken as the area over the curve following the second zero-crossing. Spike duration yielded the clearest separation.
(b) Putative FS and non-FS cells, sorted by spike width, showed no effect of terminal illumination on spike rate (Arch− Non-FS: sign rank z=−1.7, p=0.095, Arch− FS: z=−1.6, p=0.11; Arch+ Non-FS: z=−2.7, p=0.79; Arch+ FS: z=−0.49, p=0.62).
Extended Data Figure 5. Effect of mPFC Illumination on Goal-Selective Firing in mPFC.
(a) Low-weighted units, as identified using the classifier, show no difference in firing between the goal with the highest weight relative to the other goals. In the sample goal these units fire at rates not different than their session mean rates. Traces indicate mean +/−s.e.m. of normalized firing rate (bin FR – session FR).
(b) Terminal inhibition eliminates firing rate differences in preferred VS non-preferred goal during encoding across all units. On sample runs with no light, units from both Arch− (Lower Left) and Arch+ animals (Upper Left) had elevated firing rates in preferred goal relative to non-preferred goal (red asterisks mark time points with Bonferroni-corrected significance). In Sample Light runs, units from Arch− animals maintain elevated firing in the preferred goal (Lower Right), while units from Arch+ animals show no significant firing rate difference (Upper Right; N=358 Arch− units, 325 Arch+ units, Sign rank p<0.0005).
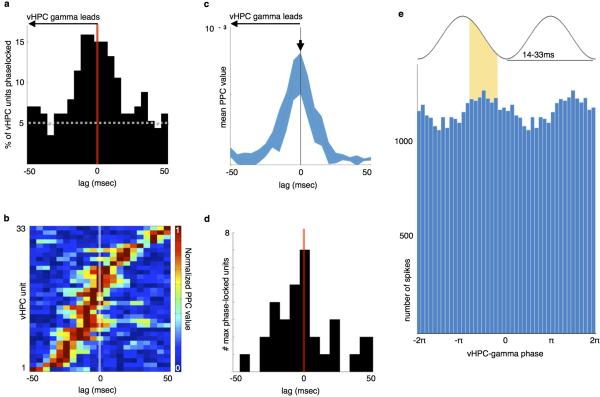
Extended Data Figure 6. vHPC Gamma Modulates vHPC Output.
(a) vHPC units phase-lock maximally to the vHPC-gamma rhythm at a lag of zero (p-value from Rayleigh's test<0.05, dashed line indicates chance rate).
(b) Normalized PPC values, sorted by lag of maximal phase-locking, for significantly phase-locked vHPC units. Units with Bonferroni-corrected significance within the −40 to 40ms lag window (Rayleigh test, p<0.0029) were included.
(c) Mean normalized PPC value for the population shown in (b).
(d) Histogram of units with maximum PPC value at each lag. Units maximally phase-locked at a lag of zero, with no net difference from zero across the population.
(e) vHPC units share a common preferred gamma phase. Pooled spikes from significantly phase-locked vHPC units were modulated by vHPC gamma phase at zero-lag (N=26303 spikes, Rayleigh's z=17.6, p=2.2 × 10⁻⁸, PPC value=0.002), with peak spiking in the descending phase of the gamma cycle. (**Note that spikes and LFPs were both recorded from stereotrodes in the stratum pyramidal and that this gamma phase would likely differ from that recorded in SLM, as in Figure 7).
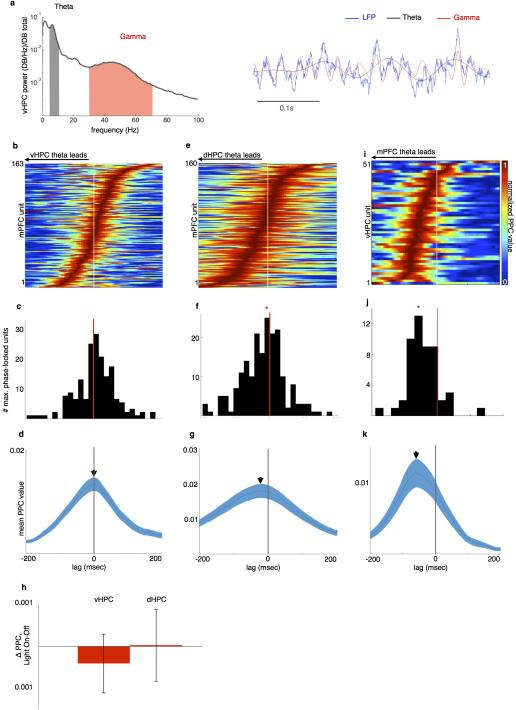
Extended Data Figure 7. mPFC Theta Activity Follows dHPC and Leads vHPC during the task.
(a) Example vHPC LFP (blue, right) and spectrogram (left) demonstrating robust theta (grey, 4-12Hz) and gamma (red, 30-70Hz) components during all runs toward goals.
(b) Pseudocolor plot of relative strength of mPFC unit phase-locking to vHPC theta at lags from −200ms to 200ms, for units with Bonferroni-corrected significance in at least one lag. Warmer colors indicate stronger phase-locking.
(c) Distribution of lags at peak phase-locking strength for significantly phase-locked mPFC units. Distribution centered at 0 (N=189 units, z=2.05, p=0.98).
(d) Mean +/− s.e.m. PPC value of mPFC units and vHPC theta, as a function of lag.
(e-g) Phase-locking of mPFC units to dHPC theta as a function of lag, as in (B-D). Distribution of lags at peak phase-locking is significantly shifted towards a dHPC lead (N=160 units, Sign rank z=−4.4, p=6×10⁻⁶).
(h) No difference in strength of phase-locking of mPFC units to vHPC (left) and dHPC (right) theta in light-on vs light-off trials. Mean and s.e.m. shown for each (N=140 units, Sign rank z=−1.3, p=0.2; z=−1.4, p=0.12).
(i-k) Phase-locking of vHPC units to mPFC theta as a function of lag, as in (B-D). Distribution of lags at peak phase-locking is significantly shifted towards an mPFC lead (N=51 units, z=−5.03, p=2.4×10⁻⁷).
Supplementary Material
Acknowledgements
The authors would like to thank M. Topiwala for technical assistance, M. Kheirbek for advice and assistance with the design of fiber optics, and M. Shapiro for advice with regards to designing the 4-arm T-maze. This work was supported by grants from the NIH (MH096274 and MH081968), the Hope for Depression Research Foundation, the International Mental Health Research Organization, the Gatsby Charitable Foundation and the Swartz Foundation.
Footnotes
Author Contributions
T.S., J.A. Gogos, and J.A. Gordon designed the experiments. T.S. performed the experiments and analyzed the data. M.R. and S.F. developed the linear classifier, adapted it for use with the T-maze dataset, and provided guidance on its implementation. S.E.A. participated in the design of optogenetic experiments. T.S., S.F., J.A. Gogos, and J.A. Gordon interpreted the results. T.S. and J.A. Gordon wrote the paper.
Author Declarations
The authors have no competing interests to declare.
References
- 1.Baddeley A, Hitch G. In: Recent advances in learning and motivation. Bower GA, editor. Vol. 8. Academic Press; 1974. pp. 47–90. [Google Scholar]
- 2.Klauer K, Zhao Z. Double dissociations in visual and spatial short-term memory. Journal of Experimental Psychology: General. 2004;133:355–381. doi: 10.1037/0096-3445.133.3.355. [DOI] [PubMed] [Google Scholar]
- 3.Andrade J. Working Memory in Context. Psychology; 2001. [Google Scholar]
- 4.Miyake A, Shah P. Models of Working Memory: Mechanisms of Active Maintenance and Executive Control. Cambridge University Press; 1999. [Google Scholar]
- 5.Baddeley A. Working memory: looking back and looking forward. Nature Reviews Neuroscience. 2003;4:829–839. doi: 10.1038/nrn1201. [DOI] [PubMed] [Google Scholar]
- 6.de Zubicaray G, McMahon K, Wilson S, Muthiah S. Brain Activity During the Encoding, Retention, and Retrieval of Stimulus Representations. Learn. Mem. 2001;8:243–251. doi: 10.1101/lm.40301. [DOI] [PMC free article] [PubMed] [Google Scholar]
- 7.Curtis C, D'Esposito M. The effects of prefrontal lesions on working memory performance and theory. Cogn Affect Behav Neurosci. 2004;4:528–539. doi: 10.3758/cabn.4.4.528. [DOI] [PubMed] [Google Scholar]
- 8.Hyman J, Zilli E, Paley A, Hasselmo M. Working Memory Performance Correlates with Prefrontal-Hippocampal Theta Interactions but not with Prefrontal Neuron Firing Rates. Front Integr Neurosci. 2010;4 doi: 10.3389/neuro.07.002.2010. [DOI] [PMC free article] [PubMed] [Google Scholar]
- 9.Jones M, Wilson M. Theta rhythms coordinate hippocampal-prefrontal interactions in a spatial working memory task. PLoS Biol. 2005;2:e402. doi: 10.1371/journal.pbio.0030402. [DOI] [PMC free article] [PubMed] [Google Scholar]
- 10.Sigurdsson T, Stark K, Karayiorgou M, Gogos J. Impaired hippocampal-prefrontal synchrony in a genetic mouse model of schizophrenia. Nature. 2010;464(7289):763–767. doi: 10.1038/nature08855. [DOI] [PMC free article] [PubMed] [Google Scholar]
- 11.Lee I, Kesner R. Time-Dependent Relationship between the Dorsal Hippocampus and the Prefrontal Cortex in Spatial Memory. The Journal of Neuroscience. 2003;23:1517. doi: 10.1523/JNEUROSCI.23-04-01517.2003. [DOI] [PMC free article] [PubMed] [Google Scholar]
- 12.Wang G, Cai J. Disconnection of the hippocampal–prefrontal cortical circuits impairs spatial working memory performance in rats. Behavioural Brain Research. 2006;175:329–336. doi: 10.1016/j.bbr.2006.09.002. [DOI] [PubMed] [Google Scholar]
- 13.Hoover W, Vertes R. Anatomical analysis of afferent projections to the medial prefrontal cortex in the rat. Brain Struct Funct. 2007;212:149–179. doi: 10.1007/s00429-007-0150-4. [DOI] [PubMed] [Google Scholar]
- 14.Jay T, Witter M. Distribution of hippocampal CA1 and subicular afferents in the prefrontal cortex of the rat studied by means of anterograde transport of Phaseolus vulgaris leucoagglutinine. J. Comp. Neurol. 1991;313:574–586. doi: 10.1002/cne.903130404. [DOI] [PubMed] [Google Scholar]
- 15.Oh S. A mesoscale connectome of the mouse brain. Nature. 2014;508:207–214. doi: 10.1038/nature13186. [DOI] [PMC free article] [PubMed] [Google Scholar]
- 16.Burton B, Hok V, Save E, Poucet B. Lesion of the ventral and intermediate hippocampus abolishes anticipatory activity in the medial prefrontal cortex of the rat. Behav Brain Res. 2009;199:222–234. doi: 10.1016/j.bbr.2008.11.045. [DOI] [PubMed] [Google Scholar]
- 17.Jung M, Qin Y, McNaughton B, Barnes C. Firing characteristics of deep layer neurons in prefrontal cortex in rats performing spatial working memory tasks. Cereb Cortex. 1998;8:437–450. doi: 10.1093/cercor/8.5.437. [DOI] [PubMed] [Google Scholar]
- 18.Kjelstrup K, et al. Finite scale of spatial representation in the hippocampus. Science. 2008;321:140–143. doi: 10.1126/science.1157086. [DOI] [PubMed] [Google Scholar]
- 19.Royer S, Sirota A, Patel J, Buzsaki G. Distinct Representations and Theta Dynamics in Dorsal and Ventral Hippocampus. The Journal of Neuroscience. 2010;30:1777–1787. doi: 10.1523/JNEUROSCI.4681-09.2010. [DOI] [PMC free article] [PubMed] [Google Scholar]
- 20.Belfort G, Lin Y, Monahan P, Boyden E. High-performance genetically targetable optical neural silencing by lightdriven proton pumps. Nature. 2010;463:98–102. doi: 10.1038/nature08652. [DOI] [PMC free article] [PubMed] [Google Scholar]
- 21.Gradinaru V, et al. Molecular and Cellular Approaches for Diversifying and Extending Optogenetics. Cell. 2010;141:154–165. doi: 10.1016/j.cell.2010.02.037. [DOI] [PMC free article] [PubMed] [Google Scholar]
- 22.Rigotti M, et al. The importance of mixed selectivity in complex cognitive tasks. Nature. 2013;497:585–590. doi: 10.1038/nature12160. [DOI] [PMC free article] [PubMed] [Google Scholar]
- 23.Engel A, Konig P, Kreiter A, Singer W. Interhemispheric synchronization of oscillatory neuronal responses in cat visual cortex. Science. 1991;252:1177–1179. doi: 10.1126/science.252.5009.1177. [DOI] [PubMed] [Google Scholar]
- 24.Carr M, Karlsson M, Frank L. Transient slow gamma synchrony underlies hippocampal memory replay. Neuron. 2012;75:700–713. doi: 10.1016/j.neuron.2012.06.014. [DOI] [PMC free article] [PubMed] [Google Scholar]
- 25.Yamamoto J, Suh J, Takeuchi D, Tonegawa S. Successful execution of working memory linked to synchronized high-frequency gamma oscillations. Cell. 2014;157:845–857. doi: 10.1016/j.cell.2014.04.009. [DOI] [PubMed] [Google Scholar]
- 26.Vinck M, van Wingerden M, Womelsdorf T, Fries P, Pennartz C. The pairwise phase consistency: a bias-free measure of rhythmic neuronal synchronization. Neuroimage. 2010;55:112–122. doi: 10.1016/j.neuroimage.2010.01.073. [DOI] [PubMed] [Google Scholar]
- 27.Baeg E, et al. Dynamics of Population Code for Working Memory in the Prefrontal Cortex. Neuron. 2003;40:177–188. doi: 10.1016/s0896-6273(03)00597-x. [DOI] [PubMed] [Google Scholar]
- 28.Horst NK. L. M. Working with memory: evidence for a role for the medial prefrontal cortex in performance monitoring during spatial delayed alternation. J Neurophysiol. 2012;108(12):3276–3288. doi: 10.1152/jn.01192.2011. [DOI] [PMC free article] [PubMed] [Google Scholar]
- 29.Funahashi S, Bruce C, Goldman-Rakic P. Mnemonic coding of visual space in the monkey's dorsolateral prefrontal cortex. J. Neurophysiol. 1989;61:331–349. doi: 10.1152/jn.1989.61.2.331. [DOI] [PubMed] [Google Scholar]
- 30.Goldman-Rakic P. Cellular basis of working memory. Neuron. 1995;14:477–485. doi: 10.1016/0896-6273(95)90304-6. [DOI] [PubMed] [Google Scholar]
- 31.Seamans J, Lapish C, Durstewitz D. Comparing the prefrontal cortex of rats and primates: insights from electrophysiology. Neurotox Res. 2008;14:249–262. doi: 10.1007/BF03033814. [DOI] [PubMed] [Google Scholar]
- 32.Rogers D, et al. Photothrombic lesions of the frontal cortex impair the performance of the delayed non-matching to position task by rats. Behavioural Brain Research. 1992;49:231–235. doi: 10.1016/s0166-4328(05)80169-x. [DOI] [PubMed] [Google Scholar]
- 33.Shaw C, Aggleton J. The effects of fornix and medial prefrontal lesions on delayed non-matching-to-sample by rats. Behavioural Brain Research. 1993;54:91–102. doi: 10.1016/0166-4328(93)90051-q. [DOI] [PubMed] [Google Scholar]
- 34.Sloan H, Good M, Dunnett S. Double dissociation between hippocampal and prefrontal lesions on an operant delayed matching task and a water maze reference memory task. Behavioural Brain Research. 2006;171:116–126. doi: 10.1016/j.bbr.2006.03.030. [DOI] [PubMed] [Google Scholar]
- 35.Izaki Y, Takita M, Akema T. Specific role of the posterior dorsal hippocampus prefrontal cortex in short-term working memory. Eur J Neurosci. 2008;27:3029–3034. doi: 10.1111/j.1460-9568.2008.06284.x. [DOI] [PubMed] [Google Scholar]
- 36.Sigurdsson T, Stark K, Karayiorgou M, Gogos J, Gordon J. Impaired hippocampal-prefrontal synchrony in a genetic mouse model of schizophrenia. Nature. 2010;464:763–767. doi: 10.1038/nature08855. [DOI] [PMC free article] [PubMed] [Google Scholar]
- 37.Siapas A, Lubenov E, Wilson M. Prefrontal phase locking to hippocampal theta oscillations. Neuron. 2005;46:141–151. doi: 10.1016/j.neuron.2005.02.028. [DOI] [PubMed] [Google Scholar]
- 38.Lubenov E, Siapas A. Hippocampal theta oscillations are travelling waves. Nature. 2009;459:534–539. doi: 10.1038/nature08010. [DOI] [PubMed] [Google Scholar]
- 39.Patel J, Fujisawa S, Berényi A, Royer S, Buzsáki G. Traveling theta waves along the entire septotemporal axis of the hippocampus. Neuron. 2012;75:410–417. doi: 10.1016/j.neuron.2012.07.015. [DOI] [PMC free article] [PubMed] [Google Scholar]
- 40.O'Neill P, Gordon J, Sigurdsson T. Theta oscillations in the medial prefrontal cortex are modulated by spatial working memory and synchronize with the hippocampus through its ventral subregion. J Neurosci. 2013;33:14211–14224. doi: 10.1523/JNEUROSCI.2378-13.2013. [DOI] [PMC free article] [PubMed] [Google Scholar]
- 41.Ruediger S, Spirig D, Donato F, Caroni P. Goal-oriented searching mediated by ventral hippocampus early in trial-and-error learning. Nat Neurosci. 2012;15:1563–1571. doi: 10.1038/nn.3224. [DOI] [PubMed] [Google Scholar]
- 42.Fanselow M, Dong H. Are the dorsal and ventral hippocampus functionally distinct structures? Neuron. 2010;65:7–19. doi: 10.1016/j.neuron.2009.11.031. [DOI] [PMC free article] [PubMed] [Google Scholar]
- 43.Komorowski R, et al. Ventral hippocampal neurons are shaped by experience to represent behaviorally relevant contexts. J Neurosci. 2013;26:4852–4859. doi: 10.1523/JNEUROSCI.5458-12.2013. [DOI] [PMC free article] [PubMed] [Google Scholar]
- 44.Meyers E, Freedman D, Kreiman G, Miller E, Poggio T. Dynamic population coding of category information in inferior temporal and prefrontal cortex. J. Neurophysiol. 2008;100:1407–1419. doi: 10.1152/jn.90248.2008. [DOI] [PMC free article] [PubMed] [Google Scholar]
- 45.Abbott L, Dayan P. The effect of correlated variability on the accuracy of a population code. Neural Comput. 1999;11:91–101. doi: 10.1162/089976699300016827. [DOI] [PubMed] [Google Scholar]
- 46.Barak O, Rigotti M. A Simple Derivation of a Bound on the Perceptron Margin Using Singular Value Decomposition. Neural Comput. 2011. 2011 [Google Scholar]
- 47.Anlauf J, Biehl M. The AdaTron: An Adaptive Perceptron Algorithm. Europhys. Lett. EPL. 1989;10:687–692. [Google Scholar]
- 48.Rosenblatt F. Principles of neurodynamics: perceptrons and the theory of brain mechanisms. Spartan; 1962. [Google Scholar]
- 49.Krauth W, Mezard M. Learning algorithms with optimal stability in neural networks. J. Phys. Math. Gen. 1987;20:L745–L752. [Google Scholar]
- 50.Dietterich T, Ghulum B. Error-correcting output codes: A general method for improving multiclass inductive learning programs. AAAI. 1991:572–577. [Google Scholar]
Associated Data
This section collects any data citations, data availability statements, or supplementary materials included in this article.


