

Abstract
His349 in human transferrin (hTF) is a residue critical to transferrin receptor (TFR)-stimulated iron release from the C-lobe. To evaluate the importance of His349 on the TFR interaction, it was replaced by alanine, aspartate, lysine, leucine, tryptophan, and tyrosine in a monoferric C-lobe hTF construct (FeChTF). Using a stop-ped-flow spectrofluorimeter, we determined rate processes assigned to iron release and conformational events (in the presence and in the absence of the TFR). Significantly, all mutant/TFR complexes feature dampened iron release rates. The critical contribution of His349 is most convincingly revealed by analysis of the kinetics as a function of pH (5.6–6.2). The FeChTF/TFR complex titrates with a pKa of approximately 5.9. By contrast, the H349A mutant/TFR complex releases iron at higher pH with a profile that is almost the inverse of that of the control complex. At the putative endosomal pH of 5.6 (in the presence of salt and chelator), iron is released from the H349W mutant/TFR and H349Y mutant/TFR complexes with a single rate constant similar to the iron release rate constant for the control; this suggests that these substitutions bypass the required pH-induced conformational change allowing the C-lobe to directly interact with the TFR to release iron. The H349K mutant proves that although the positive charge is crucial to complete iron release, the geometry at this position is also critical. The H349D mutant shows that a negative charge precludes complete iron release at pH 5.6 both in the presence and in the absence of the TFR. Thus, histidine uniquely drives the pH-induced conformational change in the C-lobe required for TFR interaction, which in turn promotes iron release.
Keywords: Protein–protein interactions, Human serum transferrin, Strategic mutagenesis, Stopped-flow fluorescence, Kinetics
Introduction
The primary pathway for the sequestration and delivery of iron from the diet to mammalian cells involves serum transferrin (TF). Human TF (hTF), an 80-kDa bilobal glycoprotein, binds one ferric iron (Fe3+) in each of two homologous lobes (referred to as N- and C-lobes with approximately 40% sequence identity) deep within a cleft formed by two subdomains (NI/NII and CI/CII). One molecule of diferric hTF (Fe2hTF) binds to each monomer of the homodimeric transferrin receptor (TFR), a trans-membrane glycoprotein residing at the cell surface of all iron-requiring cells. The hTF/TFR complex is endocytosed in a clathrin-dependent manner. Upon acidification within an endosome (pH of approximately 5.6) through the action of proton pumps, iron is released from Fe2hTF in a TFR-mediated process [1]. Following the release of iron, apo hTF remains tightly bound to the TFR within the endosome. The apo hTF/TFR complex is exocytosed; the vesicle fuses with the plasma membrane, and apo hTF is released to the extracellular milieu (pH of approximately 7.4) to sequester more iron and continue the cycle [1–3].
As convincingly demonstrated, the TFR plays a crucial role in balancing iron release from the two lobes of Fe2hTF [4–6]. At pH 7.4 in the absence of a chelator, iron dissociates very slowly from hTF [7]. Although iron release is accelerated in vitro at pH 5.6 (half-life of approximately 3 h), the rate is still extremely slow in comparison with the 2–5-min time frame for iron release from hTF/TFR complexes during one cycle through the cell [1, 2]. We have recently reported that, when bound to the TFR, under our “standard” conditions [100 mM 2-morpholinoethane-sulfonic acid (MES), pH 5.6, 300 mM KCl and 4 mM EDTA], iron release from the N-lobe of Fe2hTF is decreased 6–15-fold, whereas iron release from the C-lobe is increased 7–11-fold (in comparison with the rate constants for iron release from each lobe in the absence of the TFR), allowing iron release on a physiologically relevant time scale [6]. Given the significant influence of the TFR on iron release, it is important to identify the specific amino acids that allow hTF to bind to the TFR at both acidic and neutral pH, accommodating the large conformational changes that take place during iron release.
Each monomer of the extracellular ectodomain of the TFR is composed of three subdomains: an apical domain, a protease-like domain, and a helical domain (responsible for dimerization) [8]. Mutagenesis of amino acids in the glycosylated, N-terminal hexa-His-tagged soluble recombinant TFR (residues 121–760) (sTFR) which binds to hTF allowed identification of two residues in the helical domain (Trp641 and Phe760), which are important to binding of apo hTF to the sTFR at pH 6.3. Significantly, neither mutant, W641A or F760A, interfered with binding of Fe2hTF to the sTFR at pH 7.4 [9]. Analysis by electron paramagnetic resonance of the environment of the iron within the cleft of the C-lobe of recombinant N-terminal hexa-His-tagged nonglycosylated monoferric hTF that binds iron only in the C-lobe (FeChTF; Y95F/Y188F mutations prevent iron binding in the N-lobe) bound to the sTFR clearly showed pH induced changes in the iron binding site [5]. Since these pH-induced changes were not observed when FeChTF was bound to the W641A/F760A double mutant of the sTFR, it was suggested that Trp641 and Phe760 form a hydrophobic patch that makes specific contacts with the C-lobe stabilizing the open, apo conformation at low pH [5].
A 7.5-Å resolution cryo-electron microscopy model of the TF/sTFR complex indicated that the N-lobe resides between the plasma membrane and the TFR, near residues in the protease-like domain of the TFR. In the model, the C-lobe is more exposed, and makes multiple contacts with the helical domain of the TFR (Protein Data Bank 1SUV) [10]. In the case of hTF, two histidine residues (His349 and His350) that lie at the beginning of an α-helix in the CI subdomain are close to the Trp641/Phe760 region of the sTFR [10]. Owing to the physiologically relevant pKa of the histidine side chain (approximately 6.0), it is likely that the protonation state of one or both of these histidine residues would change during a cycle of endocytosis and exocytosis. Given that the decrease in endosomal pH is a key step in TFR-mediated iron release from hTF, it was hypothesized that His349 and His350 in the C-lobe of hTF could act as a pH sensor participating in the mechanism of iron release within the acidic environment of the endosome [5]. This suggestion was confirmed by surface plasmon resonance measurements which established that mutation of His349 to alanine reduced the binding affinity of apo hTF for the sTFR at pH 5.6, without affecting the binding affinity of FeChTF at pH 7.4 [5]. In support of the critical role of His349 in iron release, mutation of His349 to alanine also eliminated the ability of the TFR to facilitate iron release from the C-lobe of hTF at pH 5.6 [5]. In contrast, the H350A mutant had a much smaller effect on TFR-stimulated iron release [5]. These experiments provided strong evidence that His349 is critical to the interaction with the TFR, stimulation of iron release from hTF, and stabilization of the apo hTF conformation. Significantly, His349 is conserved among all mammalian TFs for which the sequence has been determined.
The work described above measured the increase in the fluorescent signal resulting from iron release using a time-based steady-state spectrofluorimeter [5]. Although steady-state experiments have been used by us and others, many limitations exist. Use of a stopped-flow spectrofluorimeter to measure iron release kinetics provides a number of advantages, including sensitivity (requiring less sample), an excellent signal-to-noise ratio, and most crucially, rapid mixing, allowing the capture of all kinetic events [6]. In the current work, six single-point mutations of His349 were made to more thoroughly explore the role of this particular residue in TFR-stimulated iron release from the C-lobe. His349 was replaced by alanine, aspartic acid, lysine, leucine, tryptophan, and tyrosine to specifically evaluate the effects on the TFR interaction. Each mutant was placed into a nonglycosylated full-length His-tagged monoferric C-lobe (FeChTF) construct (in which two iron liganding residues, Tyr95 and Tyr188, are mutated to phenylalanine to eliminate iron binding in the N-lobe). A combination of stopped-flow fluorescence, urea gel analysis, and steady-state tryptophan fluorescence reveals important differences in the effect of substituting these residues at position 349.
Materials and methods
Materials
Dulbecco’s modified Eagle’s medium–Ham F-12 nutrient mixture, antibiotic–antimycotic solution (100×), and trypsin were from the Gibco-BRL Life Technologies Division of Invitrogen. Fetal bovine serum was obtained from Atlanta Biologicals. Ultroser G, a serum replacement, was from Pall BioSepra (Cergy, France). Methotrexate from Bedford Laboratories was purchased at a local hospital pharmacy. The QuikChange mutagenesis kit was from Stratagene. All tissue culture dishes, flasks, and Corning expanded surface roller bottles were from local distributors. Ultracel 30 kDa molecular mass cutoff membrane microconcentrator devices were made by Amicon. Nickel nitrilotriacetic acid (NTA) resin came from Qiagen. Hi-prep 26/60 Sephacryl S-200HR and S-300HR columns were acquired from Amersham Pharmacia. EDTA was from Mann Research Laboratories. NTA and ferrous ammonium sulfate were from Sigma. Novex 6% tris(hydroxymethyl)amino-methane (Tris)–borate–EDTA (TBE) urea minigels, TBE running buffer (5×), and TBE–urea sample buffer (2×) were from Invitrogen.
Expression and purification of FeChTF and His349 FeChTF mutants
All mutations were introduced into the pNUT vector containing the complementary DNA coding for FeChTF using the QuikChange site-directed mutagenesis kit as previously described [11]. Forward mutagenic primers used to introduce the six His349 mutant hTFs are shown below. The substitutions resulting in the mutations are underlined and in bold:
| H349A | 5′ TGG TGT GCG CTG AGT GCT CAC GAG AGG CTC AAG TGT GAT GAG TGG 3′ |
| H349D | 5′ G TGT GCG CTG AGC GAC CAC GAG AGG CTC AAG 3′ |
| H349K | 5′ TGG TGT GCG CTG AGT AAA CAC GAG AGG CTC AAG TGT GAT GAG TGG 3′ |
| H349L | 5′ AG TGG TGT GCG CTG AGC TTA CAC GAG AGG CTC AAG TG 3′ |
| H349W | 5′ G TGT GCG CTG AGC TGG CAC GAG AGG CTC AAG TGT GAT GAG 3′ |
| H349Y | 5′ TGT GCG CTG AGC TAC CAC GAG AGG CTC 3′ |
Baby hamster kidney (BHK) cells were transfected with the pNUT plasmid encoding each of the His349 mutants. Recombinant proteins were secreted into the tissue culture medium by adherent BHK cells in expanded surface roller bottles. Immediately following collection, Fe3+(NTA)2 was added to the tissue culture medium to iron-saturate and stabilize the recombinant hTF. The volume of the collected medium was reduced using a tangential flow device with a 30-kDa molecular mass cutoff and exchanged into 5 mM Tris buffer, pH 8.0, containing 0.02% sodium azide. The concentrated medium was then centrifuged (6,000g) to remove particulates and the supernatant was diluted with 5× start buffer, resulting in a 1× final concentration with respect to the start buffer (50 mM Tris, pH 7.5, 300 mM NaCl, 20 mM imidazole, 10% glycerol, and 0.05% sodium azide). Each FeChTF and mutant construct was then captured by passage over a Qiagen Ni-NTA column (approximately 8 mL of resin) and displaced by the addition of 250 mM imidazole to the start buffer. The samples were concentrated and exchanged into 100 mM NH4HCO3. Final purification involved passage over a Sephacryl S-200HR gel filtration column in 100 mM NH4HCO3. Each FeChTF sample was concentrated to 15 mg/mL using a 30 kDa molecular mass cutoff Ultracel microconcentrator. The production and purification of the His-tagged soluble portion of the TFR (sTFR) consisting of residues 121–760 was as previously described [12].
FeChTF/sTFR complexes were generated using our standard protocol [12]. Briefly, a small molar excess (approximately 20%) of hTF (FeChTF or His349 FeChTF mutant) was added to 1.25 mg of sTFR and allowed to equilibrate at room temperature for approximately 5 min. Complexes were then purified by passage over a Sephacryl S-300HR gel filtration column in 100 mM NH4HCO3 to remove excess FeChTF. Fractions with the complex were concentrated to 15 mg/mL with respect to FeChTF.
Determination of molar absorption coefficients
Determination of millimolar absorption coefficients (ε280) for both the apo and the iron-containing H349W and H349Y FeChTF mutants followed our recently described protocol [13, 14]. The absorbance of a protein at 280 nm is comprised of contributions from tryptophan and tyrosine residues, as well as disulfide bonds [14, 15]. The availability of the amino acid composition provides the precise number of each of these residues, allowing a remarkably accurate estimate of ε280 [14]. However, this calculation does not provide an accurate estimate of ε280 for iron-containing hTF because the interaction of iron with the two liganding tyrosine residues produces a ligand-to-metal charge transfer band centered at approximately 470 nm. This ligand-to-metal charge transfer causes disruption of the π to π* transition energy of the two tyrosine residues, and results in a nonlinear increase in A280 [16, 17].
Steady-state tryptophan fluorescence
Steady-state tryptophan fluorescence emission spectra were obtained as previously described [17], using a Quanta-master-6 spectrofluorimeter (Photon Technology International, South Brunswick, NJ, USA) equipped with a 75-W xenon arc lamp excitation source, an excitation/emission monochromator, and a 320-nm cut-on emission filter. Samples were excited at 280 nm and emission scans were collected from 305 to 400 nm using slit widths set at 1 nm (excitation) and 6 nm (emission). The background of the buffer was subtracted from each spectrum. Samples, either the FeChTF control or the His349 mutants (500 nM), were added to a cuvette (1.8 mL final volume) containing 100 mM N-(2-hydroxyethyl)piperazine-N′-ethanesulfonic acid buffer, pH 7.4, at 25 °C. Apo-protein was obtained by adding the same amount of protein to 100 mM MES buffer, pH 5.6, containing 300 mM KCl and 4 mM EDTA and allowing the mixture to equilibrate for 10–15 min. Three steady-state emission scans were collected and averaged. Unfortunately, it is not technically possible to evaluate the hTF/sTFR complexes using the steady-state format because the change being measured as a result of iron removal is overwhelmed by the contribution of the sTFR to the fluorescent signal [19].
Urea gel analysis of His349 FeChTF mutants
The iron status of His349 FeChTF mutants was examined by urea gel electrophoresis using Novex 6% TBE–urea minigels in 90 mM Tris–borate, pH 8.4, containing 16 mM EDTA as previously described [6]. Iron-containing samples were mixed 1:1 with 2× TBE–urea gel sample buffer (final concentration of 0.5 μg/μL). To evaluate whether iron removal from the various His349 FeChTF mutants was complete, an aliquot of each was added to the iron-removal buffer (100 mM MES buffer, pH 5.6, containing 300 mM KCl and 4 mM EDTA) and the mixture was incubated for 15 min at room temperature. The process was halted by addition of 2× TBE–urea gel sample buffer. Samples (2.5 μg) were loaded and the gel was electrophoresed for 2.25 h at 125 V. Protein bands were visualized by Coomassie blue staining.
Kinetic analysis of FeChTF and the His349 FeChTF mutants at pH 5.6
Iron release from FeChTF and the His349 FeChTF mutants was monitored at 25 °C as previously described using an Applied Photophysics SX.18MV stopped-flow spectrofluorimeter [12, 17]. One syringe contained the hTF sample or hTF/sTFR complex (375 nM) in 300 mM KCl and the other syringe contained MES buffer (200 mM, pH 5.6), KCl (300 mM), and EDTA (8 mM). Rate constants were determined by fitting the change in fluorescence intensity versus time using Origin (version 7.5) to standard models as described in detail previously [6]. All data were corrected to zero fluorescence intensity at time zero before fitting. Analysis of the H349K FeChTF mutant bound to the sTFR required the derivation of a new model that is similar to the previously described A → B → C model but in which k1 = k2. The equation used to fit the H349K FeChTF/sTFR data as well as the complete derivation and program code for Origin are provided in the electronic supplementary material.
Analysis of kinetics as a function of pH
To determine the effect of pH on the observed rates, FeChTF or the H349A FeChTF mutant (in the presence and in the absence of the sTFR) in 300 mM KCl (375 nM) was rapidly mixed with 200 mM MES buffer at different pH values ranging from 5.6 to 6.2, containing 300 mM KCl and 8 mM EDTA. All fluorescence data were collected and analyzed as described earlier.
Results
Molar absorption coefficients
For a valid comparison of the His349 mutants, it is essential to obtain an accurate concentration of each. Because alanine, aspartic acid, lysine, and leucine do not contribute to the absorbance at 280 nm, ε280 for the iron form of these four mutants (H349A, H349D, H349K, and H349L) would be predicted to be identical to that for the FeChTF control. Owing to the surface location of His349, the contribution of iron to the total A280 of iron-bound hTF and the introduction of an additional tryptophan (H349W) or tyrosine (H349Y) residue into hTF in two of the mutations tested, ε280 for these two mutants was determined. The experimentally derived ε280 values for the control, FeChTF, and ε280 for the H349W FeChTF and H349Y FeChTF mutants are reported in Table 1. To be certain that iron removal was complete (see later), the H349W FeChTF and H349Y FeChTF mutants were exposed to more stringent conditions than used in the original protocol, namely, 100 mM acetate buffer, pH 4.0, containing 300 mM KCl and 4 mM EDTA. The experimentally determined values for the apoproteins are all within the standard error of the calculated values. Additionally, the increase of 12–13% in the absorbance at 280 nm due to the presence of iron is very similar in the two mutants and the control.
Table 1.
Millimolar absorption coefficients (ε) at 280 nm for recombinant N-terminal hexa-His-tagged nonglycosylated monoferric human serum transferrin that binds iron only in the C-lobe (FeChTF) and His349 FeChTF mutants
| Construct | Calculated ε280 apo (mM−1 cm−1)a | Experimental ε280 apo (mM−1 cm−1)b | Experimental ε280 iron (mM−1 cm−1)c | Increase due to iron (%) | Difference calculated/experimental apo (%) |
|---|---|---|---|---|---|
| FeChTF | 82.1 | 81.5 ± 0.2 | 92.5 ± 0.3 | 13.5 | −0.7 |
| H349W FeChTF | 87.6 | 88.4 ± 0.7 | 98.6 ± 0.8 | 11.5 | 0.9 |
| H349Y FeChTF | 83.6 | 83.5 ± 0.7 | 93.3 ± 0.9 | 11.7 | −0.1 |
Calculated from ε280(M−1 cm−1) = (number of Trp)(5,500) + (number of Tyr)(1,490) + (number of Cys)(125) [14]
Apo samples were assayed in 100 mM acetate buffer, pH 4.0, containing 300 mM KCl and 4 mM EDTA to ensure complete iron removal
Iron-containing samples were assayed in 100 mM N-(2-hydroxyethyl)piperazine-N′-ethanesulfonic acid (HEPES), pH 7.4
Steady-state emission spectra
The fluorescence spectra of FeChTF and the various His349 FeChTF mutants were obtained in the presence or absence of iron (Table 2). We note that there are no significant shifts in λmax in the iron-bound versus apo conformations. Upon transitioning from the iron-bound to the low pH form, the control FeChTF displayed a 69 ± 5% increase in the fluorescence intensity. Likewise, the H349A, H349K, and H349L FeChTF mutants all featured similar increases in the fluorescence intensity of 70, 69, and 66%, respectively. In contrast, the change in fluorescence attributed to iron removal was considerably less for the H349D, H349W, and H349Y FeChTF mutants, resulting in 31, 30, and 51% increases, respectively (Table 2). In the case of H349W and H349Y, a slightly higher starting fluorescence intensity relative to the control was observed, as expected from the presence of an additional intrinsically fluorescent residue (tryptophan or tyrosine) in these mutants. However, because residue 349 resides on the surface, the fluorescent properties of the H349W and H349Y mutants are unlikely to be affected by their iron status and the lower percentage change observed for these mutants as well as for H349D is most likely due to incomplete iron removal, as supported by analysis on urea gels (see later).
Table 2.
Steady-state tryptophan fluorescence of FeChTF and His349 FeChTF mutants
| Constructa | λmax (nm) (Fe3+)b | λmax (nm) (apo)c | Fluorescence intensity (counts/s) (Fe3+) | Fluorescence intensity (counts/s) (apo) | Increase Fe3+ → apo pH 5.6 (%)d |
|---|---|---|---|---|---|
| FeChTF | 336 | 336 | 80,000 | 136,000 | 69 ± 5 |
| H349A FeChTF | 335 | 335 | 80,000 | 137,000 | 70 ± 1 |
| H349D FeChTF | 336 | 336 | 81,000 | 103,000 | 31 ± 6 |
| H349K FeChTF | 335 | 334 | 79,000 | 134,000 | 69 ± 0.4 |
| H349L FeChTF | 335 | 336 | 87,000 | 144,000 | 66 ± 0.3 |
| H349W FeChTF | 338 | 337 | 91,000 | 119,000 | 30 ± 2 |
| H349Y FeChTF | 334 | 335 | 85,000 | 130,000 | 51 ± 4 |
Spectra were all collected on the same day, allowing direct comparisons of the fluorescence intensities
Iron-containing samples were in 100 mM HEPES buffer, pH 7.4
Putative apo samples were incubated in 100 mM 2-morpholinoethanesulfonic acid (MES) buffer, pH 5.6, containing 300 mM KCl and 4 mM EDTA for 10–15 min
Percent increase is calculated as (100 × [fluorescence intensity(apo) − fluorescence intensity(iron)]/fluorescence intensity(iron)), where fluorescence intensity is measured in counts per second and is an average of data from at least two different experiments
Urea gel analysis of FeChTF and His349 FeChTF mutants
As described in detail [18], electrophoresis of hTF on 6% urea gels has long been used to qualitatively evaluate iron release. As reported, treatment of the FeChTF control with our standard iron-removal buffer (100 mM MES, pH 5.6, containing 300 mM KCl and 4 mM EDTA) results in complete removal of iron (Fig. 1a). The H349D, H349W, and H349Y mutants (Fig. 1a) retain more than 50% of their iron; the H349A and H349L mutants release approximately 70–80% of their iron and, like the control, iron removal from the H349K mutant is complete. These findings are consistent with the changes seen in the steady-state fluorescence (Table 2).
Fig. 1.
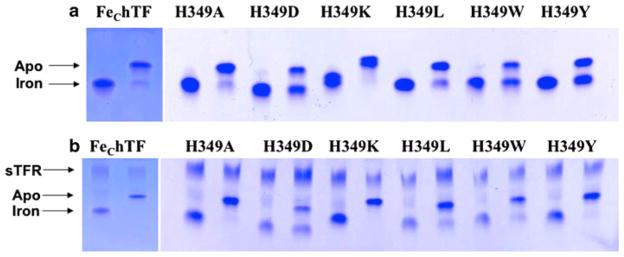
Urea gel analysis of recombinant N-terminal hexa-His-tagged nonglycosylated monoferric human serum transferrin that binds iron only in the C-lobe (FeChTF) and His349 FeChTF mutants. Control and mutant samples were electrophoresed before (iron-containing on the left) and after incubation (on the right) in 100 mM 2-morpholinoethanesulfonic acid (MES) buffer, pH 5.6, containing 300 mM KCl and 4 mM EDTA (apo) for 15 min. a In the absence of the glycosylated, N-terminal hexa-His-tagged soluble recombinant transferrin receptor (residues 121–760) (sTFR) and b in complex with the sTFR. Note that the top band in each lane in b is the sTFR. Because the separation is based on both conformation and charge, the migration patterns of the various mutants differ slightly
To determine whether iron was removed from the C-lobe of the His349 mutants in complex with the sTFR, we electrophoresed these samples on a urea gel following a 15-min incubation under our standard conditions. As shown in Fig. 1b, approximately 50% of iron is retained in the H349D mutant; the presence of the sTFR elicits complete removal of iron from the C-lobe of the H349W and H349Y mutants.
Iron release from FeChTF and His349 FeChTF mutants in the absence of the sTFR
Iron release from FeChTF and the His349 mutants in the FeChTF background at the physiologically relevant pH of 5.6 results in kinetic curves (Fig. 2a) that fit best to an A → B → C model yielding two rate constants. As previously described [6], there are two mathematically equivalent fits to this model. Because exchanging the numerical values of k1 and k2 yields a physically unreasonable fluorescence intensity constant for species B (FB) the relative order of k1 and k2 can be assigned with confidence. Rate constants for the FeChTF control and the His349 mutants under our standard conditions are presented in Table 3. It is immediately obvious that the rate constants for the various mutants are not drastically different from those of the control, with a maximum twofold difference in the rate constant (k1) assigned to iron release and in the rate constant (k2) for the conformational event [6].
Fig. 2.

Iron release curves for FeChTF and His349 FeChTF mutants at pH 5.6. Each curve represents an average of three to six experiments. Iron-bound samples (375 nM) in 300 mM KCl were rapidly mixed with 200 mM MES buffer, pH 5.6, containing 300 mM KCl and 8 mM EDTA and excited at 280 nm. The fluorescence emission was monitored by use of a 320-nm cut-on filter. a Black line FeChTF, red line H349A FeChTF, green line H349D FeChTF, pink line H349K FeChTF, blue line H349LFeChTF, violet line H349W FeChTF, yellow line H349Y FeChTF. b Black line FeChTF/sTFR, orange line H349A FeChTF/sTFR, green line H349D FeChTF/sTFR, blue line H349L FeChTF/sTFR, violet line H349W FeChTF/sTFR, yellow line H349Y FeChTF/sTFR. Note the difference in x-axis scale
Table 3.
Rate constants for iron release from FeChTF and His349 FeChTF mutants in 100 mM MES, pH 5.6, containing 300 mM KCl and 4 mM EDTA
| Construct | Iron release k1 (min−1)a | Fold difference control | Conformational event k2 (min−1) | Fold difference control |
|---|---|---|---|---|
| FeChTF controlb (N = 6) | 0.79 ± 0.11 | – | 1.9 ± 0.50 | – |
| H349A FeChTF (N = 4) | 0.87 ± 0.10 | 1.1 × faster | 1.4 ± 0.14 | 0.8 × slower |
| H349D FeChTFc (N = 3) | 0.60 ± 0.15 | 1.3 × slower | 0.95 ± 0.31 | 2 × slower |
| H349K FeChTF (N = 7) | 1.04 ± 0.29 | 1.3 × faster | 1.8 ± 0.67 | 1.1 × slower |
| H349L FeChTF (N = 3) | 0.73 ± 0.11 | 0.9 × slower | 2.1 ± 0.66 | 1.1 × faster |
| H349W FeChTFc (N = 3) | 0.38 ± 0.01 | 2.1 × slower | 1.8 ± 0.48 | 0.9 × slower |
| H349Y FeChTFc (N = 3) | 0.54 ± 0.07 | 1.5 × slower | 2.6 ± 1.2 | 1.4 × faster |
Averages and 95% confidence intervals for kinetic runs performed on N = 3–7 different days. Each day three kinetic traces were averaged before fitting
From [6]
Note that under the stated conditions, we estimate that only approximately 50% of the iron is removed from the H349D and H349W mutants and that approximately 70% of the iron is removed from the H349Y mutant. These estimates are based on the steady-state data in Table 2
Iron release from FeChTF and His349 FeChTF mutants bound to the sTFR
It is well established that iron release from the C-lobe of hTF is significantly accelerated in the presence of the TFR [4–6]. Therefore, iron release from FeChTF and the His349 FeChTF mutants in complex with the sTFR was measured (Fig. 2b). We note that the change in the fluorescent signal from the FeChTF/sTFR complex is significantly dampened owing to the presence of the sTFR, precluding analysis of the complexes in the steady-state format. However, as discussed previously, the sTFR makes no contribution to the change in fluorescence during pH- and chelator-induced iron removal [19]. Also as previously described [6], the kinetic curve for the control, FeChTF bound to the sTFR, fits best to an A → B → C model (as shown by the fit in Fig. 3a), in which the first rate constant (k1) has been assigned to a pH- and salt-induced conformational change, and the second rate constant (k2) to the actual release of iron (Table 4) [6, 19]. By measuring the rate constants for each monoferric species and diferric constructs with iron locked in one lobe, we were able to confidently assign this switch in the order of the rate constants (k1 and k2) in the presence of the receptor [6]. Also as previously observed, all of the hTF/sTFR complexes display an initial quench of the fluorescence (during the first 0.192 s) that is detectable only in the presence of the sTFR and is not included in the fit [19]. Although kinetic traces for the H349A and H349L FeChTF mutants in complex with the sTFR also fit very well to the same A → B → C model (the fit for the H349L/sTFR complex is shown in Fig. 3b and the rate constants are given in Table 4), k1 and k2 in each of these mutants are decreased. Thus, the H349A FeChTF mutant bound to the sTFR exhibits a twofold decrease in k1 and a fivefold decrease in k2 for iron release (Table 4). The H349L FeChTF/sTFR complex has rate constants most similar to the control, with k1 decreased only slightly (1.4-fold) and k2 decreased fourfold (Table 4). Interestingly, the data for the H349K FeChTF/sTFR complex gave a relatively poor fit (note the residuals in Fig. 3c) and yielded two rate constants which are identical within experimental error (see Fig. S1 and “Discussion”). Significantly, only a single rate constant (A → B model) came from fitting the kinetic curve for the H349D FeChTF mutant bound to the sTFR, although not all of the iron was removed (Fig. 2b; Table 4). It is noteworthy that in the absence of the sTFR, the H349W FeChTF and H349Y FeChTF mutants yielded two rate constants (Table 3), whereas when these mutants are bound to the sTFR, only a single rate constant is obtained (Table 4; Fig. 3d is provided as an example of the goodness of the fit).
Fig. 3.

Kinetic iron release curves and fits for FeChTF and various His349 FeChTF mutants in complex with the sTFR at pH 5.6. a Kinetic curve and fit (red line) of the FeChTF/sTFR complex. b Kinetic curve and fit (red line) of the H349L FeChTF/sTFR complex. c Kinetic curve and fit (red line) of the H349K FeChTF/sTFR complex. d Kinetic curve and fit (red line) of the H349W FeChTF/sTFR complex. Each curve represents an average of three to six runs. Iron-bound samples (375 nM) in 300 mM KCl were rapidly mixed with 200 mM MES buffer, pH 5.6, containing 300 mM KCl and 8 mM EDTA and excited at 280 nm. The fluorescence emission was monitored by use of a 320-nm cut-on filter. The residuals are indicated (green)
Table 4.
Rate constants for iron release from FeChTF and His349 FeChTF mutants bound to the glycosylated, N-terminal hexa-His-tagged soluble recombinant transferrin receptor (residues 121–760) (sTFR)
| Construct (FeChTF + sTFR) | Conformational event k1 (min−1)a | Fold difference control | Iron release k2 (min−1)a | Fold difference control |
|---|---|---|---|---|
| Controlb (N = 32) | 20.6 ± 1.2 | – | 7.2 ± 0.4 | – |
| H349A (N = 5) | 9.2 ± 0.8 | 2.2 × slower | 1.4 ± 0.5 | 5 × slower |
| H349Dc (N = 3) | 11.3 ± 1.6 | 1.8 × slower | – | – |
| H349K (N = 5) | 1.9 ± 0.2 | 10.8 × slower | 1.9 ± 0.2 | 4 × slower |
| H349L (N = 3) | 14.4 ± 0.8 | 1.4 × slower | 1.8 ± 0.8 | 4 × slower |
| H349W (N = 3) | – | – | 5.9 ± 1.6 | 1.2 × slower |
| H349Y (N = 3) | – | – | 5.6 ± 0.6 | 1.3 × slower |
Analysis of kinetics as a function of pH
The role of pH was investigated by measuring the iron release kinetics for the control FeChTF and the H349A mutant alone and bound to the sTFR at pH values ranging from 5.6 to 6.2. Significantly, iron removal from FeChTF decreases in a pH-dependent manner (from pH 5.6 to 6.4) [18]. As anticipated, in the absence of the sTFR, both k1 (iron release) and k2 (conformational change) decrease with increasing pH (from 5.6 to 6.2, Fig. S2a). Although both rates (k1 and k2) are slightly reduced compared with those for the FeChTF control, loss of the ionizable histidine residue in the H349A mutant has little effect on this trend in the absence of the sTFR (Fig. S2b). The iron release kinetics in the presence of the sTFR as a function of pH clearly show that both rate constants (k1 reporting a conformational change, k2 reporting iron release) for the FeChTF/sTFR complex are sensitive to pH, with an apparent pKa of approximately 5.8–5.9 (Fig. 4a). Significantly, at higher pH values (pH 6.0 and 6.2) a single rate constant is observed for the FeChTF/sTFR complex. In the H349A FeChTF/sTFR complex, the pH profile differs drastically in comparison with that for the control (Fig. 4b). Unlike the control, the rate constant for conformational change increases from pH 5.6 to 6.0, as does the rate of iron release. Thus, substitution of histidine by alanine (in the presence of the sTFR) inversely affects the rate constants. This finding is particularly striking in comparison with the lack of pH dependence of the H349K FeChTF/sTFR complex (Fig. S3b).
Fig. 4.

Effect of pH on rate constants from FeChTF/sTFR (a) and H349A FeChTF/sTFR (b) complexes. Rate constants [k1 for conformational change (black) and k2 for iron release (white)] as a function of pH are shown for the FeChTF control (a) and the H349A FeChTF mutant (b) in the presence of the sTFR. Except for the pH, the conditions are exactly as indicated in the legend to Fig. 3. Note that the rate constants are plotted on the same scale to provide a direct comparison between the H349A FeChTF/sTFR complex and the FeChTF/sTFR control
Discussion
Uniquely, the protonation state of the imidazole group of histidine can vary considerably in transitioning from the extracellular pH of 7.4 to the endosomal pH of approximately 5.6. At neutral pH, the imidazole group is uncharged, participating primarily in nonpolar, hydrophobic interactions. Below its putative pKa of approximately 6.0, the positively charged form of histidine (the imidazolium ion) can participate in more polar, hydrophilic interactions. We believe that protonation of the hTF His349 imidazole side chain allows it to interact with the aromatic portions of Trp641 and/or Phe760 on the TFR through cation–π interactions which are quite common in receptor/ligand interactions [20–22]. We suggest that His349 can be added to a growing number of examples in which specific histidine residues act as pH-sensitive molecular switches. Other receptor systems employing a similar type of histidine switch include the liver X receptor in which a specific histidine/tryptophan interaction holds the receptor in its active conformation [23]. Additionally, the LDL receptor features pH-induced ligand release dependent on two histidine residues that control the conformation of the receptor [24]. Histidine also clearly serves as a molecular switch in a number of other nonreceptor systems, including pH activation of the Na+/H+ antiporter [25], pH-sensitive binding and release of peptides from class II MHC molecules (His33) [26], and regulation of endoplasmic reticulum/Golgi network specific cleavages of the furin propeptide (His69) [27]. In all of these examples, specific histidine residues control conformation through their pH-sensitive bonding properties.
To validate the suggestion that His349 is acting as a molecular switch, we investigated its role in iron release from the C-lobe of hTF in the presence and in the absence of the sTFR. The specific behavior of six single-point His349 mutants was examined in detail to elucidate the roles of charge, size, shape, and hydrophobicity. In the current work, use of the stopped-flow instrument allowed a precise and comprehensive investigation of the effect of the substitutions at the 349 position. As detailed below, many subtler and more revealing aspects of the interaction were missed using the previous steady-state format [5]. The large size of the hTF/sTFR complex (approximately 340 kDa) and the paramagnetic nature of iron preclude use of some commonly used techniques to specifically determine the pKa of this important histidine residue (NMR, deuterium exchange, etc.). Nevertheless the apparent pKa of approximately 5.8–5.9 observed in the kinetics of iron removal in the FeChTF/TFR complex (Fig. 4a) correlates well with the theoretical titration of a histidine residue, providing strong evidence for the involvement of His349. As mentioned in the “Introduction”, interpretation of the results is aided by the availability of the 7.5-Å cryo-electron microscopy model of the TF/TFR complex, in which His349 putatively lies approximately 6–8.5 Å from the TFR residue Phe760 and approximately 10 Å from Trp641 (Fig. S4). Because Phe760 is the terminal residue of the TFR residing at the end of a loop (residues 750–760), it is relatively mobile. In contrast, both His349 in hTF and Trp641 in the sTFR reside in α-helices requiring larger, more global conformational movements in hTF and/or the TFR to come together and release iron. Additionally, the iron-free hTF must remain bound to the TFR to allow migration back to the plasma membrane and release of the apo hTF to complete the cycle of iron delivery.
Mutation of His349 to alanine attenuates pH-induced interactions with the sTFR at this position. As with the control, FeChTF, two rate constants for the H349A FeChTF mutant are found both in the absence (Table 3) and in the presence (at pH 5.6, Table 4) of the sTFR. In comparison with the FeChTF control, the H349A mutant bound to the sTFR features a twofold reduction in the rate constant (k1), assigned to the conformational change, and a fivefold decrease in the rate constant (k2), attributed to iron release. Importantly, however, there is only a small increase in the rate constant for iron release from the C-lobe of the H349A mutant bound to the sTFR in comparison with the rate constant for iron release from the mutant alone (1.4 vs. 0.87 min−1) (Tables 3, 4). This change is clearly considerably smaller than the ninefold increase in the rate constant for iron release from the C-lobe of FeChTF bound to the sTFR in comparison with when it is alone (7.2 vs. 0.79 min−1) (Tables 3, 4). The pH profile (Fig. 4) highlights the profound effect of the alanine substitution. A recent in silico model [28] of the complex suggests that at neutral pH, Lys511 in hTF interacts with Glu759 in the TFR and with His349 in a lone pair–cation interaction which becomes destabilized at acidic pH. The predicted repulsion at pH 5.6 between Lys511 and His349 might help to drive the conformational changes leading to iron release. This model would appear to explain our results; because alanine cannot form this lone pair–cation interaction, the H349A mutant in the presence of the sTFR is destabilized at higher pH values (above pH 6.0). Furthermore, the results are consistent with the concept that His349 serves as a pH-sensitive switch below the putative pKa of histidine (approximately 6.0) in the TFR complex.
Because both leucine and histidine branch at the γ-carbon and are somewhat hydrophobic, the side chain of leucine is similar to the unprotonated histidine residue. In the absence of the sTFR, the H349L mutant closely resembles the FeChTF control in both its fluorescent (Table 2) and its kinetic (Fig. 3b, Table 3) properties. Leucine at position 349 would be predicted to interact with the patch on the TFR (Trp641/Phe760) through relatively weak hydrophobic interactions, considerably less strong than the cation–π interactions suggested for protonated His349 interacting with the patch. The lower apparent stability of the apo conformation is reflected by the slightly smaller rate constant for the conformational event and the fourfold decrease in the rate constant for iron release (Table 4).
Substitution of His349 with a lysine is particularly interesting because (1) it allows assessment of the effect of a positive charge at position 349 at all pH values tested and (2) lysine is found in the homologous position in ovo-transferrin (oTF), a TF family member that does not bind to the human TFR [29]. We note that since a tryptophan residue equivalent to Trp641 in the human TFR and a phenylalanine residue equivalent to Phe760 are both conserved in the chicken TFR, differences in the oTF sequence may dictate the binding specificity. In oTF, His349 and His350 found in hTF are replaced by a lysine residue (Lys352) and an aspartic acid residue (Asp353), respectively. It is noteworthy that analysis of the kinetic curve for the H349K FeChTF mutant in the absence of the sTFR yielded two similar rate constants (k1 = 1.04 ± 0.29 and k2 = 1.8 ± 0.67, N = 7) (Table 3). The relatively large variability in these rate constants is due to the fact that the equation for the fluorescence intensity for the A → B → C model becomes indeterminate as k1 → k2. Thus, when k1 and k2 have comparable values, the fitting parameters inherently have a greater uncertainty (see the electronic supplementary material). In the presence of the sTFR, two essentially identical rate constants were observed for the H349K mutant (Table 4), the data being best fit to the model with k1 = k2 (the equation is provided in the electronic supplementary material). Of significance, the rate constants for the H349K mutant in the presence and absence of the sTFR are very similar, indicating that the sTFR has almost no effect on either event in this mutant. The steady-state spectra and urea gel analysis are consistent with complete removal of iron under the conditions used. These findings are particularly significant because previous surface plasmon resonance binding data indicated that the lysine substitution had a smaller effect on actual binding of apo H349K hTF at pH 5.6 (sixfold lower) than the alanine substitution (22-fold) [5]. Thus, neither the binding nor the constitutive positive charge is the reason per se for the lack of influence of the receptor on the rate of iron removal from this mutant. Moreover, the inability of the H349K mutant to respond to changes in pH (Fig. S3b) is consistent with destabilization of the complex due to repulsion between Lys349 and Lys511. Curiously, oTF has a histidine residue (His518) in place of Lys511, such that Lys352 and His518 in oTF could interact in a similar manner as His349 and Lys511 in hTF.
In the absence of the TFR, substitution of His349 by aspartic acid resulted in a small (1.3-fold) decrease in the rate constant for iron release from the C-lobe of the H349D mutant. However, it is evident from the urea gels and steady-state fluorescence data that only about half of the iron is removed from the H349D mutant after incubation for 15 min in our standard pH 5.6 iron-removal buffer (Fig. 1a). Additionally, iron removal from the H349D/sTFR complex fit to a simple A → B model, yielding a single rate constant with a value between that of k1 and k2 of the control (Table 4) and making the assignment of this rate constant to a conformational change or to iron release challenging. Simulations comparing the effect of varying the relative values of k1 and k2 reveal that when k2 is three to tenfold faster than k1, only a single exponential is obtained (Fig. S5). Therefore, we propose that the single rate constant obtained for the H349D FeChTF/sTFR complex is most likely due to the conformational change and that subsequent loss of iron is very fast, i.e., k2 ≫ k1. Furthermore, unlike any of the other His349 mutants, iron release is still incomplete even in the H349D/sTFR complex (Fig. 1b). Taken together, these data indicate that in the H349D/sTFR complex a conformational change occurs that is approximately 50% slower than that of the control (Table 4) and that only approximately 50% of the total iron is removed (Fig. 1b). We estimate that at pH 5.6 the level of protonation would be only approximately 2%, assuming a pKa of 3.7. Perhaps the insensitivity of Asp349 to protonation locks the conformation (possibly through electrostatic interactions with Lys511 of hTF) and prevents complete iron removal.
As might be expected, the H349W and H349Y mutants share similar properties. As with the H349D mutant, iron release under our standard conditions in the absence of the sTFR is incomplete. On the basis of the steady-state fluorescence data in Table 2, we estimate that at pH 5.6 only approximately 40% of the iron is removed from the H349W mutant alone, whereas approximately 70% of the iron is released from the H349Y mutant alone. However, unlike the H349D mutant, in the presence of the sTFR iron release for H349W and H349Y approaches completion (Fig. 1b). Additionally, both mutants in complex with the sTFR yielded a similar single rate constant (Fig. 3d; Table 4), which, on the basis of the urea gel analysis, can be attributed to iron release. Significantly, for each there is no discernable conformational event and the iron release rate constant is within experimental error of that for the control. The hydrophobic nature of these substitutions (H349W and H349Y) apparently allows these two mutants to interact with the hydrophobic patch on the TFR (Trp641/Phe760) even at neutral pH when iron is bound in the C-lobe, thereby eliminating the pH- and TFR-induced conformational change. In essence, when bound to the sTFR, the H349W and H349Y FeChTF mutants are already “primed” and correctly positioned for iron release and do not require the pH-induced conformational change to interact with the sTFR. Additionally, the failure of these two mutants to completely release iron in the absence of the TFR suggests that substitution of His349 by a pH-insensitive bulky side chain perhaps alters the conformation in a manner that limits access of the chelator to the iron by restricting the opening of the cleft.
In summary, our current work demonstrates that during evolution the histidine residue at position 349 in hTF has been selected and maintained to provide exquisite control as all or part of a pH-inducible switch. As such, it has an enormous influence on iron release from the C-lobe of hTF when it is bound to the TFR and is a critical participant in the mechanism that allows efficient iron release from the C-lobe.
Supplementary Material
Acknowledgments
This work was supported by the United States Public Health Services (R01 DK21739) for A.B.M. and the National Institute of General Medical Sciences (R01 GM20194) for N.D.C. Support for A.N.S. and S.L.B. came from the Hemostasis and Thrombosis Training Grant (5T32HL007594), awarded to K.G. Mann at The University of Vermont by the National Heart, Lung and Blood Institute.
Abbreviations
- BHK cells
Baby hamster kidney cells
- Fe2hTF
Diferric human serum transferrin
- FeChTF
Recombinant N-terminal hexa-His-tagged nonglycosylated monoferric human serum transferrin that binds iron only in the C-lobe
- hTF
Human serum transferrin
- MES
2-Morpholinoethanesulfonic acid
- NTA
Nitrilotriacetic acid
- oTF
Ovotransferrin
- sTFR
Glycosylated, N-terminal hexa-His-tagged soluble recombinant transferrin receptor (residues 121–760)
- TBE
Tris(hydroxymethyl)aminomethane–borate–EDTA
- TF
Serum transferrin
- TFR
Transferrin receptor
- Tris
Tris(hydroxymethyl)aminomethane
Footnotes
Electronic supplementary material The online version of this article (doi:10.1007/s00775-010-0694-2) contains supplementary material, which is available to authorized users.
Contributor Information
Ashley N. Steere, Department of Biochemistry, College of Medicine, University of Vermont, 89 Beaumont Avenue, Burlington, VT 05405-0068, USA
Shaina L. Byrne, Department of Biochemistry, College of Medicine, University of Vermont, 89 Beaumont Avenue, Burlington, VT 05405-0068, USA
N. Dennis Chasteen, Department of Chemistry, Parsons Hall, University of New Hampshire, Durham, NH 03824, USA.
Valerie C. Smith, Department of Biochemistry and Molecular Biology and Centre for Blood Research, University of British Columbia, Vancouver, BC V6T 1Z3, Canada
Ross T. A. MacGillivray, Department of Biochemistry and Molecular Biology and Centre for Blood Research, University of British Columbia, Vancouver, BC V6T 1Z3, Canada
Anne B. Mason, Email: anne.mason@uvm.edu, Department of Biochemistry, College of Medicine, University of Vermont, 89 Beaumont Avenue, Burlington, VT 05405-0068, USA
References
- 1.Klausner RD, Ashwell G, van Renswoude J, Harford JB, Bridges KR. Proc Natl Acad Sci USA. 1983;80:2263–2266. doi: 10.1073/pnas.80.8.2263. [DOI] [PMC free article] [PubMed] [Google Scholar]
- 2.Dautry-Varsat A, Ciechanover A, Lodish HF. Proc Natl Acad Sci USA. 1983;80:2258–2262. doi: 10.1073/pnas.80.8.2258. [DOI] [PMC free article] [PubMed] [Google Scholar]
- 3.Aisen P, Enns C, Wessling-Resnick M. Int J Biochem Cell Biol. 2001;33:940–959. doi: 10.1016/s1357-2725(01)00063-2. [DOI] [PubMed] [Google Scholar]
- 4.Zak O, Aisen P. Biochemistry. 2003;42:12330–12334. doi: 10.1021/bi034991f. [DOI] [PubMed] [Google Scholar]
- 5.Giannetti AM, Halbrooks PJ, Mason AB, Vogt TM, Enns CA, Bjorkman PJ. Structure. 2005;13:1613–1623. doi: 10.1016/j.str.2005.07.016. [DOI] [PubMed] [Google Scholar]
- 6.Byrne SL, Chasteen ND, Steere AN, Mason AB. J Mol Biol. 2010;396:130–140. doi: 10.1016/j.jmb.2009.11.023. [DOI] [PMC free article] [PubMed] [Google Scholar]
- 7.Aisen P, Leibman A. Biochem Biophys Res Commun. 1968;30:407–413. doi: 10.1016/0006-291x(68)90759-6. [DOI] [PubMed] [Google Scholar]
- 8.Lawrence CM, Ray S, Babyonyshev M, Galluser R, Borhani DW, Harrison SC. Science. 1999;286:779–782. doi: 10.1126/science.286.5440.779. [DOI] [PubMed] [Google Scholar]
- 9.Giannetti AM, Snow PM, Zak O, Bjorkman PJ. PLoS Biol. 2003;1:E51. doi: 10.1371/journal.pbio.0000051. [DOI] [PMC free article] [PubMed] [Google Scholar]
- 10.Cheng Y, Zak O, Aisen P, Harrison SC, Walz T. Cell. 2004;116:565–576. doi: 10.1016/s0092-8674(04)00130-8. [DOI] [PubMed] [Google Scholar]
- 11.Mason AB, He QY, Halbrooks PJ, Everse SJ, Gumerov DR, Kaltashov IA, Smith VC, Hewitt J, MacGillivray RT. Biochemistry. 2002;41:9448–9454. doi: 10.1021/bi025927l. [DOI] [PubMed] [Google Scholar]
- 12.Byrne SL, Leverence R, Klein JS, Giannetti AM, Smith VC, MacGillivray RT, Kaltashov IA, Mason AB. Biochemistry. 2006;45:6663–6673. doi: 10.1021/bi0600695. [DOI] [PubMed] [Google Scholar]
- 13.James NG, Mason AB. Anal Biochem. 2008;378:202–205. doi: 10.1016/j.ab.2008.04.012. [DOI] [PMC free article] [PubMed] [Google Scholar]
- 14.Pace CF, Vajdos F, Fee L, Grimsley G, Gray T. Protein Sci. 1995:2411–2423. doi: 10.1002/pro.5560041120. [DOI] [PMC free article] [PubMed] [Google Scholar]
- 15.Wetlaufer DB. Adv Protein Chem. 1962;17:303–391. doi: 10.1016/s0065-3233(08)60518-5. [DOI] [PubMed] [Google Scholar]
- 16.Lehrer SS. J Biol Chem. 1969;244:3613–3617. [PubMed] [Google Scholar]
- 17.James NG, Berger CL, Byrne SL, Smith VC, MacGillivray RT, Mason AB. Biochemistry. 2007;46:10603–10611. doi: 10.1021/bi602425c. [DOI] [PubMed] [Google Scholar]
- 18.Byrne SL, Mason AB. J Biol Inorg Chem. 2009;14:771–781. doi: 10.1007/s00775-009-0491-y. [DOI] [PMC free article] [PubMed] [Google Scholar]
- 19.James NG, Byrne SL, Mason AB. Biochim Biophys Acta. 2008;1794:532–540. doi: 10.1016/j.bbapap.2008.11.017. [DOI] [PMC free article] [PubMed] [Google Scholar]
- 20.Dougherty DA, Stauffer DA. Science. 1990;250:1558–1560. doi: 10.1126/science.2274786. [DOI] [PubMed] [Google Scholar]
- 21.Ma JC, Dougherty DA. Chem Rev. 1997;97:1303–1324. doi: 10.1021/cr9603744. [DOI] [PubMed] [Google Scholar]
- 22.Zacharias N, Dougherty DA. Trends Pharmacol Sci. 2002;23:281–287. doi: 10.1016/s0165-6147(02)02027-8. [DOI] [PubMed] [Google Scholar]
- 23.Williams S, Bledsoe RK, Collins JL, Boggs S, Lambert MH, Miller AB, Moore J, McKee DD, Moore L, Nichols J, Parks D, Watson M, Wisely B, Willson TM. J Biol Chem. 2003;278:27138–27143. doi: 10.1074/jbc.M302260200. [DOI] [PubMed] [Google Scholar]
- 24.Yamamoto T, Chen HC, Guigard E, Kay CM, Ryan RO. Biochemistry. 2008;47:11647–11652. doi: 10.1021/bi801117t. [DOI] [PMC free article] [PubMed] [Google Scholar]
- 25.Gerchman Y, Olami Y, Rimon A, Taglicht D, Schuldiner S, Padan E. Proc Natl Acad Sci USA. 1993;90:1212–1216. doi: 10.1073/pnas.90.4.1212. [DOI] [PMC free article] [PubMed] [Google Scholar]
- 26.Rotzschke O, Lau JM, Hofstatter M, Falk K, Strominger JL. Proc Natl Acad Sci USA. 2002;99:16946–16950. doi: 10.1073/pnas.212643999. [DOI] [PMC free article] [PubMed] [Google Scholar]
- 27.Feliciangeli SF, Thomas L, Scott GK, Subbian E, Hung CH, Molloy SS, Jean F, Shinde U, Thomas G. J Biol Chem. 2006;281:16108–16116. doi: 10.1074/jbc.M600760200. [DOI] [PMC free article] [PubMed] [Google Scholar]
- 28.Sakajiri T, Yamamura T, Kikuchi T, Yajima H. Protein J. 2009;28:407–414. doi: 10.1007/s10930-009-9208-x. [DOI] [PubMed] [Google Scholar]
- 29.Penhallow RC, Brown-Mason A, Woodworth RC. J Cell Physiol. 1986;128:251–260. doi: 10.1002/jcp.1041280217. [DOI] [PubMed] [Google Scholar]
Associated Data
This section collects any data citations, data availability statements, or supplementary materials included in this article.