

Abstract
Molecular scanning of human insulin receptor substrate (Irs) genes revealed a single lrs1 prevalent variant, a glycine to arginine change at codon 972 (G972R); previous in vitro studies had demonstrated that the presence of this variant results in an impaired activation of the insulin signalling pathway, while human studies gave controversial results regarding its role in the pathogenesis of insulin resistance and related diseases. To address in vivo impact of this IRS-1 variant on whole body glucose homeostasis and insulin signalling, we have generated transgenic mice overexpressing it (Tg972) and evaluated insulin action in the liver, skeletal muscle and adipose tissue and assessed glucose homeostasis both under a normal diet and a high-fat diet. We found that Tg972 mice developed age-related glucose and insulin intolerance and hyperglycaemia, with insulin levels comparatively low. Glucose utilization and insulin signalling were impaired in all key insulin target tissues in Tg972 mice. There were no differences in pancreatic morphology between Tg972 and wild-type mice, however when insulin secretion was evaluated in isolated islets, it was significantly reduced in Tg972 mice islets at any glucose concentration tested. Under a high-fat diet, Tg972 mice had increased body and adipose tissue weight, and were more prone to develop diet-induced glucose and insulin intolerance. So, we believe that Tg972 mice may represent a useful model to elucidate the interaction between genetic and environmental factors in insulin resistance pathogenesis. Furthermore, they may become an important tool to test novel tailored therapies.
Keywords: Mouse model, insulin signalling, insulin resistance, glucose intolerance
Introduction
Insulin receptor substrate (IRS) molecules are key intracellular signalling mediators, which transduce insulin action on cell metabolism and growth, via recruitment and activation of cytoso-lic kinases such as PI3-kinase [1, 2]. Molecular scanning of human Irs genes revealed a single Irs1 prevalent variant, a glycine to arginine change at codon 972 (G972R) [3, 4]. A first in vitro study demonstrated that G972R IRS1 variant expression in 32D cells causes an impairment of insulin-stimulated association between G972R IRS-1 and the p85 subunit of phosphatidylinositol 3-kinase (PI 3-kinase) [5]. Subsequently, cell culture studies revealed that this weakened association results in impaired glucose metabolism in skeletal muscle cells [6], reduced insulin secretion and cell survival in both islets and pancreatic β cells [7, 8], and altered regulation of endothelial nitric oxide synthase activation in endothelial cells [9]. More recently it has been observed that the introduction of the G972R variant in a recombinant pep-tide comprising amino acids 925–1008 from IRS-1 causes in vitro a reduction of Tyr phosphorylation on two specific residues Tyr941 and Tyr989, which are known binding sites for the p85α regulatory subunit, and acts as a competitive inhibitor for insulin receptor autophosphorylation (10). On the whole, the data obtained in vitro and in cellular models confirm that the presence of the G972R variant is detrimental for insulin signalling, thus suggesting that it may contribute to insulin resistance in human carriers. Data from human studies, however, are more controversial, with some earlier reports describing an association of the G972R variant with type 2 diabetes [3, 4, 11] and subsequent larger studies not confirming these findings [12–15]. Interestingly one of this studies [15] has shown that while the presence of the R allele had no independent effect on type 2 diabetes risk, it increased the risk in subjects with elevated fasting glucose and body mass index, thus hinting to the possibility that the G972R variant may have an additive effect with other, genetic or environmental, risk factors in determining the susceptibility to type 2 diabetes and related diseases. To address in vivo the impact of the G972R IRS-1 variant on whole body glucose homeostasis and insulin signalling, we have generated transgenic mice with a generalized overexpression of this IRS-1 form.
Materials and methods
Animal husbandry, genotyping and analytical procedures
The human G972R IRS-1 variant was subcloned into a pCAGGS vector and Tg972 mice were generated on an FVB background according to standard procedures [16]. Founders were identified by Southern Blot of tail DNA and the presence of the G972R variant was confirmed by PCR amplification of the same DNA samples and subsequent digestion with Mval restriction enzyme (Roche Applied Science, Basel, Switzerland) as described [4]. Routine genotyping was then carried out by PCR using specific primers for the human IRS-1 transgene (forward 5′- CTTCTGTCAGGTGTCCATCC-3′ and reverse 5’-TGGCGAGGTGTCCACGTAGC-3’). High Fat Diet (60%Kcal from fat, 20%Kcal from carbohydrates, 20%Kcal from proteins) and normal chow were purchased from Research Diets (NY,USA). Weight gain was measured weekly. Three-to-six months-old male mice were used for the experiments described. Animal studies were approved by the University of Rome ‘Tor Vergata’ Animal Care and Use Committee and were in accordance to the Principles of Laboratory Animals Care (NIH publication no. 85–23, revised 1985) and to Italian law 116 of January 27,1992 and following amendments.
Glucose tolerance tests and measurement of plasma insulin levels
Blood for plasma glucose and insulin levels was obtained by retro-orbital bleeds. Glucose levels were determined using a Glucometer Elite (Bayer Health Care, Tarrytown, NY, USA). Plasma was separated by centrifugation at 4°C and stored at −20°C until assayed. For calculation of plasma glucose/insulin (G/l) ratios, plasma fast glucose (mg/dl) was divided by plasma fast insulin (ng/ml). For intraperitoneal glucose tolerance tests (IPGTT), Tg972 mice and their wild-type (WT) littermates were fasted for 15 hrs and injected intraperitoneally with 2 g/Kg body weight of D-glucose. Blood samples were taken from the tail vein immediately before and 30, 60: 90 and 120 min. after injection. Immunoreactive insulin levels were measured using a commercial ELISA kit (Mercodia, Uppsala, Sweden).
For insulin tolerance tests (ITT) Tg972 mice and their WT littermates were fasted for 4 hrs and injected intraperitoneally with 0.75 units per Kg body weight with human crystalline insulin (Lilly Research Laboratories, Indianapolis, Indiana, USA). Blood was taken from the tail vein immediately before and 10, 30 and 60 min. after injection.
In vivo insulin stimulation
After 6-hrs fasting, WT and Tg972 mice were anaesthetized by pentobarbi-tal intraperitoneal injection (40 mg per Kg body weight). Insulin stimulation was carried out as described [17], briefly 5U of regular human insulin were injected into the inferior vena cava, 3 min. later tissues were harvested and frozen in liquid nitrogen.
Western blots
Lysates from white adipose tissue, liver and muscle were prepared and western blots performed as previously described [17]. For immunoprecip-itation, tissue lysates were incubated for 16 hrs at 4°C with anti-IRS-1 or anti-IRS-2 antibody. Immunocomplexes were collected with incubation with Protein A-Sepharose for 2 hrs at 4°C. Immunoprecipitated proteins or tissue lysates were then re-suspended in Laemmli buffer, resolved on SDS-PAGE, transferred onto nitrocellulose membranes, and probed with the appropriate antibodies. The following antibodies were used: anti-IRS1 anti-phospho-Tyr941 IRS-1 (Biosource International, Camarillo, CA, USA): anti-phospho-Tyr989 IRS-1 (Santa Cruz Biotechnologies, Santa Cruz, CA: USA), anti-IRS-2, anti PI3K p85 subunit (Upstate Biotechnology, Billerica, MA, USA), anti-phospho-Ser473Akt, anti-Akt, anti-phospho-Ser21/ser9 α/βGSK3 (Cell Signalling Technology, Inc. Danvers, MA, USA), anti total phosphotyrosine (Becton and Dickinson, Franklin Lakes, NJ, USA).
RNA extraction and real time quantitative PCR analysis
Total RNA was extracted from adipose tissue or liver using Trizol reagents (Invitrogen Corp., Carlsbad, CA, USA). Real-time PCR was carried out on individual samples from adult mice using an ABI PRISM 9700 System and TaqMan reagents (Applied Biosystems, Foster City, CA, USA). Each reaction was carried out in triplicate using standard reaction conditions, the relative quantity of each target transcript was normalized to message for β-actin, which was amplified simultaneously with target genes, but in separate triplicate-reaction tubes. Primers sequences are available upon request.
In vivo tissue glucose transport during a glucose tolerance test
2-Deoxy-D-[1, 2-3H]-glucose (Amersham Biosciences, Piscataway, NJ USA) was mixed with 20% dextrose before intraperitoneal injection (2 g/kg body weight; 10 NCi/mouse) into weight-matched 6-month-old male mice [17]. Blood samples were obtained from tail veins atO, 15, 30, 45, 60 and 120 min. and used to determine glucose-specific activity as described previously. At 120 min., mice were killed and tissues were snap-frozen in liquid nitrogen. To determine tissue accumulation of 2-deoxyglucose-6-phosphate (2-D0G-6-phosphate), 100-500 mg tissue (triceps and perig-onadal adipose tissue) was homogenized and processed as described previously. To calculate the 2-DOG uptake, the counts (degenerations per minute) were divided by the integrated glucose-specific activity area under the curve and normalized to the sample protein content [18].
2-D0G incorporation into liver glycogen and liver glycogen measurement during a glucose tolerance test
Frozen liver (50–75 mg) was pulverized with mortar and pestle in liquid nitrogen and digested. Macromolecules were then allowed to precipitate and used to determine radioactivity incorporation as described previously. To determine 2-Deoxy-Glucose (2-DOG) incorporation into liver glycogen, [3H]radioactivity in glycogen counts (degenerations per minute) was divided by the integrated glucose-specific activity area under the curve and corrected for sample protein content [17].
Pancreata histological analysis and morphometry
Pancreata were fixed overnight in 4% paraformaldehyde and embedded in paraffin using standard techniques [19]. Sections were then placed on glass slides, deparaffinized with xylene and stained with haematoxylin and eosin. Immunostaining for insulin or glucagon was carried out with the Histomouse-SP kit (Zymed Laboratories Inc., South San Francisco, California, USA) according to the manufacturers' instructions. Six sections for each pancreas were imaged at a 20x magnification and quantified for surface areas. Areas corresponding to the β-cells were measured by dividing the area of insulin-positive immunoreactivity by whole pancreas area.
Pancreatic insulin content
To assess insulin content, pancreata were extracted in 400 μl of acid ethanol extraction medium overnight at 4°C [20]. All extracts were stored at −20°C for subsequent insulin levels detection.
Islet isolation and insulin secretion
Islets were isolated using the intraductal collagenase technique as described [21]. Briefly, the common bile duct was cannulated in the antero-grade direction and the pancreas distended with collagenase type P (4 mg in 5 ml, Boehringer Mannheim, Mannheim, Germany), dissected free and incubated at 37°C for 13 min. Islets of similar sizes (100-150 μm) were handpicked from WT and Tg972 mice. All experiments were carried out with islets from a single harvest pool. Islets were washed in M199 medium with Fetal Bovine Serum (FBS) and cultured for 48 hrs at 37°C. Secretion experiments were carried out in 12-well plates (15–25 islets per well). After incubation, the media was collected, centrifuged and stored at -20°C for subsequent insulin levels detection. Insulin secretion levels were normalized for insulin content.
Statistics
Results of the experimental studies are expressed mean ± standard deviation (SD). Statistical analyses were performed using the anova or unpaired Student's t test as indicated. Values of P<0.05 were considered statistically significant.
Results
To investigate in vivo impact of the human G972R IRS-1 variant on insulin resistance and glucose homeostasis, a cDNA containing this mutant form was subcloned into a pCAGGS vector and used to generate transgenic mice (Tg972). IRS-1 protein overex-pression was confirmed by Western Blot in protein lysates from liver (Fig. 1A), skeletal muscle (Fig. 1B), adipose tissue (Fig. 1C). heart (Fig. 1D), pancreas (Fig. 1E) and purified pancreatic islets (Fig. 1F) in two transgenic lines, indicated as L1 and L2. These two lines were subjected to a preliminary metabolic characterization and they showed no major differences, thus L1 mice were used for subsequent experiments. Tg972 mice were born at the predicted Mendelian frequency and were not significantly different from their WT littermates in length and weight, at up to 6 months of age (data not shown). To evaluate the effect of the G972R variant on whole body glucose metabolism, we determined fed and fasting glucose and insulin levels in Tg972 mice and their WT littermates at 3 and 6 months of age (Table 1). Fed and fasting glucose levels were slightly, but not significantly increased in 3-months-old Tg972 mice compared with their WT littermates. However, by 6-months of age, Tg972 mice showed significantly higher fed and fasting glucose levels (P < 0.01) with insulin levels inadequately low for their degree of hyperglycaemia (Table 1 and Fig. 1G. P < 0.0001).
Fig 1.
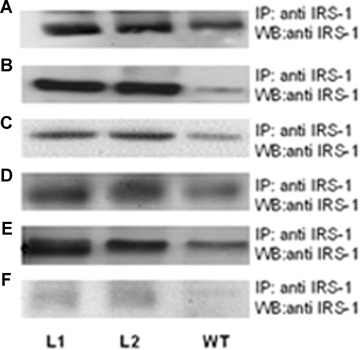

Metabolic characterization of 3-months and 6-months-old Tg972 mice. Insulin receptor substrate (IRS)-1 overexpression in two Tg972 lines (L1 and L2). Livers (A), skeletal muscles (B), adipose tissues (C), hearts (D), pancreata (E) and purified pancreatic islets (F) from 3-months-old Tg972 and wild-type (WT) male mice were lysed and IRS-1 overexpression was assessed in protein lysates by immunoprecipitation (IP) and subsequent Western Blot (WB) with an anti-IRS-1 antibody. Images shown are representative of five experiments. (G) Fasting glucose/insulin ratio (mg/dl/ ng/ml) in WT and Tg972 mice at 6 months of age. ***P < 0.0001 for Tg972 versus WT mice by Student's t-test (n= 12–14 per genotype). Glucose levels after an intraperitoneal glucose load (IPGTT) in WT (squares) and Tg972 (circles) mice at 3 (H) and 6 months (I) of age. Data are expressed as mean ± SD (n = 5–10 per genotype). **P<0.01, *** P<0.0001 for Tg972 versus WT mice by 2-way anova. Insulin tolerance test (ITT) in WT (squares) and Tg972 (circles) mice at 3 (I) and 6 months (M) of age. Data are expressed as mean ± SD (n = 5–10 per genotype). ** P < 0.01,*** P < 0.0001 for Tg972 versus WT mice by 2-way anova.
Table 1.
Metabolic parameters of 3- and 6-months-old WT and Tg972 mice fed either ND or- FD.
| WTi nice | Tg972 mice | |||||||
|---|---|---|---|---|---|---|---|---|
| 3mND | 6mND | 3 m HFD | 6 m HFD | 3mND | 6mND | 3 m HFD | 6 m HFD | |
| Fed glucose (mg/dl) | 120 ± 30 | 140 ± 20 | 213 ± 28 | 320 ± 45 | 132 ± 42.92 | 165 ± 43# | 232 ± 27§ | 370 ± 65* |
| (n = 30) | (n = 25) | (n = 19) | (n = 12) | (n = 25) | (n = 30) | (n = 17) | (n = 10) | |
| Fed Insulin (ng/ml) | 1.1 + 0.25 | 1.2 ± 0.6 | 2.41 + 0.51 | 3.1 ± 0.45 | 0.95 ± 0.43 | 0.75 ± 0.4† | 3.41 + 1.07 § | 2.6 ± 0.4* |
| (n = 20) | (n = 15) | (n = 10) | (n = 7) | (n = 22) | (n = 12) | (n = 9) | (n = 7) | |
| Fasting glucose (mg/dl) | 75 ± 21 | 85 ± 22 | 114 + 31 | 120 ± 22 | 82 ± 20 | 115 + 34# | 137 ± 39§ | 160 ± 17° |
| (n = 45) | (n = 20) | (n = 21) | (n = 11) | (n = 40) | (n = 28) | (n = 27) | (n = 8) | |
| Fasting insulin (ng/ml) | 0.65 ± 014 | 0.75 ± 0.4 | 1.96 ± 0.34 | 2.2 ± 0.4 | 0.55 ± 0.4 | 0.52 ± 0.4 | 2.1 ± 0.34 | 1.4 ± 0.3Λ |
| (n = 15) | (n = 18) | (n = 10) | (n = 6) | (n = 17) | (n = 16) | (n = 12) | (n = 7) | |
Samples were collected in fed or overnight fasted male mice. Data are expressed as mean ± SD.
P < 0.01,
P < 0.05 for ND Tg972 mice versus ND WT mice at 6 months of age,
P < 0.05 for HFD Tg972 mice versus HFD WT mice at 3 months of age,
P < 0.05,
P < 0.01,
P < 0.0001 for HFD Tg972 mice versus HFD WT mice at 6 months of age by Student's t-test.
IPGTT and ITT tests confirmed these observations (Fig. 1H–M). showing that Tg972 mice develop glucose intolerance and insulin resistance that worsen with age (P<0.01 and P<0.0001 at 3 and 6 months, respectively).
Reduced insulin secretion and altered insulin sensitivity may both play a role in the observed phenotype. To explore the first possibility, we evaluated islets morphology and insulin content in 4- to 6-months-old male mice. We did not observe any difference either in islets number and size or in the structure of the islets, as assessed by insulin and glucagon staining, (Fig. 2A–E) or in the total pancreatic insulin content (3.445 ± 2.41 and 3.875 ± 2.49 ng insulin/microgram protein for WT and Tg972 mice, respectively) of Tg972 mice compared with their WT littermates. However, when we assessed insulin secretion in isolated islets, we observed that insulin release was significantly reduced in Tg972 islets at any glucose concentration tested (Fig. 2FP < 0.0001). Then, we proceeded to evaluate peripheral insulin resistance and observed a 42% (P < 0.01) and a 40% (P < 0.05) reduction in glucose uptake in skeletal muscle and adipose tissue of Tg972 mice, respectively, as compared with WT littermates (Fig. 3A and B) and a 42% reduction in glucose incorporation into glycogen, an index of glycogen synthesis, (Fig. 3C, P < 0.0001) in the liver of Tg972 mice.
Fig 2.
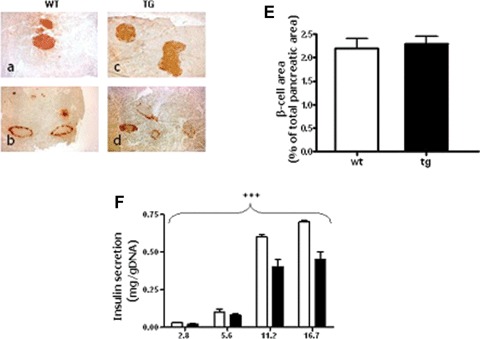
Pancreatic morphology and insulin secretion in Tg972 and WT mice. Representative images of pancreatic sections from 4- to 6-months-old male WT (A, B, n= 4) and Tg972 mice (C, D, n= 4) stained with anti-insulin (A, C) or anti-glucagon antibody (B, d) are shown at a 20x magnification. Six sections were examined for each mouse. (E) Morphometric analysis of β-cell area, β-cell area is expressed as percentage of the total pancreatic area surveyed. Values are derived from six separate sections for each animal and four animals for each genotype and are expressed as mean ± SD. (F) Glucose stimulated insulin secretion in islet isolated from 4- to 6-months-old WT and Tg972 mice. Data are mean ± SD from two different experiments, each performed in quadruplicate. *** P < 0.001 Tg972 versus WT by 2-anova.
Fig 3.

G972R IRS-1 variant alters insulin action in peripheral tissues. 2-DOG uptake was evaluated during a glucose tolerance test into skeletal muscle (A) and adipose tissue (B) from 6-months-old WT and Tg972 littermates. (C) Glucose uptake into liver, as estimated by 2-DOG incorporation into glycogen. Data in A-C represent moles/milligram protein per minute and are expressed as mean ± SD. (n = 5 per genotype) *P < 0.05, ** P < 0.01,*** P < 0.0001 for Tg972 versus WT mice by Student’ s t-test.
These data suggest that the phenotype of 6-months-old Tg972 mice was indeed due to reduced insulin secretion, paralleled by increased demand from insulin resistant peripheral tissues. To further elucidate the molecular mechanisms underlying this phenotype, we assessed the activation of key steps in insulin signalling in peripheral target tissues from 3–4-months-old mice. We observed that, despite the increased IRS-1 expression and total IRS-1 tyro-sine phosphorylation (Fig. 4A and B), the amount of PI3-kinase regulatory subunit, p85, co-precipitated with IRS-1 was significantly reduced in liver lysates from Tg972 mice (Fig. 4A and C, P < 0.0001). Furthermore using liver lysates from Tg972 mice we were able to demonstrated for the first time in vivo a reduction in the phosphorylation levels of Tyr941 and Tyr989, two tyrosine residues that play a pivotal role in p85 binding to IRS-1 (75% and 73% for Tyr941 and Tyr989, respectively, Figure. 4A, D and E, P < 0.05). To exclude the possibility of compensatory mechanisms, we evaluated the expression and insulin-stimulated phosphorylation of the second insulin receptor substrate IRS-2 and observed that there were no difference between Tg972 mice and their WT littermates (Fig. 4F).
Fig 4.

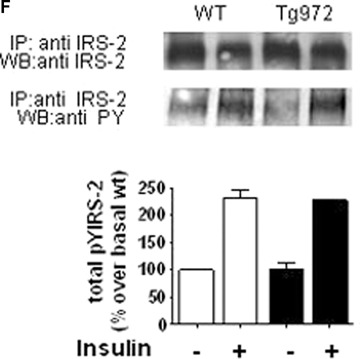
G972R IRS-1 variant alters upstream insulin signalling. After a 6 hrs fast, 3–4-months-old male WT and Tg972 mice were injected with 5 U of insulin and livers were collected as indicated in methods. For upstream insulin signalling analysis, insulin-stimulated IRS-1 total tyrosine phosphorylation (pTyr) (A, upper panel), its association with PI3K p85 subunit (A, middle panel), and IRS-1 phosphorylation on Tyrosine 941 and Tyrosine 989 (A, lower panels) were determined by immunoprecipitating with antibody against IRS-1 and immunoblotting with the indicated antibodies. Band intensities were quantified by den-sitometry; and the values obtained for IRS-1 total tyrosine phosphorylation (B), IRS-1 associated p85 (C) and IRS-1 Tyr941 (D) and Tyr989 (E) phosphorylation were normalized for IRS-1 overexpression and reported as mean ± SD. Images from 1 out of 5 experiments are shown. *P<0.05,***P<0.0001 for insulin-stimulated Tg972 versus insulin-stimulated WT by Student's t-test (n = 4 per genotype) (F) Protein extracts were immunoprecipitated with antibodies against IRS-2 and immunoblotted with antibodies against IRS-2 or anti-phos-photyrosine. Band intensities were quantified by densitometry and expressed as mean ± SD. Images from 1 out of 3 experiments are shown (n = 3 per genotype).
The reduced activation of the upstream insulin signalling steps observed in Tg972 mice was paralleled by a decreased phosphorylation of Akt, a key transducer of downstream insulin signalling in the liver (Fig. 5A, P < 0.01), skeletal muscle (Fig. 5B, P < 0.01) and adipose tissue (Fig. 5C, P < 0.05). Furthermore in the liver, we observed also a 56% reduction of the phosphorylation of glycogen synthase kinase-3 (GSK-3), an Akt substrate, which plays a pivotal role in the regulation of glycogen synthesis (Fig. 5D, P < 0.05).
Fig 5.

G972R IRS-1 variant alters downstream insulin signalling. After a 6 hrs fast, 3–4-months-old male WT and Tg972 mice were injected with 5 U of insulin and livers (A, D), skeletal muscle (B) and adipose tissue (C) were collected as indicated in methods (n = 4–8 per genotype). To detect insulin action in peripheral tissues, protein extracts were immunoblotted with antibodies against phosphorylated Akt (A, B, C; upper panels) or phosphory-lated GSK3 (D; upper panel). Levels of total Akt (A, B, C; lower panels) and total GSK3 (D; lower panel) were determined by blotting the original lysates. Band intensities were quantified by densitometry and expressed as mean ± SD. Images from one out of five experiments are shown. *P<0.05, **P<0.01 for insulin-stimulated Tg972 vs insulin-stimulated WT by Student's t-test.
Finally, to study the effects of environmental factors, we characterized the metabolic phenotype of Tg972 under a high-fat diet (HFD) as a model of environmental challenge [22]. Under HFD, weight gain was significantly increased in Tg972 mice compared with their WT littermates (Fig. 6A, P < 0.0001). Consistently, epidy-dimal adipose tissue weight was significantly increased in HFD Tg972 mice compared with WT littermates (P<0.05, Fig. 6B). The increased adipose tissue weight was mirrored by altered expression of genes involved in adipose tissue function such as leptin, resistin, peroxisome proliferator activated receptor-7 (PPAR7) and adiponectin (P < 0.05, Fig. 6C-F). Interestingly, HFD accelerated the insurgence of hyperglycaemia (Table 1) and glucose intolerance in Tg972 mice; indeed transgenic mice show a significantly reduced glucose tolerance (P < 0.0001, Fig. 6G) and insulin sensitivity (P<0.0001, Fig. 6H) at 3 months of age as compared with their WT littermates. At variance with the phenotype observed under a normal diet, Tg972 mice did not show reduced insulin levels compared with their WT littermates (Table 1), suggesting that under HFD peripheral insulin resistance may be the prevalent defect responsible of the observed metabolic alterations. However, when HFD was prolonged until the mice were 6-months-old, Tg972 mice showed significantly lower fed and fasting insulin levels (Table 1) paralleled by significantly increased glucose levels (Table 1), suggesting that, at this stage, they have developed a deficiency in insulin secretion. This hypothesis was sustained by the observation that serum insulin levels 120 min. after glucose injection were significantly lower in Tg972 mice than in their WT littermates (P < 0.0001, Fig. 6L), and the Tg972 mice were therefore unable to counteract the rise in glucose levels after a glucose load (P<0.0001, Fig. 6I).
Fig 6.
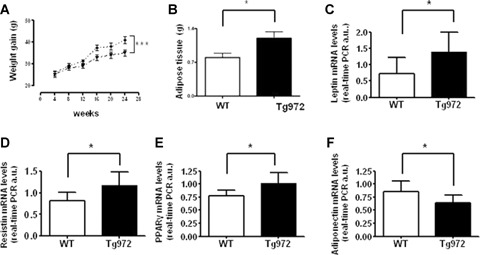

Increased obesity, adipokines expression and effect of high fat diet on glucose homeostasis in HFD Tg972 mice. Body (A) and adipose tissue (B) weight of Tg972 and WT mice on high-fat diet (HFD). Data are expressed as mean ± SD (n = 15 per genotype) * P < 0.05, ***P < 0.001 for HFD Tg972 versus HFD WTby2-wayAN0VA. Leptin (C), resistin (D), peroxisome proliterator activated receptor-y (PPAR-y) (E) and adiponectin (F) mRNA levels Data are mean ± SD from two separate experiments, each performed in triplicate. * P<0.05 for HFD Tg972 versus HFD WT by Student's t-test (n = 6–8 per genotype). (G) Glucose levels after intraperitoneal glucose load in 3-months-old HFD WT (triangles) and HFD Tg972 (diamonds). Data are expressed as mean ± SD (n = 8–12 per group). ***p < 0.0001 for HFD Tg972 mice versus HFD WT by 2-way ANOVA. (H) Insulin tolerance test (0, 75 U/Kg) in 3-months-old HFD WT (triangles) and HFD Tg972 (diamonds). Data are expressed as mean ± SD (n = 8–10 per group).***P<0.0001 for HFD Tg972 mice versus HFD WT mice by 2-way ANOVA. (I) Glucose levels after intraperitoneal glucose load in 6-months-old HFD WT (triangles) and HFD Tg972 (diamonds). Data are expressed as mean ± SD (n = 2–5 per group). ***P<0.0001 for HFD Tg972 mice versus HFD WT by 2-way anova. Insulin (L) concentrations at 0 and 120 min. during IPGTT in 6-months-old HFD WT and HFD Tg972 mice. Data are expressed as mean ± SD (n = 5–8 per genotype). **P < 0.01,***P < 0.0001 for HFD Tg972 mice versus HFD WT mice by Student's t-test.
Discussion
To assess the impact of the G972R variant on whole-body glucose homeostasis and insulin signalling, we have generated transgenic mice with a generalized overexpression of this IRS-1 form. We observed that key insulin target tissues from Tg972 mice, such as skeletal muscle, liver and adipose tissues, showed reduced activation of the insulin signalling pathway downstream of IRS-1, similarly to what has been previously showed in primary and immortalized cell lines. Indeed, it has been known for several years that in a number of different cellular systems the presence of the R residue at position 972 in the IRS-1 molecules causes a reduced binding of IRS-1 with PI3-kinase, however until recently the molecular mechanism underlying this phenomenon was not elucidated. Kahn and coworkers demonstrated in in vitro experiments with IRS-1 fragments that the R residue caused a reduction of insulin-stimulated phosphorylation of two flanking tyrosine phosphorylation sites, Tyr941 and Tyr989, that play a pivotal role in IRS-1 binding to PI3-kinase [10]. Here, we were able to confirm for the first time in vivo that in the presence of G972R IRS-1 insulin-stimulated phosphorylation of Tyr941 and Tyr989 is significantly reduced. The impaired activation of the insulin pathway resulted in decreased tissue specific insulin action and eventually, as the mice aged, in whole-body insulin resistance. The decreased insulin sensitivity in aged mice was not paralleled by a compensatory increase in plasma insulin levels, thus suggesting that the G972R variant made pancreatic beta-cells unable to respond to the increased insulin demand. Indeed, 6-months-old Tg972 mice showed significantly reduced fed insulin levels and a significantly reduced G/l ratio in a fasting state. Furthermore, islets isolated from Tg972 mice, before the insurgence of insulin resistance, show a reduced glucose-stimulated insulin secretion, suggesting that the two defects, decreased insulin sensitivity and decreased insulin secretion, develop in parallel in the Tg972 mice and contribute to the progression of the disease. Interestingly, HFD accelerates the insurgence of glucose intolerance and insulin resistance in Tg972 mice, thus sustaining the hypothesis that the G972R variant may act as a modifier gene, increasing the risk for type 2 diabetes in individuals that present an unfavourable phenotype [15]. Indeed, the observation that obese carriers of the G972R IRS-1 variant are characterized by decreased insulin sensitivity associated with a cluster of metabolic alterations, including elevated fasting levels of plasma glucose, had led to hypothesize that this variant amplifies obesity-linked insulin resistance [15, 23, 24]. The molecular mechanism underlying this interaction however has not been explained yet, therefore the Tg972 mice can represent a useful tool to address this issue. Of note, adipose tissue from Tg972 obese mice express higher mRNA levels of leptin and resistin; interestingly results from microarray studies on adipose tissue obtained from human obese subjects showed that G972R carriers have increased expression of obesity-related genes, including leptin and resistin, as compared with weight-matched WT individuals [25]. This observation suggests that the G972R IRS-1 variant may affect insulin sensitivity through multiple mechanisms, including regulation of gene expression, that have not been exhaustively addressed.
In conclusion, we believe that the humanized mouse model we have generated in this study is an ideal model to further elucidate the interaction between genetic and environmental factors in the pathogenesis of type 2 diabetes. Additionally, we have previously shown that type 2 diabetic carriers of the G972R variant had an increased risk for secondary failure to sulfonylureas [26]; thus providing a first evidence that this variant may influence treatment response in carriers. More recently, Haring and coworkers found cerebrocortical insulin resistance in individuals carrying the G972R IRS-1 variant [27]. Therefore, in light of the recent developments in the field of pharmacogenetics [28], the Tg972 mice may become a useful tool to test tailored therapies.
Acknowledgments
This study was supported in part by the European Community's FP6 EUGENE2 n° LSHM-CT-2004–512013 grant to GS, by the Ministero dell’Istruzione.dell’Universita’ e della Ricerca grant n° 2005060899 to RL and by the EFSD/Servier Programme on Vascular Complications of Type 2 Diabetes 2005 and the Telethon Grant GGP04073 to MF
References
- 1.Taniguchi CM, Emmanuelli B, Kahn CR. Critical nodes in signalling pathways: insights into insulin action. Nat Rev Mol Cell Biol. 2006;7:85–96. doi: 10.1038/nrm1837. [DOI] [PubMed] [Google Scholar]
- 2.Sesti G, Federici M, Hribal ML, Lauro D, Sbraccia P, Lauro R. Defects of the insulin receptor (IRS) system in human metabolic disorders. Faseb J. 2001;15:2099–111. doi: 10.1096/fj.01-0009rev. [DOI] [PubMed] [Google Scholar]
- 3.Almind K, Bjorbaek C, Vestergaard H, Hanset T, Echwald S, Pedersen O. Aminoacid polymorphism of insulin receptor substrate-1 in non-insulin-dependent diabetes mellitus. Lancet. 1993;342:828–32. doi: 10.1016/0140-6736(93)92694-o. [DOI] [PubMed] [Google Scholar]
- 4.Imai Y, Fusco A, Suzuki Y, Lesniak MA, D’Alfonso R, Sesti G, Bertoli A, Lauro R, Accili D, Taylor SI. Variant sequences of IRS-1 in patients with noninsulin-depend-ent diabetes mellitus. J Clln Endocrlnol Metab. 1994;79:1655–8. doi: 10.1210/jcem.79.6.7989470. [DOI] [PubMed] [Google Scholar]
- 5.Almind K, Inoue G, Pedersen O, Kahn CR. A common amino acid polymorphism in insulin receptor substrate-1 causes impaired insulin signaling. Evidence from transgene studies. J Clln Invest. 1996;97:2569–75. doi: 10.1172/JCI118705. [DOI] [PMC free article] [PubMed] [Google Scholar]
- 6.Hribal ML, Federici M, Porzio O Lauro D, Borboni P, Accili D, Lauro R, Sesti G. The Gly–> Arg amino acid polymorphism in insulin receptor substrate-1 affects glucose metabolism in skeletal muscle cells. J Clln Endocrlnol Metab. 2000;85:2004–13. doi: 10.1210/jcem.85.5.6608. [DOI] [PubMed] [Google Scholar]
- 7.Porzio O, Federici M, Hribal ML. Lauro D, Accili D, Lauro R, Borboni P, Sesti G. The Gly 972–> Arg amino acid polymorphism in IRS-1 impairs insulin secretion in pancreatic β cells. J Clln Invest. 1999;104:357–64. doi: 10.1172/JCI5870. [DOI] [PMC free article] [PubMed] [Google Scholar]
- 8.Federici M, Hribal ML, Ranalli M. Marselli L, Porzio O, Lauro D, Borboni P, Lauro R, Marchetti P, Melino P, Sesti G. The common Arg972 polymorphism in insulin receptor substrate-1 causes apop-tosis of human pancreatic islets. FASEB J. 2001;15:22–4. doi: 10.1096/fj.00-0414fje. [DOI] [PubMed] [Google Scholar]
- 9.Federici M, Pandolfi A, De Filippis EA. Pellegrini G, Menghini R, Lauro D, Cardellini M, Romano M, Sesti G, Lauro R, Consoli A. G972R IRS-1 variant impairs insulin regulation of endothelial nitric oxide synthase in cultured human endothelial cells. Circulation. 2004;109:399–405. doi: 10.1161/01.CIR.0000109498.77895.6F. [DOI] [PubMed] [Google Scholar]
- 10.McGettrick AJ, Feeners EP, Kahn CR. Human Insulin Receptor Substrate-1 (IRS-1) Polymorphism G972R Causes IRS-1 to Associate with the Insulin Receptor and Inhibit Receptor Autophosphorylation. J BiolChem. 2005;280:6441–6. doi: 10.1074/jbc.M412300200. [DOI] [PubMed] [Google Scholar]
- 11.Jellema A, Zeegers MP, Feskens EJ, Dagnelie PC, Mensink RP. Gly972Arg variant in the insulin receptor substrate-1 gene and association with Type 2 diabetes: a meta-analysis of 27 studies. Diabetologia. 2003;46:990–5. doi: 10.1007/s00125-003-1126-4. [DOI] [PubMed] [Google Scholar]
- 12.van Dam RM, Hoebee B, Seidell JC, Schaap MM, Blaak EE, Feskens EJ. The insulin receptor substrate-1 Gly972Arg polymorphism is not associated with Type 2 diabetes mellitus in two population-based studies. Diabetes Med. 2004;21:752–8. doi: 10.1111/j.1464-5491.2004.01229.x. [DOI] [PubMed] [Google Scholar]
- 13.Florez JC, Sjogren M, Burtt N, Orho-Melander M, Schayer S, Sun M, Almgren P, Lindblad U, Tuomi T, Gaudet D, Hudson TJ, Daly MJ, Ardlie KG, Hirschhorn JN, Altshuler D, Groop L. Association testing in 9,000 people fails to confirm the association of the insulin receptor substrate-1 G972R polymorphism with type 2 diabetes. Diabetes. 2004;53:3313–8. doi: 10.2337/diabetes.53.12.3313. [DOI] [PubMed] [Google Scholar]
- 14.Laukkanen O, Pihlajamaki J, Lindstrom J, Eriksson J, Valle TT, Hamalainen H, Ilanne-Parikka P, Keinanen-Kiukaanniemi S, Tuomilehto J, Uusitupa M, Laakso M. Common polymorphisms in the genes regulating the early insulin signalling pathway: effects on weight change and the conversion from impaired glucose tolerance to Type 2 diabetes. The Finnish Diabetes Prevention Study. Diabetologia. 2004;47:871–7. doi: 10.1007/s00125-004-1395-6. [DOI] [PubMed] [Google Scholar]
- 15.Lyssenko V, Almgren P, Anevski D. Orho-Melander M, Sjogren M, Saloranta C, Tuomi T, Groop L. Genetic prediction of future type 2 diabetes. Plos Med. 2005;2:e345. doi: 10.1371/journal.pmed.0020345. [DOI] [PMC free article] [PubMed] [Google Scholar]
- 16.Riu E, Mas A, Ferre T, Pujol A, Gros L, Otaegui P, Montoliu L, Bosch F. Counteraction of Type 1 diabetic alterations by engineering skeletal muscle to produce insulin. Insights from transgenic mice. Diabetes. 2002;51:704–11. doi: 10.2337/diabetes.51.3.704. [DOI] [PubMed] [Google Scholar]
- 17.Federici M, Hribal ML, Menghini R, Kanno H, Marchetti V, Porzio O, Sunnarborg SW, Rizza S, Serino M, Console V, Lauro D, Mauriello A, Smookler DS, Sbraccia P, Sesti G, Lee DC, Khokha R, Accili D, Lauro R. Timp3 deficiency in insulin receptor-haploinsufficient mice promotes diabetes and vascular inflammation via increased TNF-α. J Clin Invest. 2005;115:3494–505. doi: 10.1172/JCI26052. [DOI] [PMC free article] [PubMed] [Google Scholar]
- 18.Zisman A. Peroni OD, Abel ED, Michael MD, Mauvais-Jarvis F, Lowell BB, Wojtaszewski JF, Hirshman MF, Virkamaki A, Goodyear LJ, Kahn CR, Kahn BB. Targeted disruption of the glucose transporter 4 selectively in muscle causes insulin resistance and glucose intolerance. Nat. Med. 2000;6:924–8. doi: 10.1038/78693. [DOI] [PubMed] [Google Scholar]
- 19.Okamoto H, Hribal ML, Lin HV, Bennet WR, Ward A, Accili D. Role of the fork-head protein FoxOI in beta cell compensation to insulin resistance. J Clin Invest. 2006;116:775–82. doi: 10.1172/JCI24967. [DOI] [PMC free article] [PubMed] [Google Scholar]
- 20.Hansotia T, Maida A, Flock G, Yamada Y, Tsukiyama K, Seino Y, Drucker DJ. Extrapancreatic incretin receptors modulate glucose homeostasis, body weight, and energy expenditure. J Clin Invest. 2007;117:143–52. doi: 10.1172/JCI25483. [DOI] [PMC free article] [PubMed] [Google Scholar]
- 21.Kulkarni RN, Winnay JN, Daniels M, Briining JC, Flier SN, Hanahan D, Kahn CR. Altered function of insulin receptor substrate-1 deficient mouse islets and cultured β-cell lines. J Clin Invest. 1999;104:R69–75. doi: 10.1172/JCI8339. [DOI] [PMC free article] [PubMed] [Google Scholar]
- 22.Martin TL, Alquier T, Asakura K, Furukawa N, Preitner F, Kahn BB. Diet-induced obesity alters AMP kinase activity in hypothalamus and skeletal muscle. J BiolChem. 2006;281:18933–41. doi: 10.1074/jbc.M512831200. [DOI] [PubMed] [Google Scholar]
- 23.Clausen JO, Hansen T, Bjobaerk C, Echwald SM, Urhammer SA, Rasmussen S, Andersen CB, Hansen L, Almind K, Whinter K, Haraltlsdottir J, Borch-Johnsen K, Pedersen O. Insulin resistance: interactions between obesity and a common variant of insulin receptor substrate-1. Lancet. 1995;346:397–402. doi: 10.1016/s0140-6736(95)92779-4. [DOI] [PubMed] [Google Scholar]
- 24.Baroni MG, Leonetti F, Sentinelli F, Romeo S, Filippi E, Fanelli M, Ribaldo MC, Zappaterreno A, Fallarono M, Di Mario U. The G972R variant of the insulin receptor substrate-1 (I RS-1) gene is associated with insulin resistance in “uncomplicated” obese subjects evaluated by hyper-insulinemic-euglycemic clamp. J Endocrinol Invest. 2004;27:754–9. doi: 10.1007/BF03347518. [DOI] [PubMed] [Google Scholar]
- 25.Hribal ML, Perego L, Cardellini M, Paganelli M, Andreozzi F, Pontiroli A, Folli F, Sesti G. Gene expression profiling in adipose tissue of G972 IRS-1 carriers. Diabetes. 2005;54(Suppl.1):A270. [Google Scholar]
- 26.Sesti G, Marini MA, Cardellini M, Sciacqua A, Frontoni S, Andreozzi F, Irace C, Lauro D, Gnasso A, Federici M, Perticone, Lauro R. The Arg972 variant in insulin receptor substrate-1 is associated with an increasing risk of secondary failure to sulfonylurea in patients with type 2 diabetes. Diabetes Care. 2004;27:1394–8. doi: 10.2337/diacare.27.6.1394. [DOI] [PubMed] [Google Scholar]
- 27.Tschritter O, Preissl H, Hennige AM, Stumvoll M, Porubska K, Frost R, Marx H, Klosel B, Lutzenberger W, Birbaumer N, Haring HU, Fritsche A. The cerebrocor-tical response to hyperinsulinemia is reduced in overweight humans: a magne-toencephalographic study. Proc Natl Acad Sci USA. 2006;103:12103–8. doi: 10.1073/pnas.0604404103. [DOI] [PMC free article] [PubMed] [Google Scholar]
- 28.Woodcock J. The prospects for “personalized medicine” in drug development and drug therapy. Clin Pharmacol Ther. 2007;81:164–9. doi: 10.1038/sj.clpt.6100063. [DOI] [PubMed] [Google Scholar]