

SUMMARY
Missense mutations in p53 generate aberrant proteins with abrogated tumor suppressor functions that can also acquire oncogenic gain-of-functions (GOF) that promote malignant progression, invasion, metastasis and chemoresistance1–5. Mutant p53 (mutp53) proteins undergo massive constitutive stabilization specifically in tumors, which is the key requisite for GOF6–8. Although currently 11 million patients worldwide live with tumors expressing highly stabilized mutp53, it is unknown whether mutp53 is a therapeutic target in vivo.
Here we use a novel mutp53 mouse model expressing an inactivatible R248Q hotspot mutation (floxQ) to show that tumors depend on sustained mutp53 expression. Upon Tamoxifen-induced mutp53 ablation, allo-transplanted and autochthonous tumors curb their growth, thus extending animal survival by 37%, and advanced tumors undergo apoptosis and tumor regression or stagnation.
The HSP90/HDAC6 chaperone machinery, which is significantly upregulated in cancer compared to normal tissues, is a major determinant of mutp53 stabilization9–12. We show that long-term HSP90 inhibition significantly extends the survival of mutp53 Q/−2 and H/H (R172H allele3) mice by 59% and 48%, respectively, but not their respective p53−/− littermates. This mutp53-dependent drug effect occurs in H/H mice treated with 17DMAG+SAHA and in H/H and Q/− mice treated with the potent Hsp90 inhibitor ganetespib. Notably, drug activity correlates with induction of mutp53 degradation, tumor apoptosis and prevention of T-lymphomagenesis. These proof-of-principle data identify mutp53 as an actionable cancer-specific drug target.
Tumor-promoting GOF activities of missense mutp53 alleles are demonstrated by knockin (KI) mouse models1–5 and in Li-Fraumeni (LFS) patients carrying germline TP53 missense mutations. LFS patients with TP53 missense mutations have earlier cancer onset than patients with loss of p53 expression13,14. Strikingly, p53R248Q/+ LFS patients have higher tumor numbers and shorter tumor-free survival by 10.5 yrs than p53null/+ patients2. A key feature and prerequisite for GOF is that mutp53 proteins undergo massive stabilization specifically in tumors6–8.
RNAi-mediated depletion of mutp53 produces marked cytotoxic effects in human cancer cells in culture and xenograft models15. Notably, mutp53 knockdown in orthotopic allografts of KrasG12D pancreatic murine cancer cells dramatically reduced their metastatic ability16. Together, this provides a strong rationale for testing mutp53-destabilizing cancer therapy in vivo. If confirmed, it might establish mutp53 as an important direct drug target in many cancer patients. To rigorously validate this, we generated conditional inactivatable p53 R248Q (floxQ) mice (Extended Fig. 1a–c) with a Rosa26CreERT2 (ERT2) knockin allele, which mirror the constitutive Q mice2 in tumor spectrum and survival (Extended Fig. 1d). Tamoxifen/4OHT treatment activates CreERT2, causing deletion of the floxQ allele (with up to 90% efficiency) and cell death in primary T-lymphoma cultures, but not in various controls (Fig. 1a, Extended Fig. 1e). Likewise, transplantation assays into immunocompromised hosts (subcutaneous and tail vein allografts, prophylactic and therapeutic treatments) showed that floxQ deletion markedly inhibited tumor growth in vivo (Fig. 1a–d, Extended Fig. 1f–h) and prolonged survival of recipients compared to controls (Fig. 1b, Extended Fig. 1f). These data strongly suggest tumor dependence on sustained high levels of mutp53.
Figure 1. Genetic ablation of mutp53 curbs tumor growth in allografts.

a–d, Various prophylactic (a, b) and therapeutic (c, d) protocols of primary floxQ/− vs Q/− and p53-null T-lymphomas allotransplanted (black arrows on time axes) via subcutaneous (a, c, d) or tail vein (b) injections into nude mice, treated with daily intraperitoneal injections of Tamoxifen or oil (* on time axes). (a) Experimental diagram, allograft mass, representative tissue immunostaining and immunoblot at endpoint. Unpaired two-tailed Student’s t-test; mean ± s.e.m; n, number of allografts. (b) mutp53 deletion improves survival of host mice. Kaplan-Meier analysis, Log Rank test; n, number of mice. (c) Two different therapeutic protocols (100 mg/kg Tam for 5 days vs 150 mg/kg for 7 days) show the dose-dependence of allograft growth on mutp53 depletion. Unpaired two-tailed Student’s t-test; mean ± s.e.m; n, number of allografts. (d) Allograft growth using therapeutic protocol (Fig. 1c, Endpoint 2) and mean fold changes at endpoint; n, number of allografts.
Importantly, clinically advanced autochthonous tumors in floxQ/− mice responded to mutp53 ablation with regression or stagnation (Fig. 2a–c, Extended Fig. 2a). Mechanistically, this was due to marked tumor apoptosis (Fig. 2d), but not cell cycle arrest (Extended Fig. 2b). Notably, mutp53 ablation was also associated with strong suppression of lung metastasis, contrasting with large metastatic nodules in controls (Fig. 2e). Moreover, mutp53 ablation in floxQ/− mice with early disease (10 wks old) (Fig. 2f) extended median overall and T-lymphoma-specific survival by 37% from 128 to 175 days (Fig. 2g, Extended Fig. 2c). Notably, the improved overall survival of floxQ/− mice, which normally have a significantly shorter lifespan than p53-null littermates2 (Extended Fig. 1d), now resembled that of p53-null mice (Extended Fig. 2d), while their T-lymphoma specific survival now extended beyond that of p53-null mice (Extended Fig. 2e). This further indicates that tumors driven by mutp53 depend on stabilized mutp53. In support, at endpoint (death), most tumors of all types (17/23, 74%) from floxQ/− mice that were Tamoxifen-treated at 10 wks were again composed of 100% mutp53-overexpressing cells (Fig. 2h, Extended Fig. 2f). This indicates strong selective pressure for the small minority of non-recombined mutp53-positive cells outcompeting the majority of recombined cells. It is tempting to speculate that complete allele removal would have further improved survival. Thus, these data establish for the first time that continued expression of stabilized mutp53 is essential for tumor maintenance in vivo.
Figure 2. Mutp53 ablation in floxQ/− mice causes autochthonous tumor regression or stagnation and extends survival.

(a) Fold growth over time until endpoint of clinically advanced tumors in floxQ/−;ERT2/+ mice imaged by ultrasound and treated with Tamoxifen (Tam) or oil (beginning at day 0, arrowhead); normalized to initial tumor size. (b) Daily growth rates of individual tumors during the first 5–12 days of Tam/oil treatment (left), and mean ± s.e.m. of all tumors (right). Unpaired two-tailed Student’s t-test. #, sarcomas; all others are T-lymphomas. (c) Representative examples of sagittal ultrasound images of T-lymphomas in Tam-treated floxQ/−;ERT2/+ and control mice. (d) Genetic ablation of mutp53 in autochthonous tumors induces apoptosis. Immunostaining for mutp53 and cleaved caspase 3 in representative control and mutp53-ablated T-lymphomas. (e) Lung metastasis in these mice by H&E and p53 immunostaining. (f) Organ-confined disease in young floxQ/− mice indicated by p53 immunostaining of malignant thymic cell clones. (g) Kaplan-Meier analysis comparing cancer-related overall survival of floxQ/−;ERT2/+ vs Q/−;ERT2/+ and p53−/−;ERT2/+ mice. Animals were treated once (arrow) at 10 wks with Tam or oil for 5 consecutive days. (h) p53 immunostaining at endpoint (death) of representative T-lymphomas (see also Extended Fig. 2f).
The HSP90 chaperone machinery is highly activated in cancers compared to normal tissues and renders them resistant to proteotoxic stress by supporting proper folding of conformationally aberrant oncoproteins including mutp5317,18. Thus, cancer cells have a far smaller tolerance for HSP90 inhibition. We and others previously showed that HSP90 and its obligatory positive regulator, cytosolic HDAC6, are major determinants of mutp53 stabilization9–12. Importantly, deletion of HSF1, the master transcriptional activator of the inducible heat shock response including HSP90, dramatically suppresses oncogenicity in mutp53 H/+ mice, but has no effect in p53-null mice19,20. These data clearly indicate that tumorigenicity of the H allele - but not of p53-null - strongly depends on Hsf1-mediated chaperone support, mainly HSP90. 17AAG and its hydrophilic derivative 17DMAG are ansamycin-derived highly specific first generation Hsp90 inhibitors (Hsp90i)17. Likewise, histone deacetylase inhibitors (HDACi), including FDA-approved SAHA, are promising anti-cancer drugs whose actions involve hyperacetylation of histone and select non-histone targets including HDAC6 substrate Hsp90, thus indirectly inhibiting Hsp9021.
The cytotoxicity of 17AAG/SAHA in mutp53 cancer cells, despite being pleiotropic drugs, is largely due to the destabilization of mutp53 protein via Hsp90/HDAC6 inhibition11,12. Moreover, due to complementary drug targets 17AAG/SAHA treatment caused synergistic cytotoxicity in human breast cancer cells compared to monotherapy11. Likewise, 17AAG and SAHA synergized in T47D (p53L194F) xenografts in vivo (Extended Fig. 3). SAHA or 17AAG alone were effective in blocking tumor growth of parental MDA231 (p53R280K) cells, but lost their efficacy when excess ectopic mutp53 was present. Only the combination of both drugs overcame this block (Fig. 3a). To translate the genetic proof-of-principle results from floxQ/− mice (Figs. 1, 2) towards clinical application, we performed long-term treatments with 17DMAG+SAHA in mutp53R172H (H) mice3. Starting at 8 wks when most H/H mice exhibited early intrathymic T-lymphoma (Fig. 3b), H/H and p53-null mice were treated life-long with 17DMAG+SAHA vs vehicles. Strikingly, HSP90 inhibition benefited only H/H but not p53-null mice, extending their overall survival from a median 140 to 182 days (p<0.001, Fig. 3c). Moreover, drug treatment improved survival of H/H mice beyond that of p53-null mice (Fig. 3d). For T-lymphoma-specific survival, again only H/H but not p53-null controls benefited from 17DMAG+SAHA treatment (p<0.001, Fig. 3e). These data strongly support that tumors expressing mutp53 depend on its presence and fundamentally differ in their oncogenic wiring from p53-null tumors. Moreover, the mechanism of action of these pleiotropic HSP90 inhibitors is mutp53-dependent.
Figure 3. Pharmacological inhibition of the mutp53 stabilizing HSP90/HDAC6 axis with 17DMAG+SAHA prolongs survival of H/H mice in a mutp53-dependent manner.

(a) 17AAG and SAHA synergize in degrading mutp53 and suppressing growth of subcutaneous xenografts of MDA231 cells expressing excess ectopic p53R280K. Mean ± s.e.m; n, number of xenografts, unpaired one-tailed Student’s t-test. (b) Organ-confined disease in young H/H mice, indicated by p53 immunostaining of malignant thymic cell clones. (c–e) cancer-related overall survival (c, d) and T-lymphoma specific survival (e) of 17DMAG+SAHA treated mutp53 H/H and p53-null mice, Kaplan-Meier analyses, Log Rank statistics. (f) Immunoblot of p53 and Hsp70 in thymic tissues at endpoint from mice shown in (e), each lane represents a different vehicle- or drug-treated mouse. (g) Real-time qRT-PCR analysis of NQO1 in representative responder and escaper H/H T-lymphomas from (f).
Analysis of vehicle- and drug-treated thymic tissues at death for evidence of drug activity showed HSP90i activity (marked by transient induction of HSF1 target Hsp7022), but this did not significantly prevent tumors in p53-null mice (Fig. 3f). In contrast, in H/H mice, when the drug worked (Hsp70 induced, mutp53 undetectable) it apparently prevented T-lymphoma formation in every case since we found only normal thymic tissues (Fig. 3f, ‘p53H/H normal thymus’ mice #7–14, plus 12 mice analyzed by autopsy). In contrast, in all 6 T-lymphomas that arose despite drug treatment, the drugs failed to inhibit HSP90 (Hsp70 not induced) (Fig. 3f, 6/26 (23%) escapers). Mechanistically, NQO1 (NAD(P)H:quinone oxido-reductase) is required to activate 17DMAG by metabolizing its quinone moiety, and NQO1 downregulation is a predictive biomarker for resistance to this ansamycin class of Hsp90i23,24. Indeed, we observed reduced NQO1 expression in escaper versus responder T-lymphomas (Fig. 3g). In sum, HSP90 inhibition prevented the development of T-lymphomas in mutp53 mice.
To reduce complexity and dosing of the combinatorial anti-HSP90 treatment, we eliminated HDAC inhibition and replaced 17DMAG with the highly potent synthetic Hsp90i ganetespib. Ganetespib has demonstrated a favorable safety profile in more than 1200 cancer patients treated to date, and is currently being evaluated in 11 clinical trials including a Phase 3 lung cancer trial (www.syntapharma.com)25,26. On a molar basis, ganetespib is >50-fold more potent than 17AAG in degrading mutp53 and killing mutp53 cancer cells (Extended Fig. 4a–c). Moreover, ganetespib destabilized mutp53 but not wildtype p53 in human tumor cells and xenografts (Extended Fig. 4d–f). Ganetespib also induced significantly more apoptosis in Q/− vs p53-null T-lymphoma cells (Extended Fig. 4g, h). Likewise, ganetespib strongly suppressed tumor growth in allografts of Q/− T- and B-lymphomas treated with prophylactic and therapeutic protocols (Fig. 4a, b, Extended Fig. 4i, j). Notably, this in vivo drug effect, marked by Hsp70 induction, correlated perfectly with mutp53 destabilization and induction of apoptosis within 24h upon repeated dosing (Fig. 4c, d). Moreover, ganetespib synergized with conventional chemotherapy like cyclophosphamide (Fig. 4e, Extended Fig. 4k).
Figure 4. Treatment of H/H and Q/− mice with ganetespib suppresses tumor growth and extends survival in a mutp53-dependent manner.

(a, b) Prophylactic (a) and therapeutic (b) treatment of subcutaneous Q/− allografts with ganetespib or vehicle (DMSO). (a) Arrowhead, tumor cell injection. (b) Initial allograft volume and mass at endpoint, mean ± s.e.m, unpaired two-tailed Student’s t-test; n, number of allografts. (c, d) Time-course of mutp53 levels and apoptosis (cleaved caspase 3) in ganetespib-treated (arrows) Q/− subcutaneous T-lymphoma allografts, analyzed by immunoblot (c) and immunostaining (d). Asterisks mark non-specific bands. Enlarged panels after the 1st and 2nd doses (d, far right) immunostained for p53 (arrows), dead cells stain blue. (e) Growth of subcutaneous Q/− T-lymphoma allografts treated once (arrow) with ganetespib or cyclophosphamide alone or in combination. Mean ± s.e.m, unpaired two-tailed Student’s t-test; n, number of allografts, * p<0.05, ** p<0.01 (single drugs vs combination). (f–h) Kaplan-Meier analysis of cancer-related overall survival (f, g) and T-lymphoma specific survival (h) of mutp53 H/H, Q/− and their respective p53−/− controls. (i) Fold growth over time of clinically advanced Q/− and p53−/− T-lymphomas imaged by ultrasound and treated with ganetespib; normalized to initial tumor size. Mean ± s.e.m, unpaired two-tailed Student’s t-test; n, number of tumors, * p<0.05. (j) Comparison of overall survival of ganetespib-treated mutp53 H/H and their respective p53−/− controls, shown in (f). (k, l) Immunoblot analysis of thymic tissues from same-litter siblings (k) and from Q/− mice from (h) at endpoint. Each lane represents individual DMSO or ganetespib-treated mice.
Encouraged by these data, we performed long-term treatments of early disease (8 wks) H/H and Q/− (Fig. 2f, 3b) vs their respective p53−/− controls (note, they differ in genetic background2,3,27,28) with one weekly dose of ganetespib (50 mg/kg) or vehicle lifelong. Strikingly, ganetespib benefited only mutp53 mice, representing a structural mutant (H allele) and a DNA-contact mutant (Q allele), but not p53-null mice, extending median overall survival of H/H mice from 157 to 233 days (48%, Fig. 4f) and Q/− mice from 146 to 232 days (59%, Fig. 4g). Q/− T-lymphoma-specific survival was also greatly extended (Fig. 4h). Importantly, clinically advanced autochthonous tumors in Q/− mice responded to ganetespib with regression or stagnation (Fig. 4i). H/H mice, whose lifespan is normally identical to p53-null mice7, responded to ganetespib with improved survival beyond p53-null controls (Fig. 4j), whereas Q/− mice, whose lifespan is significantly shorter than p53-nulls2 (Extended Fig. 1d), showed improved survival now resembling p53-nulls (Extended Fig. 4l). The fact that ganetespib and genetic mutp53 removal (Extended Fig. 2d) both cause floxQ/− survival to overlap with p53-null mice supports that ganetespib targets mutp53. However, ganetespib improved survival more efficiently than genetic mutp53 ablation (Extended Fig. 4m), likely due to persistent destabilization of mutp53 as compared to incomplete genetic ablation at 10 wks. Other tumor-promoting Hsp90 clients might also be inhibited by ganetespib, contributing to the difference. Overall, these data indicate that the effect of ganetespib is largely due to targeting mutp53, as it had no effect in p53-null mice (Fig. 4f, g). Moreover, consistent with superior potency of ganetespib vs 17DMAG+SAHA, weekly ganetespib monotherapy improved overall survival more efficiently than near-daily 17DMAG+SAHA therapy (Extended Fig. 4n).
Ganetespib treatment also correlated with absence of T-lymphomas in 2 of 2 Q/− sibling pairs, while DMSO-treated siblings exhibited large T-lymphomas (Fig. 4k). Finally, thymic tissues of Q/− mice analyzed at death again showed that when HSP90 inhibition was achieved (Hsp70 induced), mutp53 T-lymphomagenesis was prevented (Fig. 4l), while all 5 T-lymphomas that arose despite ganetespib again showed no evidence of drug activity (no Hsp70 induction) (Fig. 4l, 5/23 (22%) escapers). In colorectal cancers we recently identified a major resistance mechanism for ganetespib (but not other classes of Hsp90i) via upregulation of the drug-conjugating enzyme UGT1A in tumor cells, causing drug efflux and tumor protection29. However, in mutp53 T-lymphomas UGT1A (mRNA and protein) did not correlate with ganetespib resistance, necessitating future genomic analysis to identify alternative mechanisms. Overall, these data indicate tumor dependence on high levels of mutp53 and demonstrate mutp53-dependent drug effects.
Missense mutp53 is highly expressed in 40–50% of all human tumors. One therapeutic strategy considered for nearly two decades is to develop small compounds capable of restoring the lost wildtype function of mutp53 proteins30. In the face of this daunting and still elusive goal, the results presented here show that eliminating stabilized mutp53 protein can have positive therapeutic effects in vivo, even in the absence of wildtype p53, since such tumors show exploitable dependence on its GOF. Targeting HSP90 represents the first and currently only viable clinical strategy to achieve this goal.
Methods
Generation of floxQ;ERT2 mice
The floxed HUPKI p53R248Q allele (referred to as floxQ) was generated by introducing loxP sites flanking exons 2 through 10 of the p53 locus where mouse exons 4–9 were replaced with human exons 4–9 containing a p53 R248Q mutation in Exon 7, as described in Extended Fig. 1a–c. p53floxQ/+ were crossed with p53−/− mice on a 129SvImJ/C57Bl6J mixed background as previously described2 to generate p53floxQ/− animals. p53floxQ/− animals were then intercrossed with p53Q/− animals (previously described in Hanel et al., 20132) to generate p53floxQ/Q mice on a 129SvImJ/C57Bl6J background. Rosa26CreERT2/CreERT2 mice (referred to as ERT2) on a pure C57Bl6J background31 were purchased from Jackson labs (stock # 008463) and intercrossed with the mixed p53−/− animals to generate p53−/−; Rosa26ERT2/ERT2 mice. p53−/−; Rosa26ERT2/ERT2 were intercrossed with p53floxQ/Q or p53−/− to generate the p53floxQ/−; Rosa26ERT2/+, p53Q/−; Rosa26ERT2/+, and p53−/−; Rosa26ERT2/+ cohorts.
mutp53 knockin mice for long-term drug studies
p53R172H/R172H mice (referred to as H/H) and their corresponding p53−/− controls on a pure C57Bl6J background were previously described3,27. HUPKI p53R248Q/− mice (referred to as Q/−) and their corresponding p53−/− controls on a 129SvImJ/C57Bl6J mixed background were also previously described2,28. Note that two different p53−/− control strains were used as corresponding genetic background-matching controls for H/H mice (pure C57BL/6J background) versus Q/− mice (mixed 129SvImJ/C57Bl6J background). Mice were monitored twice weekly and euthanized when animals appeared moribund or the largest palpable tumor reached 2 cm3 or ulcerated. Males and females were used at 1:1 ratio (except for Nu/Nu mice, only males were used). According to Stony Brook University Institutional Animal Care and Use Committee (IACUC) guidelines and our approved protocol, the maximum tumor burden per mouse is 4 cm3, which was strictly followed in all experiments. Time of euthanasia was considered endpoint. All animals were treated humanely and according to the guidelines by the IACUC of Stony Brook University.
Lymphoma cell isolation and allograft transplants
Primary T-lymphoma cells were isolated by mechanically mincing T-lymphoma tumors with a razor blade for 1 min, followed by 5 min incubation with 5 ml Red Blood Cell (RBC) lysis buffer at room temperature. 5 ml Lymphoma medium (1:1 DMEM/IMDM supplemented with 10% FBS, L-glutamine, Penicillin/Streptomycin, Antibiotic/Antimycotic, β-mercaptoethanol) (all from Gibco) was added and cells were passed through a 40 µm Nylon cell strainer (Falcon) to remove cell clumps. Cells were spun down and resuspended in Lymphoma medium. Primary B-lymphoma cells were isolated similarly, except for the addition of 100 µl of 3M sodium acetate during mincing to prevent blood coagulation and a second round of RBC/ Lymphoma medium /spinning. Freshly isolated live B- and T-lymphoma cells were counted and either frozen or immediately used for in vitro studies or transplantations (allografts). For subcutaneous (s.c.) transplantation, 6–7 wks old Nu/Nu males (Harlan, strain Hsd:Athymic Nude-Foxn1nu) were injected into four dorsal sites with 105 lymphoma cells per site suspended in 3:1 PBS/Matrigel (BD Biosciences). For intravenous (i.v.) tail vein injections, 105 cells in PBS were injected per Nu/Nu recipient.
Removal of the conditional floxQ allele
To remove the floxQ allele in cells in vitro, T-lymphoma cells (15×106 live cells per 6 cm dish) grown in Lymphoma medium were treated with 1 µM 4-hydroxytamoxifen (4OHT, Sigma Cat # H7904) in EtOH for the times indicated in Extended Fig. 1e.
To remove the floxQ allele in T-lymphoma allografts, randomly assigned mice were injected intraperitoneally (i.p.) with 100 mg/kg or 150 mg/kg Tamoxifen (Sigma Cat # T5648) in corn oil, or with corn oil alone, as indicated in Fig. 1 and Extended Fig. 1. For the prophylactic protocol typically 9 daily i.p. injections beginning 2 days prior to lymphoma cell transplantation were given. For the therapeutic protocol 5 to 7 daily i.p. injections were given after at least two out of four palpable tumors had appeared.
For autochthonous tumors, to remove the floxQ allele in mice with early organ-confined disease, randomly assigned 10 wk old animals were injected i.p. with 100 mg/kg Tamoxifen in corn oil, or corn oil alone, daily for 5 consecutive days (Fig. 2f–h, Extended Fig. 2c–f). As a pre-set criterion, animals that died from non-cancer-related causes (the minority) were excluded from subsequent analyses. To treat clinically advanced tumors (Fig. 2a–e), animals were monitored weekly by ultrasound imaging using the Visual Sonics Vevo 770 High-Resolution Imaging System. When tumors had reached 150 mm3 on average (ranging from 86–218 mm3), mice were injected with 150 mg/kg Tamoxifen daily for 7 days, followed by 100 mg/kg three times a week, or oil alone, until they needed to be sacrificed (endpoint). To follow the response in vivo, tumors were imaged weekly by ultrasound and tumor volume was calculated using the Vevo 770 V3.0.0 software.
Hsp90 inhibitor studies
HSP90 is crucial for cancer cell survival32. Cultured cells were treated with 2.5 µM or 5 µM 17AAG (17-allylamino-17-demethoxygeldanamycin, LC Laboratories, Cat # A-6880) or 5-500 nM ganetespib in DMSO for 24h or 48h. For xenografts, human cancer cells were subcutaneously injected into nude mice (0.5 Mio cells per site in 100 µl Matrigel, 4 sites per mouse). Tumors became visible around day 10. For Fig. 3a and Extended Fig. 3, treatment of 10 mg/kg 17AAG and/or 25mg/kg SAHA (Vorinostat / Suberoylanilide hydroxamic acid, LC Laboratories, Cat # V-8477) in DMSO or vehicle control was started at day 24 every other day, with endpoint at day 44 or earlier in the few cases where tumors became ulcerated.
For 17DMAG+SAHA treatments of H/H and corresponding p53−/− mice, 17DMAG (17-Dimethylaminoethylamino-17-demethoxygeldanamycin, LC Laboratories Cat # D-3440), a hydrophilic derivative of 17AAG33, was dissolved in 5% (weight/vol) Hydroxypropyl-β-cyclodextrin (HOP-β-CD) (Sigma Cat # 332607), and SAHA (LC Laboratories Cat # V-8477) was dissolved in a 5 molar equivalent of HOP-β-CD as previously described34. Equal volumes of 17DMAG and SAHA (or both vehicle solutions) were combined and frozen in aliquots until use. Starting at 8 wks of age, randomly assigned animals received 100 µl i.p. injections of 10 mg/kg 17DMAG plus 25 mg/kg SAHA, or 100 µL HOP-β-CD vehicle, for 5 days a week until endpoint (death). As a pre-set criterion, animals that died from non-cancer-related causes (the minority) were excluded from subsequent analyses.
For ganetespib treatments of H/H and Q/− mice with their corresponding p53−/− control cohorts, ganetespib (aka STA-9090, Synta Pharmaceuticals) was dissolved in 10% DMSO/18% cremophor/3.6% dextrose (‘10/18 DRD’) as previously described35. For reference, rodents safely tolerate doses of ganetespib of up to 150 mg/kg once weekly or 75 mg/kg twice weekly36. Randomly assigned animals received freshly prepared ganetespib or the corresponding volume of 10/18 DRD vehicle by tail vein injection as follows: 50 mg/kg ganetespib once a week starting at 8 wks of age until death for the treatment of autochthonous tumors (including the sibling analysis in Fig. 4j); 75 mg/kg ganetespib twice a week for the treatment of T- and B-lymphoma allografts (beginning 1 day prior to lymphoma transplantation in the prophylactic protocol, or beginning when at least 2 out of 4 palpable tumors per mouse had appeared in the therapeutic protocol); 150 mg/kg of ganetespib once or twice for acute high dose treatment (Fig. 4c, d). As a pre-set criterion, animals that died from non-cancer-related causes (the minority) were excluded from subsequent analyses. For the sibling analysis (Fig. 4j), the sisters were sacrificed at 90 days and the brothers at 148 days, each 24 hrs after their last treatment, and their thymic tissues were subject to immunoblot analysis. Cyclophosphamide was dissolved in PBS and injected i.p. at indicated doses.
Human cancer cell lines
Breast cancer MDA231 (p53R280K, Cat # HTB-26), MDA468 (p53R273K, Cat # HTB-132), T47D (p53L194F, Cat # HTB-133), SKBR3 (p53R175H, Cat # HTB-30), prostate cancer DU145 (p53P223L and V274F, Cat # HTB-81), non-small cell lung cancer H1975 (R273H, Cat # CRL-5908), and ovarian cancer cell line ES2 (p53S241F, Cat # CRL-1978) were purchased from ATCC (American Type Culture Collection). The ovarian cancer lines EFO21 (p53C124R, Cat # ACC-235) and COLO704 (p53wt, Cat # ACC-198) were purchased from DSMZ (Deutsche Sammlung von Mikroorganismen und Zellkulturen). The ovarian cancer cell line COV434 (p53wt) was purchased from Sigma-Aldrich (Cat # 07071909). The ovarian cancer cell line HOC7 (p53C275F) was a gift from Prof. Nicole Concin from the University of Innsbruck, Austria. Paired parental MDA231 and MDA231+R280K cells stably overexpressing pcDNA3 vector or pcDNA3-p53R280K plasmids, respectively, were generated by transfection and selection. All cells were cultured in DMEM/10% FCS and tested negative for mycoplasm.
Cell death was determined by Cell Titer-Blue Cell Viability Assay (Promega Cat # G808A) according to manufacturer’ s instructions, in 6-well plate format with 5 Mio lymphoma cells/well or 150,000 human cancer cells/well. Cells were treated as indicated and fluorescence was detected by FILTERmax F5 (Molecular Devices). Trypan Blue exclusion assays were done by direct manual counting of transparent (live) cells in a hemocytometer and normalizing counts to vehicle control.
Immunohistochemistry and immunoblot analysis
For immunohistochemical analysis, tumors were fixed in formalin, embedded in paraffin and sectioned (5µm). Slides were deparaffinized and boiled in citrate buffer (10 mM, pH 6.0, 35 min) for antigen retrieval, blocked in 10% goat serum and incubated with primary antibodies (mutp53, Santa Cruz FL393, Cat # sc-6243, 1:500; cleaved caspase 3, Cell Signaling Cat # 9661, 1:500; phosphor-S28 histone H3, Abcam Cat # ab32388, 1:300) for 2 hrs at room temperature. After PBS washing, slides were incubated with biotinylated secondary antibody and HRP-Streptavidin using the Histostain SP Broad Spectrum kit (Invitrogen Cat # 959943B), stained with DAB substrate with hematoxylin counterstain and coverslipped. Immunoblots were performed using 20 µg of total protein extract from tumors or tumor cells with the following antibodies: mutp53 (FL-393, Santa Cruz, sc-6243; DO1, Santa Cruz # sc-126), Hsp70 (Enzo Cat # C92F3A-5), PARP (Cell Signaling Cat # 9542), cleaved PARP (Cell Signaling Cat # 9541), cleaved caspase 3 (Cell Signaling Cat # 9661), Chk1 (Cell Signaling Cat # 2360), CDK1 (Millipore Cat # MAB8878), MAPK (Millipore Cat # 05-157), actin (Thermo Scientific Cat # MS-1295-P0), Hsc70 (Santa Cruz, sc-7298), GAPDH (Santa Cruz, sc-25778).
qPCR analysis
Total RNA was isolated using Trizol reagent (Invitrogen) and 2 µg was reverse-transcribed with random primers and SuperScript II Reverse Transcriptase (Invitrogen Cat # 18064-014). Real-time qRT-PCR was performed in duplicates with QuantiTect SYBR Green Mix (Qiagen Cat # 204143) using the MJ Research DNA Engine Opticon 2 machine. Primers for mouse NQO1 were: 5’ TGGCCGAACACAAGAAGCTG 3’ (forward), 5’ GCTACGAGCACTCTCTCAAACC 3’ (reverse). NQO1 expression was normalized to the housekeeping gene HPRT.
Statistics
Statistical tests with appropriate underlying assumptions on data distribution and variance characteristics were used. Kaplan-Meier analyses with Log Rank statistics for animal survival curves were generated using SigmaPlot-Systat Software version 11. Note: in Fig. 3e and Fig. 4h dots represent censored animals, i.e. mice dead due to cancer types other than T-lymphomas. Each line ends when the last animal dies (if due to T-lymphoma, the line goes down to zero, if due to another cancer type, the animal is censored and the line stops with a dot).
Unpaired two-tailed Student’s t-test was used to analyze tumor measurements. No statistical method was used to predetermine sample size. No blinding was used.
Extended Data
Extended Data Figure 1. Generation and characterization of the conditionally inactivatable p53 flox R248Q allele.

a–c, Generation of the conditionally inactivatable p53 R248Qflox allele. Mouse Exons 4–9 were replaced with human Exons 4–9 (called HUPKI, humanized p53 knockin) containing a p53 R248Q mutation in Exon 7 (marked by *). Exons 2–10 were flanked with loxP sites in Introns 1 and 10 (red arrows) to allow for Cre-targeted removal of the mutp53 allele upon addition of Tamoxifen/4OHT. A deletable Neo selection box was flanked by FRT sites (green). Knockin mice were mated with FLP mice to delete the Neo cassette in vivo, leaving behind the distal loxP site. The ‘floxQ’ allele thus has two loxP sites for subsequent Cre deletion. (b) For genotyping, the Neo-deleted floxQ knockin (KI) allele produces a 657 bp amplicon, in contrast to the 490 bp amplicon derived from the wtp53 allele. (c) Normal mouse embryo fibroblasts (MEFs) from floxQ/− embryos, which as non-malignant cells express non-stabilized mutp53, were adenovirally infected with empty vector (-Cre) or Cre-expressing vector (+Cre). Cre-mediated deletion of the mutp53 allele was confirmed by immunoblot analysis.
d, The floxQ and constitutive Q (‘Q’) alleles behave identically in all aspects of gain-of-function including overall survival and tumor spectrum (not shown). Both floxQ and Q mice predominantly develop aggressive T-lymphomas, with some additional B-lymphomas and sarcomas. Also, the RosaCreERT2 allele has no discernable impact (data not shown). Kaplan-Meier analysis comparing overall survival of floxQ/− (red), Q/− (blue) and p53−/− (black) mice. Significance was assessed by Log Rank and Wilcoxon tests.
e, Deletion of the mutp53 allele induces cell death in vitro. Viability of primary T- lymphoma cells freshly harvested from floxQ/−;ERT2/+ mice (n=4) and Q/−;ERT2/+ control mice (n=3), untreated or treated once with 4OHT or vehicle (EtOH) in short-term culture for 3–6 days. CTB assay, unpaired two-tailed Student’s t-test; mean ± s.e.m; n, number of independent T-lymphomas. Bottom, corresponding immunoblots of representative T-lymphomas at day 6.
f, mutp53 deletion improves survival of host mice. Therapeutic protocol with primary floxQ/− T-lymphomas allotransplanted (black arrow on time axis) via subcutaneous injections into SCID mice. After visible tumors appeared, SCID mice were treated with daily intraperitoneal injections of oil or Tamoxifen (* on time axis). Mice were sacrificed when allowable endpoint size (1.5 cm3) was reached. Kaplan-Meier analysis, Log Rank test. Tamoxifen-induced allele deletion was strong but incomplete, shown by representative p53 immunofluorescence staining of tumors at endpoint (DAPI counterstain).
g, Initial tumor volumes measured before treatment was started in the therapeutic protocol of the various groups shown in Fig. 1c. Unpaired two-tailed Student’s t-test; mean ± s.e.m; n, number of allografts.
h, Control for Fig. 1d. Therapeutic treatment of nude mice allografted with p53−/−;ERT2/+ T-lymphoma cells and treated with Tam (150 mg/kg for 7 days) as indicated in the scheme in Fig. 1c (Endpoint 2). No response to Tam. Time-course, initial allograft volume and tumor mass at endpoint. Unpaired two-tailed Student’s t-test; mean ± s.e.m; n, number of allografts; NS, not significant.
Extended Data Figure 2. Mutp53 ablation in floxQ/- mice causes autochthonous tumors regression or stagnation and extends T-lymphoma-specific survival.

a, Time-course of imaged tumors, normalized to their initial tumor size (same as Fig. 2a but zoomed into the first 12 days of treatment). Stagnation or regression of floxQ/−;ERT2/+ tumors treated with Tam, in contrast to treated control tumors (floxQ/−;ERT2/+ on oil and Q/−;ERT2/+ on Tam) which grow robustly. #, sarcomas; all others are T-lymphomas.
b, Similar mitotic index supports that cell cycle arrest and senescence are not significantly affected upon genetic mutp53 ablation in autochthonous T-lymphomas (from Fig. 2a–c) and s.c. allografts (from Fig. 1c, d). Instead, apoptosis is the main mechanism of tumor regression/stagnation. Quantification of phospho-S28 histone H3 (pH3) positive cells in individual autochthonous tumors or allografts. Five (left) or three (right) random 40× high power fields (with no or only minimal apoptosis) were counted for each tumor. Plotted are mean ± s.d. Representative pH3 immunostainings are shown.
c–e, Kaplan-Meier analyses comparing Tamoxifen-treated T-lymphoma specific survival (c, e) and overall (d) survival of floxQ/−;ERT2/+ mice vs constitutive Q/−;ERT2/+ and p53−/−;ERT2/+ control mice from Fig. 2g. Animals were treated once (arrow) at 10 wks with oil or Tamoxifen by i.p injections for 5 consecutive days.
f, At endpoint (death), like T-lymphomas (Fig. 2h), also most sarcomas in Tamoxifen-treated floxQ/−;ERT2/+ mice are again entirely composed of p53-positive cells. This indicates strong selective pressure for mutp53-positive tumor cells in that the small minority of non-recombined malignant cells outcompeted the vast majority of recombined mutp53-deleted cells and with time took over the tumor mass, supporting tumor addiction to high levels of mutp53. Out of 10 sarcomas, 9 (90%) stained positive for p53 and only 1 (10%) was negative for p53. p53 immunostainings of representative fibro- and angiosarcomas are shown. Note, the blue cells in oil-treated osteosarcoma are normal stromal cells.
Extended Data Figure 3. Synergistic action of 17AAG+SAHA in subcutaneous xenografts of mutp53-harboring T47D (p53 L194F) human breast cancer cells.
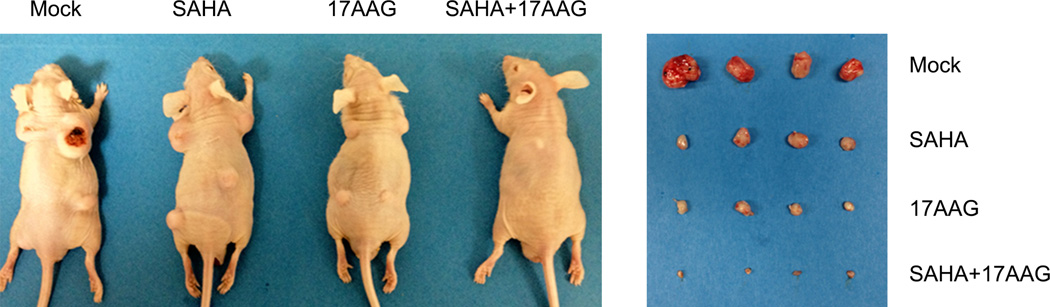
Representative images of nude mice and their dissected tumors with 1 Mio cells injected per site.
Extended Data Figure 4. Ganetespib kills mutp53 human and mouse cells in a mutp53-dependent manner.

a–c, On a molar basis, ganetespib is >50-fold more potent than 17AAG in degrading mutp53 and killing human mutp53 cancer cells. MDA468 (p53 R280K) (a) and T47D (p53 L194F) (c) breast cancer cells, as well as ES2 (p53 S241F) ovarian cancer cells (b) were seeded into 6-well plates and treated for 24–48h. After incubation, dead cells were washed off and total protein lysates from only live cells were immunoblotted as indicated. CTB assays on parallel cultures for cell viability show drug activity. (c) SkBr3, (p53 R175H) breast cancer cells; DU145, heterozygous (p53 P223L/V274F) prostate cancer cells; MDA231 (R280K) breast cancer cells. Mean ± s.e.m. of four (b) or three (c) technical replicas, unpaired two-tailed Student’s t-test. p-Akt and p-Erk are also Hsp90 clients; cleaved PARP indicates activated apoptosis.
d–f, Ganetespib destabilizes mutp53 but not wtp53 in cultured human ovarian carcinoma cells: EFO21 (p53 C124R) and HOC7 (p53 C275F) (d), wtp53 COV434 and COLO704 (e), and in human non-small cell lung cancer xenografts H1975 (p53 R273H) (f). (f) Nude mice bearing tumor xenografts (each lane is an independent tumor) were treated with a single bolus of DMSO or ganetespib (50 mg/kg i.v.). Tumors were harvested at baseline (30 min), 48 hr and 72 hr. Cells were lysed and tumors homogenized and immunoblotted as indicated. Chk1 and CDK1 are other Hsp90 clients, cleaved PARP indicates activated apoptosis.
g, h, Ganetespib decreases stabilized mutp53 levels in live Q/− T-lymphoma cells within 24 h, associated with induction of apoptosis. (g) Freshly isolated live Q/− T-lymphoma cells were treated with DMSO or 50 nM ganetespib for 24h, followed by immunoblots as indicated. Hsp70 indicates drug activity. Hsc70 is the loading control. (h) Death curves of freshly isolated Q/− and p53−/− T-lymphoma cells treated with DMSO or 50 nM ganetespib for the indicated times. CTB and trypan blue exclusion assays are plotted. All values are relative to DMSO treatment at the same time point. Mean ± s.e.m, unpaired two-tailed Student’s t-test, n = 4 independent isolates per genotype for every time point, * p<0.05, ** p<0.01.
i, j, Ganetespib suppresses tumor growth. Subcutaneous allografts of Q/− B-lymphoma. (i) Prophylactic protocol, treatment days are indicated in red, tumor cell injection is marked by arrow. Time-course of allograft growth. n, number of allografts. (j) Therapeutic protocol (same as in Fig. 4b). Representative animals and tumor mass at endpoint are shown. Mean ± s.e.m; unpaired two-tailed Student’s t-test; n, number of allografts.
k, Ganetespib yields synergistic anti-tumor effects in combination with cyclophosphamide. Subcutaneous allografts of Q/− and H/H T-lymphoma cells were treated once (arrow) with the indicated doses of ganetespib or cyclophosphamide alone or in combination. The mean (± s.e.m.) allograft size for Q/− and H/H at the start of treatment was 274 ± 36 mm3 and 323 ± 44 mm3, respectively. Unpaired two-tailed Student’s t-test; n, number of allografts. Each single drug is compared to the combination. * p<0.05 or ** p<0.01.
l, Comparison of ganetespib treatment of floxQ/− vs corresponding p53−/− control mice from Fig. 4g. floxQ/− mice, which normally have a significantly shorter lifespan than p53-null littermates2 (median 139d vs 195d, respectively, see also Extended Fig. 1d) respond to ganetespib with significantly longer survival (right shift) and now resemble that of p53−/− mice. Kaplan-Meier analysis.
m, n, Ganetespib monotherapy once a week improves overall survival more efficiently than either genetic mutp53 ablation or 17DMAG+SAHA given 5 times a week. (m) Comparison of Kaplan-Meier survival curves of Tam-treated floxQ/− animals from Fig. 2g and ganetespib-treated floxQ/− animals from Fig. 4g. Note, based on their phenotypic identity (see Extended Fig. 1d), floxQ/− mice were used in Fig. 4g in lieu of Q/− to ensure direct comparability with Tam treatment. (n) Comparison of Kaplan-Meier survival curves of 17DMAG+SAHA treated H/H animals from Fig. 3c and ganetespib-treated H/H animals from Fig. 4f.
Supplementary Material
Acknowledgments
We are grateful to Susanne Schlick, Daniel Mott, and Peirong Yang for technical assistance. This work was supported by National Cancer Institute award 1RO1CA176647 and Deutsche Forschungsgemeinschaft award MO 1998/2-1.
DAP is employed by Synta Pharmaceuticals, a company that studies ganetespib, one of the drugs used in this paper.
Footnotes
Supplementary Information is linked to the online version of the paper at www.nature.com/nature.
Author Contributions UMM conceived and designed the study, EMA, ARY, DL, SX, RS, DAP conducted experiments, EMA, ARY, DL and MD analyzed experiments, GL provided p53H/H and p53−/− cohorts, DAP provided ganetespib, UMM wrote the manuscript.
The authors declare no competing financial interests.
References
- 1.Doyle B, et al. p53 mutation and loss have different effects on tumourigenesis in a novel mouse model of pleomorphic rhabdomyosarcoma. The Journal of pathology. 2010;222:129–137. doi: 10.1002/path.2748. [DOI] [PubMed] [Google Scholar]
- 2.Hanel W, et al. Two hot spot mutant p53 mouse models display differential gain of function in tumorigenesis. Cell death and differentiation. 2013;20:898–909. doi: 10.1038/cdd.2013.17. [DOI] [PMC free article] [PubMed] [Google Scholar]
- 3.Lang GA, et al. Gain of function of a p53 hot spot mutation in a mouse model of Li-Fraumeni syndrome. Cell. 2004;119:861–872. doi: 10.1016/j.cell.2004.11.006. [DOI] [PubMed] [Google Scholar]
- 4.Morton JP, et al. Mutant p53 drives metastasis and overcomes growth arrest/senescence in pancreatic cancer. Proceedings of the National Academy of Sciences of the United States of America. 2010;107:246–251. doi: 10.1073/pnas.0908428107. [DOI] [PMC free article] [PubMed] [Google Scholar]
- 5.Olive KP, et al. Mutant p53 gain of function in two mouse models of Li-Fraumeni syndrome. Cell. 2004;119:847–860. doi: 10.1016/j.cell.2004.11.004. [DOI] [PubMed] [Google Scholar]
- 6.Brosh R, Rotter V. When mutants gain new powers: news from the mutant p53 field. Nat Rev Cancer. 2009;9:701–713. doi: 10.1038/nrc2693. doi:nrc2693 [pii] 10.1038/nrc2693. [DOI] [PubMed] [Google Scholar]
- 7.Terzian T, et al. The inherent instability of mutant p53 is alleviated by Mdm2 or p16INK4a loss. Genes Dev. 2008;22:1337–1344. doi: 10.1101/gad.1662908. doi:22/10/1337 [pii] 10.1101/gad.1662908. [DOI] [PMC free article] [PubMed] [Google Scholar]
- 8.Suh YA, et al. Multiple stress signals activate mutant p53 in vivo. Cancer research. 2011;71:7168–7175. doi: 10.1158/0008-5472.CAN-11-0459. [DOI] [PMC free article] [PubMed] [Google Scholar]
- 9.Blagosklonny MV, Toretsky J, Bohen S, Neckers L. Mutant conformation of p53 translated in vitro or in vivo requires functional HSP90. Proceedings of the National Academy of Sciences of the United States of America. 1996;93:8379–8383. doi: 10.1073/pnas.93.16.8379. [DOI] [PMC free article] [PubMed] [Google Scholar]
- 10.Whitesell L, Sutphin PD, Pulcini EJ, Martinez JD, Cook PH. The physical association of multiple molecular chaperone proteins with mutant p53 is altered by geldanamycin, an hsp90-binding agent. Molecular and cellular biology. 1998;18:1517–1524. doi: 10.1128/mcb.18.3.1517. [DOI] [PMC free article] [PubMed] [Google Scholar]
- 11.Li D, Marchenko ND, Moll UM. SAHA shows preferential cytotoxicity in mutant p53 cancer cells by destabilizing mutant p53 through inhibition of the HDAC6-Hsp90 chaperone axis. Cell death and differentiation. 2011;18:1904–1913. doi: 10.1038/cdd.2011.71. [DOI] [PMC free article] [PubMed] [Google Scholar]
- 12.Li D, et al. Functional inactivation of endogenous MDM2 and CHIP by HSP90 causes aberrant stabilization of mutant p53 in human cancer cells. Molecular cancer research : MCR. 2011;9:577–588. doi: 10.1158/1541-7786.MCR-10-0534. [DOI] [PMC free article] [PubMed] [Google Scholar]
- 13.Bougeard G, et al. Molecular basis of the Li-Fraumeni syndrome: an update from the French LFS families. Journal of medical genetics. 2008;45:535–538. doi: 10.1136/jmg.2008.057570. [DOI] [PubMed] [Google Scholar]
- 14.Zerdoumi Y, et al. Drastic effect of germline TP53 missense mutations in Li-Fraumeni patients. Human mutation. 2013;34:453–461. doi: 10.1002/humu.22254. [DOI] [PubMed] [Google Scholar]
- 15.Muller PA, Vousden KH. Mutant p53 in cancer: new functions and therapeutic opportunities. Cancer cell. 2014;25:304–317. doi: 10.1016/j.ccr.2014.01.021. [DOI] [PMC free article] [PubMed] [Google Scholar]
- 16.Weissmueller S, et al. Mutant p53 drives pancreatic cancer metastasis through cell-autonomous PDGF receptor beta signaling. Cell. 2014;157:382–394. doi: 10.1016/j.cell.2014.01.066. [DOI] [PMC free article] [PubMed] [Google Scholar]
- 17.Trepel J, Mollapour M, Giaccone G, Neckers L. Targeting the dynamic HSP90 complex in cancer. Nat Rev Cancer. 2010;10:537–549. doi: 10.1038/nrc2887. [DOI] [PMC free article] [PubMed] [Google Scholar]
- 18.Whitesell L, Lindquist SL. HSP90 and the chaperoning of cancer. Nat Rev Cancer. 2005;5:761–772. doi: 10.1038/nrc1716. doi:nrc1716 [pii] 10.1038/nrc1716. [DOI] [PubMed] [Google Scholar]
- 19.Dai C, Whitesell L, Rogers AB, Lindquist S. Heat shock factor 1 is a powerful multifaceted modifier of carcinogenesis. Cell. 2007;130:1005–1018. doi: 10.1016/j.cell.2007.07.020. [DOI] [PMC free article] [PubMed] [Google Scholar]
- 20.Min JN, Huang L, Zimonjic DB, Moskophidis D, Mivechi NF. Selective suppression of lymphomas by functional loss of Hsf1 in a p53-deficient mouse model for spontaneous tumors. Oncogene. 2007;26:5086–5097. doi: 10.1038/sj.onc.1210317. [DOI] [PubMed] [Google Scholar]
- 21.Slingerland M, Guchelaar HJ, Gelderblom H. Histone deacetylase inhibitors: an overview of the clinical studies in solid tumors. Anti-cancer drugs. 2014;25:140–149. doi: 10.1097/CAD.0000000000000040. [DOI] [PubMed] [Google Scholar]
- 22.Zou J, Guo Y, Guettouche T, Smith DF, Voellmy R. Repression of heat shock transcription factor HSF1 activation by HSP90 (HSP90 complex) that forms a stress-sensitive complex with HSF1. Cell. 1998;94:471–480. doi: 10.1016/s0092-8674(00)81588-3. [DOI] [PubMed] [Google Scholar]
- 23.Barretina J, et al. The Cancer Cell Line Encyclopedia enables predictive modelling of anticancer drug sensitivity. Nature. 2012;483:603–607. doi: 10.1038/nature11003. [DOI] [PMC free article] [PubMed] [Google Scholar]
- 24.Siegel D, Yan C, Ross D. NAD(P)H:quinone oxidoreductase 1 (NQO1) in the sensitivity and resistance to antitumor quinones. Biochemical pharmacology. 2012;83:1033–1040. doi: 10.1016/j.bcp.2011.12.017. [DOI] [PMC free article] [PubMed] [Google Scholar]
- 25.Proia DA, Bates RC. Ganetespib and HSP90: translating preclinical hypotheses into clinical promise. Cancer research. 2014;74:1294–1300. doi: 10.1158/0008-5472.CAN-13-3263. [DOI] [PubMed] [Google Scholar]
- 26.Socinski MA, et al. A multicenter phase II study of ganetespib monotherapy in patients with genotypically defined advanced non-small cell lung cancer. Clinical cancer research : an official journal of the American Association for Cancer Research. 2013;19:3068–3077. doi: 10.1158/1078-0432.CCR-12-3381. [DOI] [PMC free article] [PubMed] [Google Scholar]
- 27.Donehower LA, et al. Mice deficient for p53 are developmentally normal but susceptible to spontaneous tumours. Nature. 1992;356:215–221. doi: 10.1038/356215a0. [DOI] [PubMed] [Google Scholar]
- 28.Jacks T, et al. Tumor spectrum analysis in p53-mutant mice. Curr Biol. 1994;4:1–7. doi: 10.1016/s0960-9822(00)00002-6. [DOI] [PubMed] [Google Scholar]
- 29.Landmann H, et al. UDP glucuronosyltransferase 1A expression levels determine the response of colorectal cancer cells to the heat shock protein 90 inhibitor ganetespib. Cell death & disease. 2014;5:e1411. doi: 10.1038/cddis.2014.378. [DOI] [PMC free article] [PubMed] [Google Scholar]
- 30.Khoo KH, Verma CS, Lane DP. Drugging the p53 pathway: understanding the route to clinical efficacy. Nature reviews. Drug discovery. 2014;13:217–236. doi: 10.1038/nrd4236. [DOI] [PubMed] [Google Scholar]
Supplementary References
- 31.Ventura A, et al. Restoration of p53 function leads to tumour regression in vivo. Nature. 2007;445:661–665. doi: 10.1038/nature05541. [DOI] [PubMed] [Google Scholar]
- 32.Dobbelstein M, Moll U. Targeting tumour-supportive cellular machineries in anticancer drug development. Nature Reviews. Drug Discovery. 2014;13:179–196. doi: 10.1038/nrd4201. [DOI] [PubMed] [Google Scholar]
- 33.Gorska M, et al. Geldanamycin and its derivatives as Hsp90 inhibitors. Frontiers in Bioscience. 2012;17:2269–2277. doi: 10.2741/4050. [DOI] [PubMed] [Google Scholar]
- 34.Hrzenjak A, et al. Histone deacetylase inhibitor vorinostat suppresses the growth of uterine sarcomas in vitro and in vivo. Molecular Cancer. 2010;9:49. doi: 10.1186/1476-4598-9-49. [DOI] [PMC free article] [PubMed] [Google Scholar]
- 35.Proia DA, et al. Multifaceted intervention by the Hsp90 inhibitor ganetespib (STA-9090) in cancer cells with activated JAK/STAT signaling. PloS One. 2011;6:e18552. doi: 10.1371/journal.pone.0018552. [DOI] [PMC free article] [PubMed] [Google Scholar]
- 36.Ying W, et al. Ganetespib, a unique triazolone-containing Hsp90 inhibitor, exhibits potent antitumor activity and a superior safety profile for cancer therapy. Molecular Cancer Therapeutics. 2012;11:475–484. doi: 10.1158/1535-7163.MCT-11-0755. [DOI] [PubMed] [Google Scholar]
Associated Data
This section collects any data citations, data availability statements, or supplementary materials included in this article.