Abstract
Background/Aims
There is some consensus among authors of reports of clinical studies that a measure of follow-up time is informative for the interpretation of the Kaplan Meier estimate of the survivor function of the event time of interest. Previous authors have suggested that length of follow-up is important to report because the findings of a study should be extracted from the time frame in which most of the subjects have had the event or have been remained under observation. This time frame is where the Kaplan Meier estimate is most stable. This concept of stability is relative to the potential maximum information about the event time distribution contained in the sample; it is not relative to the true, population survivor function. A measure of stability is useful for the interpretation of an interim analysis in which an immature survivor function is presented. Our interest in this paper lies in characterizing the unobserved, complete follow-up Kaplan Meier estimate based on the observed, partial follow-up estimate. Our focus is not on characterizing the true event time distribution relative to its estimate. The concept of stability has not been well-defined in the literature, which has led to inconsistency and lack of transparency across trials in their attempts to capture it through a variety of measures of follow-up.
Methods
We report the results of a survey of recent literature on cancer clinical trials, and summarize whether follow-up is reported and if so, if it is well-defined. We define commonly used measures of follow-up in clinical studies.
Results
We explain how each measure should be assessed to evaluate the stability of the Kaplan Meier estimate for the event and we identify relationships among measures. We propose a new measure that better conveys the desired information about the stability of the current Kaplan Meier estimate relative to one based on complete follow-up. We apply the proposed measure to a meningioma study for illustration.
Conclusions
It is useful for reports of clinical studies to supplement Kaplan Meier estimates with quantitative assessments of the stability of those estimates relative to the potential follow-up of study participants. We justify the use of one commonly used measure and we propose a new measure that most directly accomplishes this goal.
Keywords: Censoring, Clinical trials, Observation time
Introduction
There is some consensus among authors of reports of clinical studies that a measure of follow-up time is informative for the interpretation of the Kaplan Meier estimate of the survivor function of the event time of interest. It has been explained1–3 that length of follow-up is important to report because the findings of a study should be extracted from the time frame in which most of the subjects have had the event or have been remained under observation. This time frame is where the Kaplan Meier estimate is most stable.3 This concept of stability is relative to the potential maximum information about the event time distribution contained in the sample; it is not relative to the true, population survivor function. A measure of stability is useful for the interpretation of an interim analysis in which an immature survivor function is presented. For example, once a trial has opened, researchers immediately turn their attention to the design of future trials and are eager for hints from the current trial.4 Problems arise when the early data are used for future designs, but are not mature, and authors have noted that care should be taken not to report results until they are mature.4 Our interest in this paper lies in characterizing the unobserved, complete follow-up Kaplan Meier estimate based on the observed, partial follow-up estimate. The concept of stability has not been well-defined in the literature, which has led to inconsistency and lack of transparency across trials in their attempts to capture it through a variety of measures of follow-up.
There is a clear distinction between this notion of stability and the notion of precision. If the precision of the Kaplan Meier estimate were of interest, it would be best conveyed with confidence intervals or bands for the Kaplan Meier estimate. Estimates of precision speak to the variability of the current data relative to the truth. Instead, we are interested in the variability of the current Kaplan Meier estimate relative to the future estimate given complete follow-up. Both concepts are of interest and of use to report about clinical trials,5 and here we aim to clarify that of stability. There is no lack of clarity in the literature regarding the reporting of precision.
In this note, we survey current reports of cancer clinical trials and summarize what is reported regarding follow-up. We define the commonly used measures of follow-up and explain how they could be used to convey the degree of stability of the Kaplan Meier estimate for the event of interest. We also suggest an alternative measure for this purpose. We illustrate the concepts and measures using data from a meningioma study.
Notation
Let X denote the time to event, C denote the time to censoring (the minimum of time to drop-out and end of study), T denote the observed time, i.e., T=min(X,C), SX(t)=P(X>t), SC(t)=P(C>t) and fC(t) is the density function of C. We are interested in the survivor function for X, SX(t)=P(X>t), which we estimate with the Kaplan Meier estimator. We assume throughout that X and C are independent.
Survey of cancer clinical trials
To investigate how follow-up time is currently being reported in cancer clinical trials, in which overall survival is a common endpoint, we conducted a search of the Original Reports in the Journal of Clinical Oncology between January 2013 and June 2013 for articles containing the phrase “median follow up.” Of the 60 articles (37% of the 161 Original Reports) that reported a median follow up time, 34 (57%) did not specify what was meant by “median follow up.” This latter statistic is similar to the 50% found in a similar 1994 survey1 of three clinical journals and to results from a 1995 survey.5 Seventeen (28%) specified that median follow up was calculated as the median time on study for those event-free at the end of follow-up, i.e., C|C<X. One article reported both a median follow-up (undefined) and a median follow up among those event-free. Four (7%) articles specified that median follow-up referred to median time to censoring, i.e., C, two reported median potential follow up, i.e., to the end of follow-up – whether or not an event preceded that time, and two reported observation time on study, i.e., T. Similar discordance was reported among a survey of authors who used the term “median follow-up” in American Society of Clinical Oncology/American Association of Cancer Research abstracts.3 None of the papers that reported follow-up presented the full estimated distribution functions of the measures; those that reported anything simply reported medians. Furthermore, none of these papers interpreted their reports of follow-up.
Measures of follow-up
Time to censoring
One measure of follow-up that has been favored1,2,5 as a measure of the stability of the Kaplan Meier estimate of the survivor function of X is the Kaplan Meier estimate of the survivor function for C, SC(t), or derived summary measures from it, such as the median time to censoring. The estimate of the median of C is to be interpreted in the hypothetical world in which the event of interest is removed. Importantly, this is not equivalent to the median observation time of all subjects in the study or of subjects who do not experience the event. Only vague conclusions about the stability of the Kaplan Meier estimate may be possible even on the basis of estimation of the distribution of C. For example, the greater the proximity of SC(t) to 1 for a large portion of the support of X, the greater the range of stability of the Kaplan Meier estimate in the presence of additional follow-up. If the median of C is estimable, it conveys limited information if it happens to be less than the median of X; in this case it is likely that with additional follow-up the Kaplan Meier estimate for X could change at times prior to its median. If the median of C is estimable but larger than that of X, many scenarios for the movement in the Kaplan Meier estimate for X with additional follow-up are possible.
Observation time
A second measure of follow-up is the estimate of the survivor function for T=min(X,C), or derived summary measures from it. The survivor function is given by P(T>t)=SX(t)SC(t), the product of the survivor functions for X and C. The condition given above for stability of the Kaplan Meier estimate of the survivor function for X (i.e., proximity of SC(t) to 1 for a large portion of the support of X) translates into the condition of proximity of P(T>t) to SX(t), given the definition of P(T>t)=SX(t)SC(t). Again, the estimated median of T could be reported in conjunction with that of X, though this involves a substantial loss of information relative to a report of the full distribution. In some articles, the observation times are implicitly reported in the plot of the Kaplan Meier estimate for X through numbers at risk given at regular time points along the time axis. As this information is not presented visually, it is difficult to integrate with the Kaplan Meier estimate for X for an assessment of stability.
Observation time for those event-free: C|C<X
A third measure of follow-up is the estimate of the survivor function for the observation time for those who are event-free at the end of follow-up. As C is completely observed among those with C<X, this survivor function is estimated simply by its empirical estimator, with theoretical expression given by
Interestingly, the corresponding joint probability, P(C>t, C<X), termed the “sub-survival” or “crude survival” function, contributes to the lower Peterson6 bound for the survivor function. These bounds incorporate the competing risk of censoring, but do not isolate the follow-up for assessment of the stability of the estimate of the survivor function. Among the three measures described, this measure is the most informative about the stability of the Kaplan Meier estimate of the survivor function for X. This is because it is directly focused on exactly the subjects whose observed times could change with additional follow-up; it is simply a summary of their observation times. If the distribution of C for these subjects is concentrated at the upper limit of the support of X, only the right tail of the Kaplan Meier estimate for X has the potential for change. However, if the distribution of C for these subjects is concentrated at the lower end of the support of X, the entire Kaplan Meier estimate for X could change. Even the estimated median of C for these subjects relative to the median and support of X is informative about the stability of the Kaplan Meier estimate for X as it reflects the values of the censored observations. Some authors who do consider the different possibilities for measure of follow-up3,4 also favor this measure, albeit without justification. An argument against this measure is that if there are few event-free observations at the time of analysis, it is unstable.5
Relationships among measures
One formalization of the implied conditions for stability of the Kaplan Meier estimator for X based on SC(t) and P(T>t) are that SC(t)>1−ε and P(T>t)/SX(t)>1−ε for some ε>0 and for t in a large portion of the support of X. As noted above, these conditions are equivalent to each other because P(T>t)=SX(t)SC(t). Alternatively, it might be required that SX(t)−P(T>t)<α. This is equivalent to SC(t)>1−α/SX(t), which is less stringent than SC(t)>1−ε. Thus, either the distribution of C or the distribution of T could be used to assess the stability of the Kaplan Meier estimate for X, though they should not be evaluated in an equivalent manner. This non-equivalence in the evaluation of measures has not been addressed at all in the clinical trials literature.
A second observation is that when both X and C are exponentially distributed with rates λx and λc, respectively, the distribution of T is equivalent to the distribution of C|C<X, i.e., P(T>t)=SX(t)SC(t)=exp(−λxt)exp(−λct)=exp[−(λx+λc)t], and
Thus, in this special case, there is no distinction among these two measures of follow-up. Based on our first observation, this indicates that when X and C are exponentially distributed, SC(t), P(T>t) and P(C>t|C<X) all provide equivalent information regarding the stability of the Kaplan Meier estimate for X. However, SC(t) should be evaluated relative to 1 and secondarily relative to SX(t), while P(T>t) and P(C>t|C<X) should be evaluated relative to SX(t).
Alternative measures that convey stability of the Kaplan-Meier estimate
As current measures of follow-up do not directly convey desired information about the stability of the Kaplan Meier estimate of the survivor function for the event of interest, we propose an alternative simple measure that directly addresses this quantity. This measure is the set of upper and lower limits for the Kaplan Meier estimate: the upper limit is obtained by setting all censored observations to a value larger than the maximum event time (and retaining their status as censored), and the lower limit is obtained by coding all censored observations as events at the observed event times immediately following their censoring times. These are not confidence limits relative to the truth, but rather the deterministic maximum and minimum of the Kaplan Meier estimate under complete follow-up of the censored observations. These limits directly convey the stability of the estimate based on the current data; narrow limits indicate stability, while wide limits indicate potential lack of stability. In contrast, the follow-up measures that are currently reported are not directly informative about this stability, but require subjective assessment relative to the Kaplan Meier estimate for the event.
Metrics derived from the upper and lower limits are also useful. These include quantile summaries of the limits, the difference curve between the upper and lower limits and the area under this curve, normalized by the maximum event time, to range between zero (complete stability) and one (complete instability). Additionally, it may be of interest to present partial difference curves to indicate directional instability: the difference between the upper limit and the Kaplan Meier estimate and the difference between the Kaplan Meier estimate and the lower limit.
Meningioma study
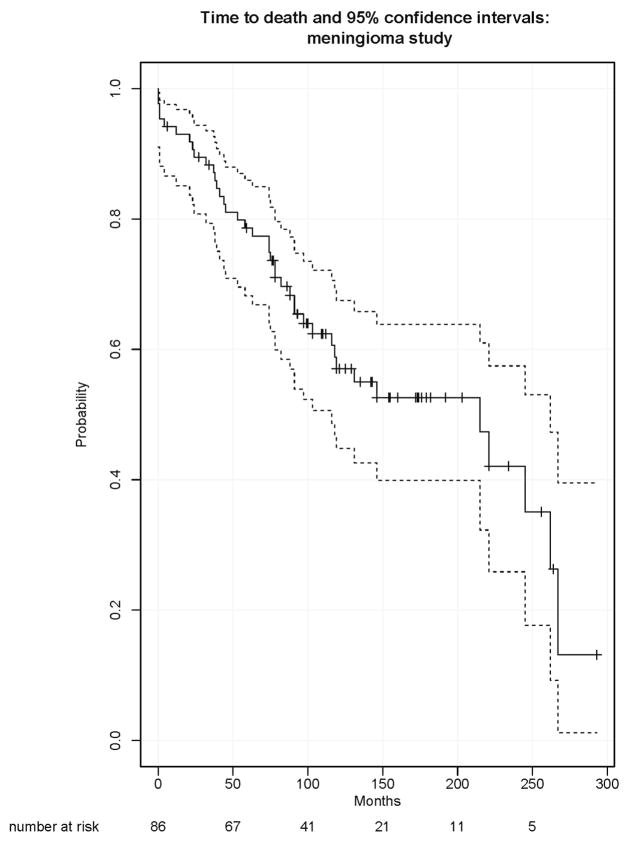
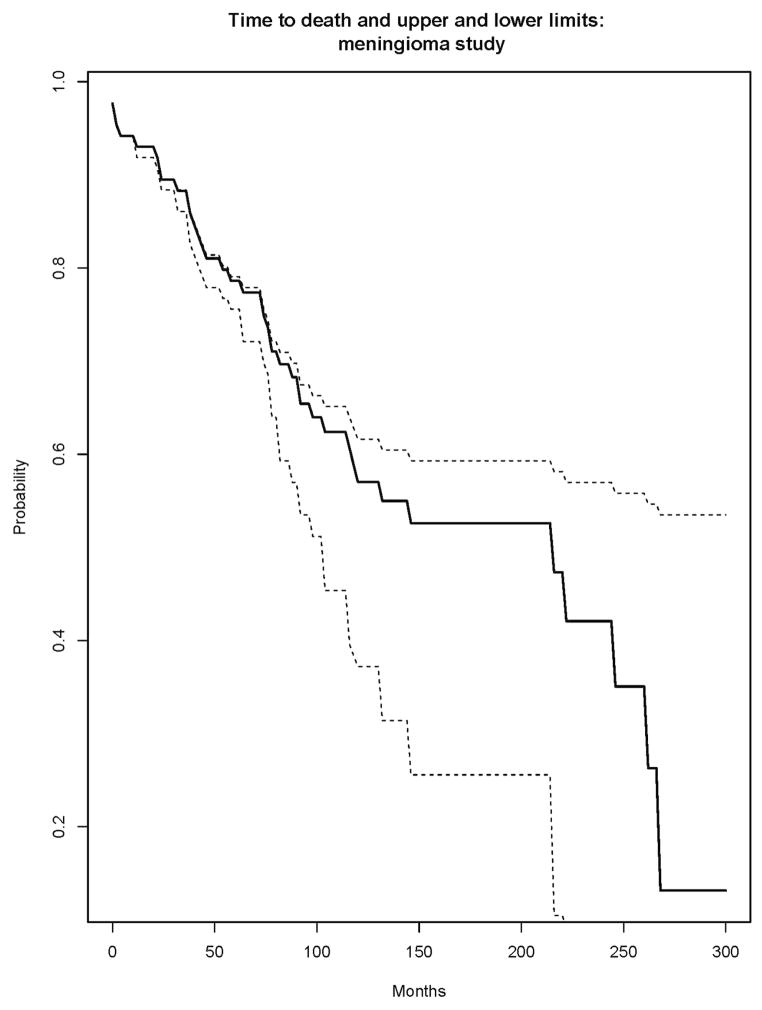
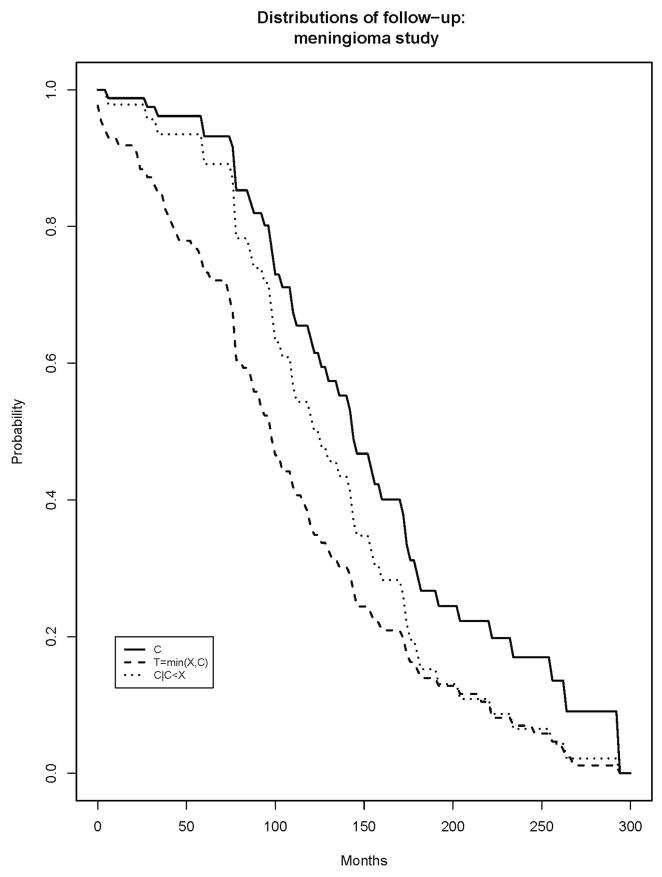
A study of patients with atypical meningiomas7 investigated molecular correlates of survival and progression-free survival. The study analyzed 86 subjects with completely resected atypical meningiomas. The subjects were sampled from two neurosurgical centers in Ireland. With respect to the endpoint of overall survival, the subjects in the study were censored either due to drop-out from the study or due to the administrative end of the study on May 31, 2010. Figure 1 displays the estimated survivor function for X (death), along with the log-log 95% confidence intervals and with the numbers at risk at several time points listed. The confidence intervals do not communicate the stability of the estimate, but rather the variability of the estimate relative to the truth. Figure 2 displays the proposed upper and lower limits for the estimated survivor function for X. Figure 3 displays the alternative measures of follow-up, including the estimated survivor functions for C, T=min(C,X) and C|C<X.
Figure 1.
Kaplan Meier estimate of survivor function for overall survival, X, with 95% confidence intervals and numbers at risk.
Figure 2.
Proposed upper and lower limits for Kaplan Meier.
Figure 3.
Kaplan Meier estimates of survivor functions for time to censoring, C, observation time, T, and time to censoring among those who are censored, C|C<X.
The median time to censoring is 143 months, the median observation time is 100 months and the median time on study for those still under observation is 135 months. These are all roughly in the middle of the support of the event time (0–267 months) and are less than the median time to death of 215 months, and indicate broadly that with additional follow-up, the Kaplan Meier estimate could change substantially. These conclusions are heuristic and qualitative.
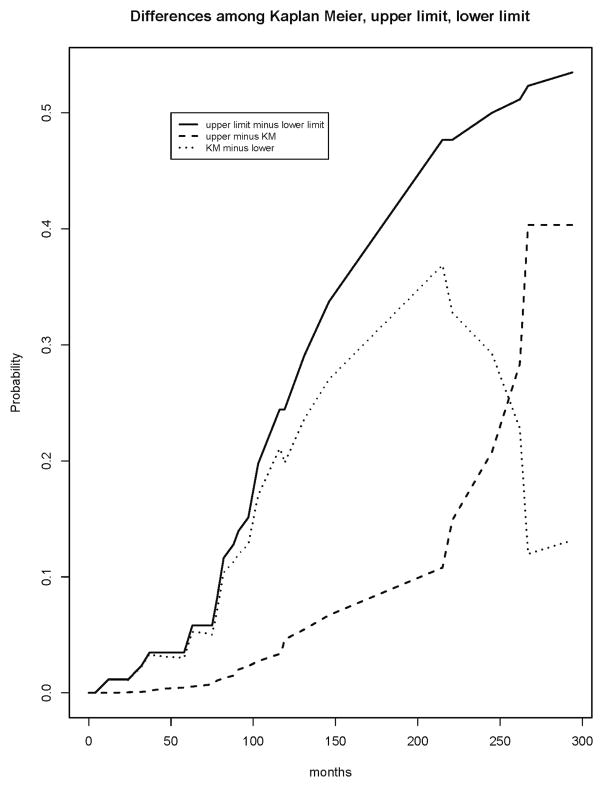
The upper and lower limits confirm that the left hand portion of the estimate through about 75 months is quite stable, while beyond 75 months it could drop substantially. The normalized area under the difference curve (Figure 4) is 29%, indicating moderate stability (0% would indicate perfect stability). The partial difference curves clearly indicate the potential direction of the movement of the Kaplan Meier for X as a function of time; there is larger downward potential until about 250 months. The estimated 25th percentile of the survival distribution is 74 months; the 25th percentiles of the lower and upper limits are 63 and 75. This indicates some potential downward movement in the early part of the Kaplan Meier for death. The estimated median of the survival distribution is 215 months; that of the lower limit is 103 months and that of the upper limit is not estimable. This indicates a large potential for movement in either direction for the median survival. The estimated 75th percentile is 267, with lower limit of 215 and nonestimable upper limit. These summary statistics emphasize the stability of the estimate early in time and its instability in its middle and right hand tail. The information conveyed by the estimated distributions of C, T or C|C<X, or their respective medians is considerably less directly connected with the notion of stability than that provided by these other measures.
Figure 4.
Difference curve between upper and lower limits of Kaplan Meier and partial difference curves between Kaplan Meier and upper and lower limits.
Discussion
The concept of follow-up is ill-defined in reports of clinical studies, which can lead to confusion, and does not provide the intended insight into the Kaplan Meier estimate for the event and its stability under additional follow-up. Based on our survey of cancer clinical trial reports, it appears that more than half of published clinical trials report a median follow-up time without specifying how it is defined. Among other possibilities, median follow-up may mean median time to censoring, median observation time, or median observation time for those who are event free at the end of the study. At the very least, the measure that is reported must be clearly specified.4 We elucidate that summary measures of these distributions, such as medians, are only vaguely informative about the stability of the Kaplan Meier estimate for the event of interest.
Among other considerations, these medians need to be evaluated in light of the rarity of the event of interest; a small median follow-up implies less stability in the setting of a rare event (i.e., large median time to event with few observed events at the time of analysis) than a common event of interest. This is due to the possibility of many additional events with complete follow-up, in conjunction with the instability of the small numbers of events at the analysis with incomplete follow-up. An alternative model for the event time is a mixture model, or cure model,8,9 in which every subject has a nonzero probability of not experiencing the event. The role of follow-up in this context would be interesting to consider.
Graphical presentation of the entire distributions is more useful. This point was made even more strongly in a 1991 publication,3 which stated that “median follow-up is not a valid or useful scientific term, and should not appear Q. detailed life tables should be appended to Kaplan-Meier curves.” We also note that although both related to follow-up time, the distributions of C and T require different evaluations, and that the distribution of C|C<X is most directly informative about the stability of the Kaplan Meier estimate. We have also proposed a simple new measure, based on upper and lower limits for the potential Kaplan Meier estimate, that more directly reflects the stability of the estimate.
We have focused on the stability of a single Kaplan Meier estimate for an event. Stability is an issue, as well, for the comparison of two groups, such as through a logrank test. This is more complicated as it requires the evaluation of follow-up for each group separately and the subsequent assessment of the stability of the comparison of the groups. In some cases it may be useful to base this on our proposed upper and lower limits for the individual Kaplan Meier estimates.
Acknowledgments
Funding
This work was funded in part by grants from the National Institutes of Health (CA075951, TR001102).
We thank Dr. Michael Jansen for permission to use the meningioma data.
Research Support:
NIH R01 CA075971; NIH UL1 TR001102
Footnotes
Conflict of interest
None declared.
This research has not been presented anywhere. There are no disclaimers.
References
- 1.Schemper M, Smith TL. A note on quantifying follow-up in studies of failure time. Control Clin Trials. 1996;17:343–346. doi: 10.1016/0197-2456(96)00075-x. [DOI] [PubMed] [Google Scholar]
- 2.Korn EL. Censoring distributions as a measure of follow-up in survival analysis. Stat Med. 1986;5:255–260. doi: 10.1002/sim.4780050306. [DOI] [PubMed] [Google Scholar]
- 3.Shuster JJ. Median follow-up in clinical trials. J Clin Oncol. 1991;9:191–192. doi: 10.1200/JCO.1991.9.1.191. [DOI] [PubMed] [Google Scholar]
- 4.Green S, Benedetti J, Smith A, et al. Chapman & Hall/CRC Interdisciplinary Statistics Series. 3. Boca Raton, FL: CRC Press; 2012. Clinical Trials in Oncology; pp. 155–159. [Google Scholar]
- 5.Altman DG, De Stavola BL, Love SB, et al. Review of survival analyses published in cancer journals. Br J Cancer. 1995;72:511–518. doi: 10.1038/bjc.1995.364. [DOI] [PMC free article] [PubMed] [Google Scholar]
- 6.Peterson AV., Jr Bounds for a joint distribution with fixed sub-distribution functions: Application to competing risks. Proc Natl Acad Sci USA. 1976;73:11–13. doi: 10.1073/pnas.73.1.11. [DOI] [PMC free article] [PubMed] [Google Scholar]
- 7.Jansen M, Mohapatra G, Betensky RA, et al. Gain of chromosome arm 1q in atypical meningioma correlates with shorter progression-free survival. Neuropathol Appl Neurobiol. 2012;38:213–219. doi: 10.1111/j.1365-2990.2011.01222.x. [DOI] [PMC free article] [PubMed] [Google Scholar]
- 8.Berkson J, Gage RP. Survival curves for cancer patients following treatment. J Am Stat Assoc. 1952;47:501–515. [Google Scholar]
- 9.Boag JW. Maximum likelihood estimates of the proportion of patients cured by cancer. J R Stat Soc Series B Stat Methodol. 1949;11:15–53. [Google Scholar]


