Abstract
Purpose:
Recent efforts in the reconstruction of interventional devices from two distinct views require the segmentation of the object in both fluoroscopic images. Noise might decrease the quality of the segmentation and cause artifacts in the reconstruction. The noise level depends on the x-ray dose the patient is exposed to. The proposed algorithm reduces the noise and enhances the separability of curvilinear devices in background subtracted fluoroscopic images to allow a more accurate segmentation.
Methods:
The algorithm uses a set of binary masks to estimate a line conformity measure that determines the best direction for a directional filter kernel. If the calculated value exceeds a certain threshold, the directional kernel is used to obtain the filtered value. Otherwise, an isotropic filter kernel is used.
Results:
The evaluation was performed on a set of 36 fluoroscopic images using a vascular head phantom with three different guidewires and nine different x-ray dosages from 6 nGy/pulse to 45 nGy/pulse as well as a clinical data set containing ten images. Compared with wavelet shrinkage and the bilateral filter, the proposed algorithm increased the average contrast to noise ratio by at least 17.8% for the phantom and 68.9% for the clinical images. The accuracy of the device segmentation was improved on average by at least 17.3% and 14.0%, respectively.
Conclusions:
The proposed algorithm was able to significantly reduce the amount of noise in the images and therefore increase the quality of the device segmentations compared to both the bilateral filter and the wavelet thresholding approach for all acquired noise levels using rotating directional filter kernels near line structures and isotropic kernels for the background. The application of the proposed algorithm for the 3D reconstruction of curvilinear devices from two views would allow a more accurate reconstruction of the device.
Keywords: noise reduction, segmentation, fluoroscopy, binary masks
1. INTRODUCTION
The availability of biplane angiography systems in many clinical environment has initiated attempts to reconstruct the 3D shape of endovascular devices from two orthogonal fluoroscopic views.1–4 This would allow creating virtual views from arbitrary angles or virtual endoscopic renderings in real time. The reconstruction requires a fast and accurate segmentation of the device in the fluoroscopic images, which are usually corrupted by noise. The purpose of this work is to present a noise reduction algorithm, geared to improve the separability of curve-linear structures in mask subtracted fluoroscopic images, to allow a more accurate segmentation of the device. This section gives a short review on previously published noise reduction algorithms. The proposed method is described in detail in Sec. 2.
The bilateral filter as published by Tomasi and Manduchi5 is probably one of the most popular algorithms. It uses two Gaussian functions to weight pixels in the local neighborhood according to their distance and the gray scale value difference with respect to the center pixel, thus reducing noise by retaining sharp edges in the image. This algorithm is used as a reference to evaluate the quality of the proposed algorithm. Anisotropic diffusion filters first introduced by Perona and Malik6 simulate a diffusion process of the gray scale values in an image by iteratively smoothing the image based on the gradient. The iterative nature of this process increases the computation time and makes it less suitable for real time applications. Wavelet shrinkage, also called wavelet (hard or soft) thresholding,7 is a family of noise reduction algorithms that reduces the detail coefficients in the wavelet domain of an image by a certain threshold reducing the high frequency noise in the reconstructed image. This method is also used as a reference in the evaluation.
A multiscale noise reduction filter specialized for the denoising of low dose x-ray images was published by Aach and Kunz,8 which applies a FIR/median hybrid filter to each high pass band of a Laplacian pyramid. The hybrid filter uses a cascade of median filters to calculate the denoised gray level from a linear prefiltering step. A different approach is taken in Refs. 9 and 10 using spatiotemporal filters, which include information of previous frames of a fluoroscopic image sequence. In Ref. 9, a Karhunen–Loève transform is used to calculate correlating components with adjacent frames. A penalty weighted least squares optimization is then performed on the component coefficients in order to determine the filtered image. Chan et al.10 propose a linear minimum mean square error filter derived from a noise model for the inherent quantum-limited Poisson noise in fluoroscopic image sequences.
Additionally, noise reduction methods for image sequences have been published outside the scope of fluoroscopy. A simple approach to reduce the noise in a series of images is frame averaging,11 where each pixel is compared to the previous and/or subsequent image frames instead of the local neighborhood. In the case of real time applications, obviously only the previous frames can be used. A multiframe denoising method based on wavelet soft thresholding was proposed by Mayer et al.,12 where the wavelet coefficients are reduced based on the consistency in multiple frames. Within the work presented here, however, multiframe techniques are not considered, since fast movements of the devices can cause artifacts in the denoised images.
The proposed algorithm is motivated by the fact that it is applied to background subtracted fluoroscopic images. Therefore, the image contains only the device and noise. The algorithm also takes advantage of the shape of the devices which are usually represented by a thin curvilinear structure. The algorithm estimates for each pixel in the image a line conformity measure that determines whether the point is part of a line using a set of binary masks. Depending on this value either a directional or isotropic filter kernel is applied. The intention is to only average pixels that belong to the same class (object or background).
2. ALGORITHM
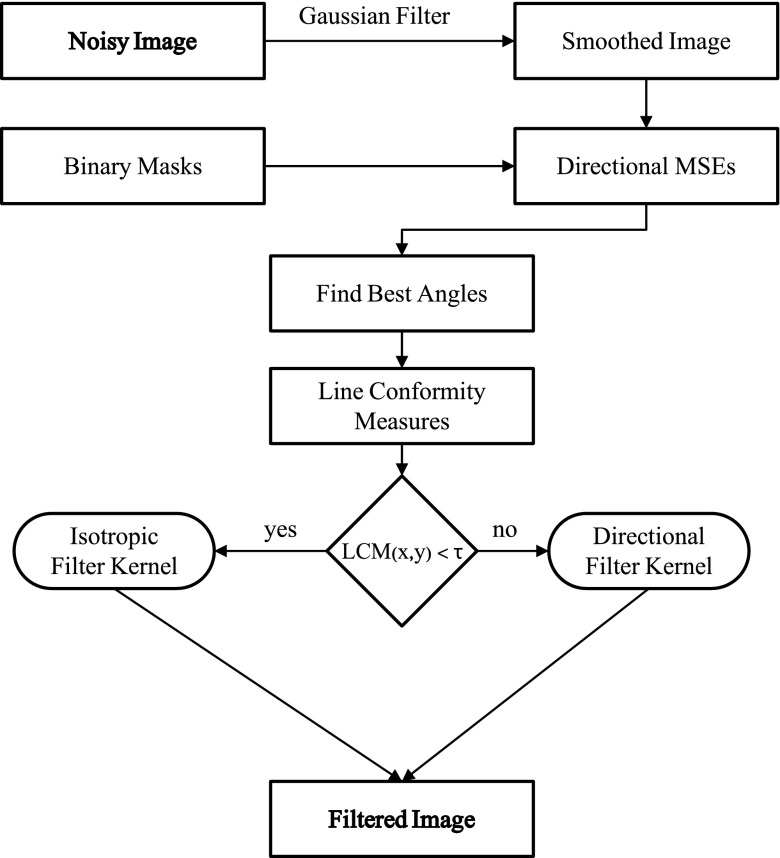
The proposed algorithm assumes subtracted fluoroscopic images where the anatomic background is removed by subtraction of a single previous image frame without device. It makes use of the curvilinear device structure using a set of binary masks Bα, where each represents a line in a different direction. For every point (x, y) in the image I(x, y), the algorithm estimates the best direction αmax(x, y) and a line conformity measure (LCM) to determine whether the point is part of a line in the respective direction. If LCM(x, y) is above a certain threshold τ, the angle αmax(x, y) determines the direction for the filter kernel at this point. Otherwise, an isotropic filter kernel is used instead. In the latter case, it is assumed that all pixels in the neighborhood N(x, y) are background pixels. Figure 1 outlines the work-flow of the algorithm.
FIG. 1.
Flow diagram of the proposed directional filter algorithm. Noisy image is smoothed with Gaussian filter to estimate the best filter kernel direction for each pixel using binary masks. A line conformity measure is calculated to determine whether an isotropic or directional kernel is used for each point of the filtered image.
2.A. Binary masks
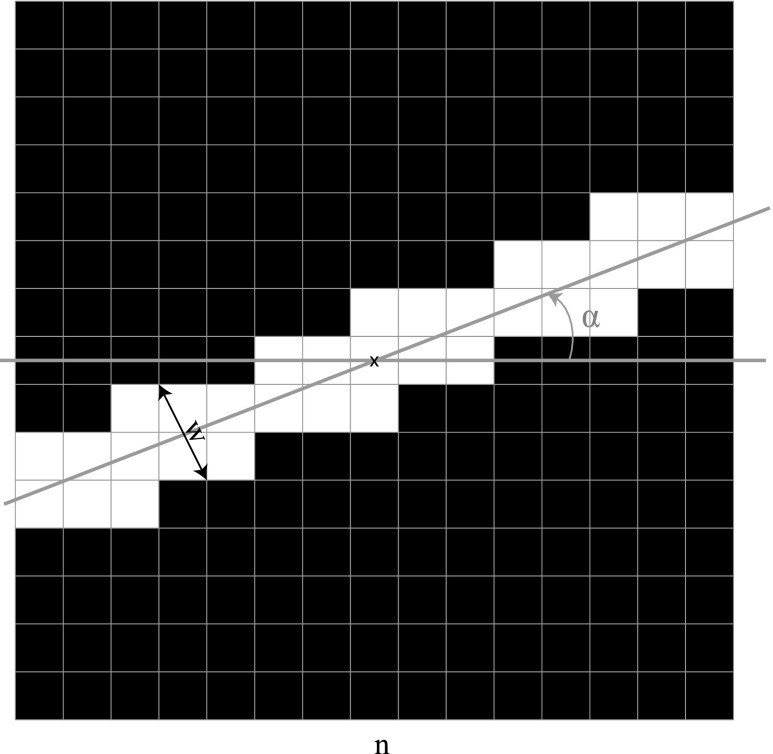
A set of m binary masks Bα of size n × n is created, where each represents a line through the center of the mask with angle α and width w. The angles α are determined by so that a uniform distribution on the interval 0 to π is achieved. Note that only the interval up to π has to be considered, since due to the point symmetry of the binary masks with respect to the center Bα = Bα+π. The parameter w is constant for all masks. The values for each point Bα(x, y) can be defined by
| (1) |
with
| (2) |
and
| (3a) |
| (3b) |
| (3c) |
Figure 2 shows an example of a binary mask with angle α and width w.
FIG. 2.
Example of a binary mask where white pixels represent ones and black pixels represent zeros. White pixels form a line with angle α with respect to the x-axis and width w.
2.B. Line conformity measure
In order to determine the best angle for the filter kernel at every point (x, y), a prefiltered image IG(x, y) is used, which is derived from I(x, y) by a convolution with a 2D Gaussian kernel with mean 0, standard deviation σ, and size g × g. Let Nxy be the set of pixels in the n × n neighborhood of pixel (x, y). The set of pixels that contribute to the LCM of direction α is then defined by . The mean squared error Dα(x, y) with respect to IG(x, y) for all pixels in is calculated for all angles α and all points in the image,
| (4) |
The best direction for the filter kernel at point (x, y) can then be determined as the angle that minimizes the mean squared error,
| (5) |
The line conformity measure, LCM(x, y), that determines whether a particular point is part of a line in direction is defined by Eq. (6), where is the arithmetic mean defined by ,
| (6) |
2.C. Filter kernels
Any isotropic low pass filter can be selected as undirected filter kernel. Within this work, a mean filter and a Gaussian filter kernel are used. The directional filter kernels can be derived from the undirected kernel by pixelwise multiplication with the binary mask . Three different filter combinations are compared and discussed within this work. They are listed in Table I. The rational behind filter type C is that in the isotropic case, if p(x, y) is very small it is likely that all pixels within the neighborhood are part of the background. Likewise, if p(x, y) is much bigger then τ, all pixels within are likely to be of the same type (object or background). In these cases, a mean filter kernel provides the best noise reduction. If p(x, y) is close to τ, a Gaussian kernel is used to also weight the pixels according to the distance from the center.
TABLE I.
Filter kernel combinations for isotropic and directional case.
| Isotropic kernel | Directional kernel | |
|---|---|---|
| Type A | Mean filter | Mean filter |
| Type B | Mean filter | Gaussian filter |
| Type C | Mean filter if | Mean filter if |
| LCM(x, y) < 0.5 ⋅ τ | LCM(x, y) > 1.5 ⋅ τ | |
| Gaussian filter otherwise | Gaussian filter otherwise |
3. MATERIALS AND EVALUATION METRICS
All algorithms are performed on an Intel Core i7 notebook (4 × 2.20 GHz) with 16 GB memory and a NVIDIA GeForce GT 640M graphics adaptor running a Microsoft Windows 7 (64 bit) operating system. The proposed algorithm is implemented for parallel execution on the GPU using the nvidia cuda platform. matlab R2013a (Mathworks, Natick, MA) is used to evaluate the results.
3.A. Data
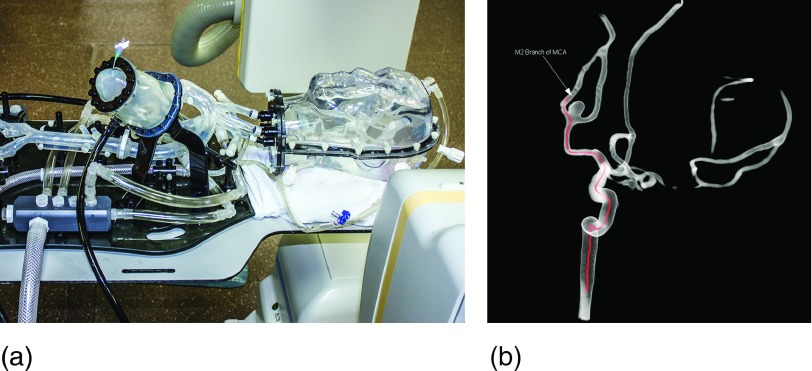
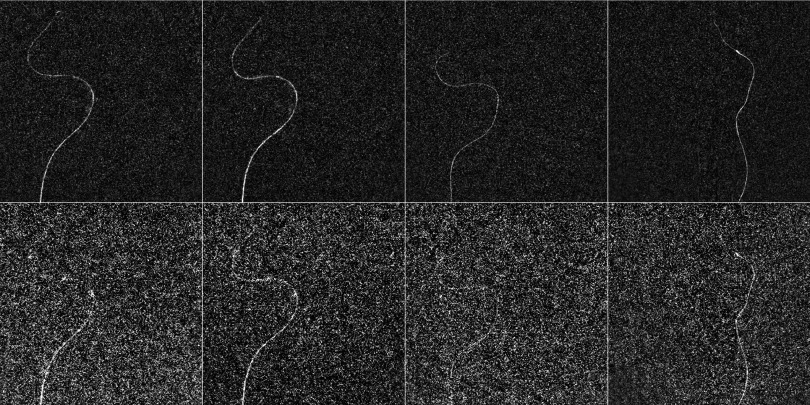
The image data for the evaluation are acquired using a clinical biplane angiography system (Artis Zee, Siemens Healthcare AG, Forchheim, Germany) and a vascular head phantom (Replicator, Vascular Simulations, Stony Brook, NY), providing a realistic configuration of the larger vessels in the human brain (see Fig. 3). The following experiment is performed for three different guidewires with a diameter of 0.014, 0.035, and 0.038 in. The device is brought into the M2 branch of the middle cerebral artery [see Fig. 3(b)] where fluoroscopic image sequences of the static device are acquired from an anterior–posterior (AP) and a lateral view simultaneously. Each image sequence is acquired with a different detector entrance exposure (45, 40, 36, 32, 29, 23, 18, 15, and 6 nGy/pulse) and contains about 50 frames. After removing the device from the phantom, a set of image sequences without device is acquired as masks for every x-ray dose. These mask images are subtracted from the device acquisitions in order to eliminate the background and allow a threshold based segmentation of the device. In order to create a high quality reference image which allows a reliable segmentation of the actual shape of the device (reference segmentation), the frames of each image sequence are averaged over time. The denoising filters are applied to single frames of the image sequences only. To avoid the influence of motion artifacts, the mask images are registered to the device images before subtraction using an elastic grid registration technique based on the method proposed in Ref. 13. Figure 4 shows an example of the subtracted noisy image frames at the highest and lowest x-ray dose.
FIG. 3.
(a) Vascular head phantom (Replicator, Vascular Simulations, Stony Brook, NY) in the biplane angiography syste (Artis Zee, Siemens Healthcare AG, Forchheim, Germany). (b) 3D reconstruction of the vasculature in the head phantom. Red line outlines guidewire path to M2 branch of MCA.
FIG. 4.
Noisy subtracted image frames for evaluation. From left to right: 0.038 in guidewire anterior–posterior (AP) view, 0.035 in guidewire AP view, 0.014 in guidewire AP view, and 0.014 in guidewire lateral view. The images in the first row were acquired with 45 nGy/pulse and the second row with 6 nGy/pulse.
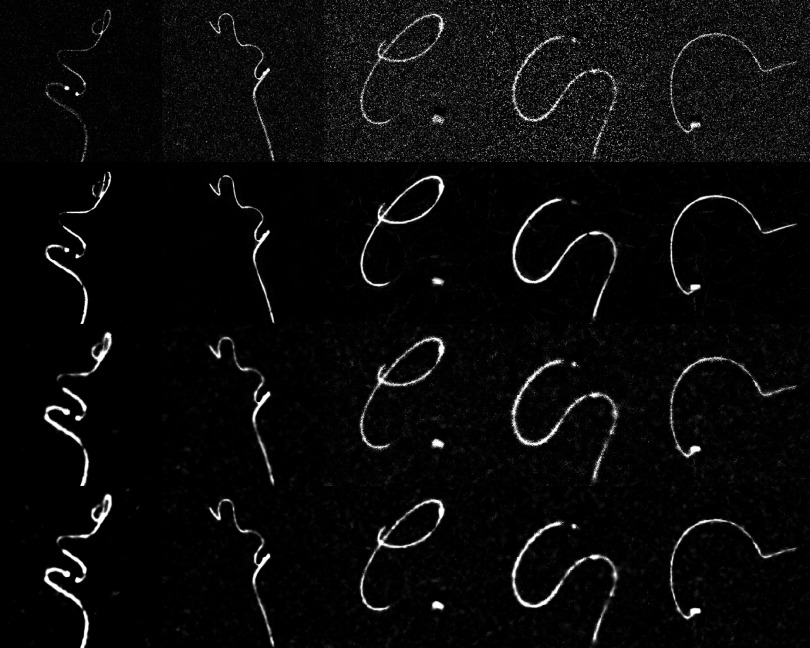
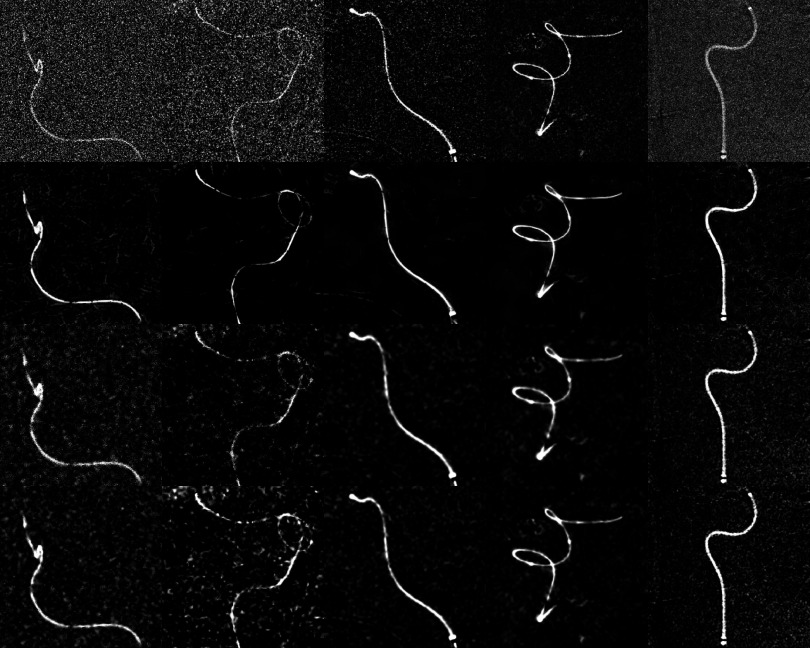
In addition to the acquired phantom images, a set of 10 clinical cases has been analyzed retrospectively. The data set includes 8 images showing a microcatheter and a guidewire, one coil being deployed from a microcatheter and one catheter filled with contrast agent. Detailed acquisition parameters can be found in Table II. The images are shown in Figs. 8 and 9.
TABLE II.
Description and acquisition parameters of the clinical data set used for the evaluation: Frame rate (fr) in fps, pixel size in mm, image size in pixel, and detector entrance exposure (DEE) in nGy.
| No. | Device type | Fr | Pixel size | Image size | DEE |
|---|---|---|---|---|---|
| 1 | Guidewire | 15 | 0.43 × 0.43 | 512 × 512 | 37 |
| 2 | Guidewire | 15 | 0.43 × 0.43 | 512 × 512 | 37 |
| 3 | Guidewire | 15 | 0.15 × 0.15 | 512 × 512 | 38 |
| 4 | Guidewire | 15 | 0.15 × 0.15 | 512 × 512 | 38 |
| 5 | Guidewire | 15 | 0.15 × 0.15 | 512 × 512 | 38 |
| 6 | Coil | 15 | 0.15 × 0.15 | 512 × 512 | 38 |
| 7 | Guidewire | 15 | 0.22 × 0.22 | 512 × 512 | 38 |
| 8 | Guidewire | 7.5 | 0.15 × 0.15 | 1440 × 1440 | 46 |
| 9 | Guidewire | 15 | 0.31 × 0.31 | 720 × 720 | 39 |
| 10 | Catheter | 7.5 | 0.15 × 0.15 | 720 × 720 | 46 |
FIG. 8.
Columns 1–5 show images of the first five clinical cases. Rows 1–4 show the original unfiltered images, after application of the directional filter, bilateral filter, and wavelet thresholding. All images show a guidewire and a microcatheter.
FIG. 9.
Columns 1–5 show images of the clinical cases 6–10. Rows 1–4 show the original unfiltered images, after application of the directional filter, bilateral filter, and wavelet thresholding. Image 1 shows a coil within a microcatheter, and images 2–4 show a guidewire and a microcatheter. Image 4 shows a microcatheter filled with contrast agent.
3.B. Evaluation metrics
To compare the quality of the filtered images, the separability of object (device) and background using global thresholding is analyzed. Therefore, the accuracy of the segmentation of the device in the filtered images compared to the reference segmentation is measured in terms of the pixelwise misclassification rate (MCR). The reference segmentation is created from the averaged reference images by manual threshold selection. For the filtered images, the ideal threshold that minimizes the misclassification rate is chosen automatically. Given the reference segmentation of the device Sref and the segmentation of the filtered image Sflt as a binary image, where device pixels are 1 and background pixels 0, the MCR can be calculated by
| (7) |
The segmentation of the device in the filtered image Iflt is given by
| (8) |
where
| (9) |
The second measure that is used for the quantitative evaluation of the results is the contrast to noise ratio (CNR) in the filtered images. It is calculated according to
| (10) |
where and are the arithmetic means of the background and device region in the filtered image, respectively, and σn is the standard deviation of the noise.
3.C. Alternative denoising algorithms for performance evaluation
The algorithm is compared to two different noise reduction algorithms. The bilateral filter as proposed by Tomasi and Manduchi5 calculates the denoised image Ibf(x, y) by weighting the pixels in the local (2 ⋅ k + 1) × (2 ⋅ k + 1) neighborhood by a combination of two Gaussian functions GD and GR with standard deviations σD and σR depending on spatial distance and gray level difference, respectively. The filtered image is given by Eq. (11). The algorithm is implemented using the nvidia cuda environment,
| (11a) |
| (11b) |
As a second noise reduction method, wavelet soft thresholding is used for comparison. It decomposes the image into wavelet coefficients using the double density dual tree complex wavelet transform.14 The detail coefficients C(x, y, l) at each decomposition level l are shrunk in order to eliminate high frequencies caused by noise. The inverse wavelet transform is then applied to the result to obtain the filtered image. The denoised wavelet coefficients Cflt(x, y, l) can be calculated by Eq. (12) using a smoothing parameter μ,
| (12) |
A matlab implementation of this algorithm is used provided by the Image Denoising Algorithms Archive (http://www5.cs.fau.de/research/software/idaa/) of the University of Erlangen-Nuremberg.
4. RESULTS
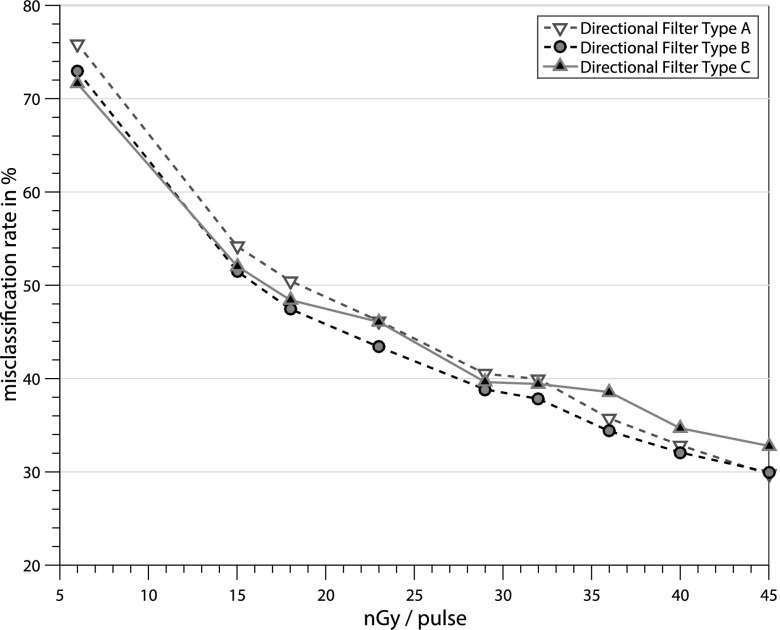
A single set of parameters has been used for each algorithm within this paper, independent of the noise level, the device, or pixel size. These parameters have been optimized to yield the best average results for the phantom evaluation. For the kernel types A and B, m = 11, w = 1.3, and τ = 2.2, as kernel size n = 25 for type A and n = 35 for B and C were used. Additionally, for kernel type C, the parameters m = 27, w = 1.5, and τ = 2.0 were used. Figure 5 shows the evaluation results of the different filter kernels for the directional filter algorithm at different x-ray dosages. Kernel type B achieves lower MCRs than kernel A for all x-ray dosages. Type C performs better for the highest noise level at 6 nGy/pulse but has higher MCRs at x-ray doses of 15 nGy/pulse and above.
FIG. 5.
Comparison of different kernel types for the directional filter algorithm for detector entrance exposure values from 6 nGy/pulse to 45 nGy/pulse. Type A: mean kernel for directional and isotropic case, type B: mean kernel for directional and Gaussian kernel for isotropic case, and type C: automatic selection of mean and Gaussian kernel depending on LCM(x, y) .
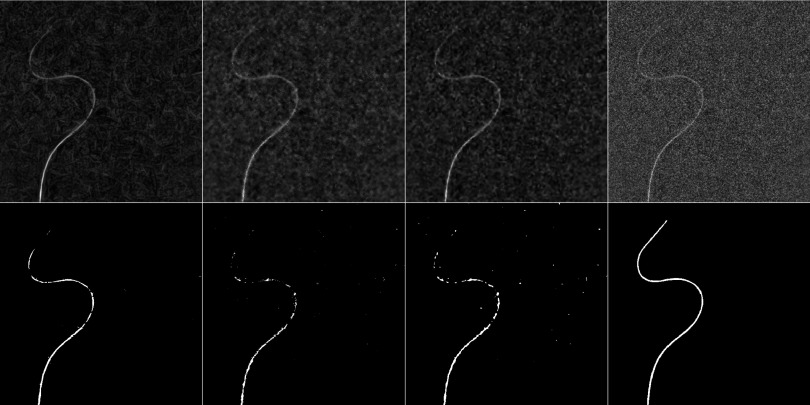
A comparison between the different noise reduction filters and the unprocessed images is presented in Fig. 6. The unprocessed images achieve average segmentation errors between 99.9% and 81.0% from the highest to the lowest noise level and a CNR between 1.0 and 2.3, respectively. For the bilateral filter, the best results were achieved using k = 5 and standard deviations σD = 3.5 and σR = 0.2. For the wavelet soft thresholding algorithm, a maximum decomposition level of lmax = 2 and μ = 0.07 was used. The directional filter approach achieves lower MCRs than both compared filter algorithms for all acquired noise levels. On average, the MCR of the proposed algorithm is 25.5% lower than the bilateral filter results. Compared to the wavelet approach, it is 17.2% lower on average. The CNR is improved by 29.0% on average compared to the bilateral filter and by 17.8% compared to the wavelet approach. A paired t-test was performed to test for statistical significance of the directional filter results compared to the second best results achieved by the wavelet thresholding approach. Significance (p < 0.05) of the MCR and CNR was achieved for all noise levels, and for detector entrance exposures of 15–29 nGy/pulse, significance of the MCR results could be shown for p < 0.01. Examples of the filtered images can be found in Fig. 7, which shows the filtered images and the device segmentation for each algorithm at an x-ray dose of 15 nGy/pulse along with the original noisy image and the reference segmentation. The quantitative results of the clinical data set are shown in Table III. The proposed filter achieves the lowest MCR with 28.3% and the highest CNR (10.3), followed by the wavelet thresholding approach with a MCR of 42.3% and a CNR of 6.1. Significance (p < 0.01) compared to the second best results could be shown for the MCR as well as the CNR results of the directional filter. The filtered images for all noise reduction algorithms are shown in Figs. 8 and 9.
FIG. 6.
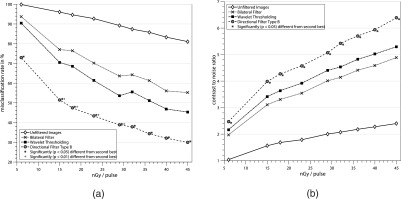
Comparison of proposed directional filter algorithm with the bilateral approach and wavelet soft thresholding for different detector entrance exposure values from 6 nGy/pulse to 45 nGy/pulse. Quality of the filtered images is measured in terms of the (a) misclassification rate of the device segmentation using an ideal threshold and (b) the contrast to noise ratio. Significantly better results compared to the second best are marked by ∗ for p < 0.05 and + for p < 0.01.
FIG. 7.
First row shows the filtered images of a 0.035 in. guidewire from an AP view at 15 nGy/pulse using the directional filter, bilateral filter, and wavelet soft thresholding (from left to right). The last image shows the original noisy image. The second row shows the results of the segmentation after applying the respective filters in the same order and the reference segmentation, obtained by averaging multiple frames of the acquired fluoroscopic image sequence in the last column.
TABLE III.
Quantitative results of the compared noise reduction algorithms in terms of the misclassification rate (MCR) in percent and the contrast to noise ratio (CNR). Significantly better results compared to the second best are marked by a for p < 0.05 and b for p < 0.01.
| Algorithm | MCR | CNR |
|---|---|---|
| Directional filter | 28.3a,b | 10.3a,b |
| Wavelet thresholding | 42.3 | 6.1 |
| Bilateral filter | 50.1 | 5.5 |
| Unfiltered | 85.5 | 2.0 |
4.A. Performance
The computation time for a 1024 × 1024 image is about 25 ms on average for the hardware used during the evaluation. The weight limiting step in the proposed algorithm is the estimation of the best kernel direction and the calculation of the line conformity measure. The computational effort of this step is linearly dependent on the number of ones in all binary masks. For one mask Bα, this can be estimated by calculating the area of a parallelogram with height n and base sinα ⋅ w,
| (13) |
In order to approximate the total number of ones o in all masks the average area over all angles α can be substituted which leads to
| (14) |
Therefore, a linear relation between the parameters m, n, and w, and the computational effort of the algorithm can be assumed.
5. DISCUSSION
The proposed algorithm significantly improves the separability of curve-linear structures in subtracted fluoroscopy images. Although the assumption that the shape of device can be approximated by piecewise linear segments can be critical for structures with high curvatures and small radii, respectively, even in these cases, a filter kernel in the tangential direction at every point of the curve will result in considerably less blurring than using an isotropic filter kernel. Additionally, using a Gaussian kernel for the directional case also assigns lower weights to pixels further from the center of the local neighborhood where the likelihood of a less accurate approximation of the curve is higher. In all evaluations, the proposed algorithm outperforms the compared bilateral filter and wavelet soft thresholding. The best results are achieved for the kernel type B, which uses a Gaussian filter kernel for the directional case. Comparing the optimized filter parameters for the different kernel types shows that the kernel size is much larger for types B and C (35 instead of 25), where a Gaussian kernel is used. This can be explained by the fact that it allows a better adjustment of the directional filter kernel at points where the device curves, and none of the binary masks is a good fit for large kernels. Emphasizing the center of the mask allows a better trade-off between noise reduction (better in large kernels) and the ability to fit a directional binary mask to a block of image pixels. The idea behind kernel type C was to use a mean filter kernel for points where the binary mask is a very good fit (p > > τ) or where there is a high probability for all pixels in the neighborhood to be background pixels (p < < τ) to achieve better noise reduction and to use the Gaussian filter for all other cases in order to reduce smoothing between device and background. However, Fig. 5 shows that only for the highest noise level at 6 nGy/pulse, this filter achieves the lowest MCR. For all other noise levels, kernel type B outperforms the other kernel types. The device segmentations that are shown in Fig. 7 for a relatively high noise level (15 nGy/pulse) also emphasize that the proposed algorithm improves the accuracy of the segmentation compared to the other algorithms. Only small parts at the tip of the guidewire where diameter of the device gets smaller are missing while for the bilateral filter and the wavelet thresholding approach, the amount of missed pixels in the segmentation of the device is considerably higher in addition to noise which is misclassified as device. This would allow a more accurate 3D reconstruction of the device and reduces artifacts caused by noise. An additional source for artifacts is patient motion due to the fact that the device segmentation is performed on subtracted images. If the patient’s position changes between the acquisition of the mask image and the current frame, curve-linear structures may arise in the subtracted images along the boundary of high contrast tissue such as bone. Like the device itself, these structures would also be enhanced by the proposed algorithm in terms of the contrast to noise ratio. However, the same is true for other noise reduction techniques. Even in unprocessed images, motion artifacts usually have high contrast already and therefore would cause severe reconstruction artifacts. Therefore, proper registration between the mask image and the current frame is essential for the segmentation of the device in the subtracted images for all noise reduction algorithms. The presented clinical data support the evaluation results of the phantom data set. The proposed algorithm performs better in terms of the misclassification rate as well as the contrast to noise ratio. The same parameters have been used for all images independent of the device thickness, the pixel size, and the detector entrance exposure. This suggests that the algorithm parameters are not very sensitive to these changes. The algorithm can also be implemented efficiently to run on modern graphics processing units and is therefore suitable for the application in a real time reconstruction frame work. Although the algorithm is specialized for background subtracted fluoroscopy images, other applications are possible. The algorithm provides a fast method for edge preserving noise reduction using directional adaptive filter kernels. The application of the algorithm as a preprocessing step for other segmentation task or for general image denoising could be investigated in the future. It should be mentioned that in cases where the algorithm is used as a preprocessing step and more noise robust segmentation methods are available and are compliant with the speed requirements of the application, the benefits of using the proposed algorithm in terms of the MCR might be smaller than for the thresholding approach. If the algorithm is applied to unsubtracted images where a simple differentiation between object and background pixels is not possible, the approach would smooth homogeneous areas in the image and adjust the filter kernel near edges or lines similar to other edge preserving denoising algorithms. Other possible enhancements for the proposed algorithms that could be investigated are the application of different filter kernels, e.g., a combination with the bilateral filter approach would be possible. In addition to that the set of binary masks could be extended to other shapes like curves or fuzzy masks could be used instead of binary masks with values between 0 and 1 to allow better adjustment of the masks to the underlying image pixels. Finally, the proposed algorithm could be easily extended to use multiple image frames of a dynamic image sequence. In this case, the kernel direction estimation and the line conformity measure calculation would be done on an average image of multiple frames. The denoised image would then be calculated on the average image for background pixels and on the current frame only for device pixels.
6. CONCLUSION
The proposed algorithm was able to successfully reduce the amount of noise in the images and therefore increase the quality of the device segmentations compared to both the bilateral filter and the wavelet thresholding approach for all acquired noise levels using rotating directional filter kernels near line structures and isotropic kernels for the background. The noise reduction method was evaluated using phantom as well as clinical data and showed a significant improvement of the segmentation accuracy and the image quality in terms of the contrast to noise ratio. The application of the proposed algorithm for the 3D reconstruction of curvilinear devices from two views would allow a more accurate reconstruction of the device. Additionally, it can be implemented efficiently on modern graphic processing units in order to use it within real time reconstruction frameworks. Other applications of the algorithm as a preprocessing step before segmentations or for general image denoising with a modified set of binary masks would also be possible and should be further investigated.
ACKNOWLEDGMENTS
Research reported in this publication was supported by the National Heart, Lung, and Blood Institute of the National Institutes of Health under Award No. R01HL116567. The content is solely the responsibility of the authors and does not necessarily represent the official views of the National Institutes of Health.
APPENDIX: NOMENCLATURE
- α
angle for line in binary mask
direction with lowest mean squared error
- σ
standard deviation of Gaussian smoothing kernel
- σD
standard deviation of GD
- σn
standard deviation of the noise
- σR
standard deviation of GR
- τ
threshold for directional or isotropic filter kernel
- θmin
segmentation threshold
- Bα
binary mask with angle α
- C
detail coefficients of wavelet decomposition of image I
- Cflt
filtered detail coefficients of wavelet decomposition
- Dα
directional mean squared error
- GD
Gaussian function for spatial distance weight (bilateral filter)
- GS
Gaussian function for gray level difference weight (bilateral filter)
- I
original noisy image
- Ibf
image after applying the bilateral filter
- Iflt
filtered image
- IG
smoothed version of image using Gaussian filter
- g
size of Gaussian smoothing kernel
- LCM
line conformity measure
- m
number of binary masks
- MCR
misclassification rate
- n
size of binary mask
- o
number of ones in all binary masks
- Sref
reference segmentation of the device
- Sflt
threshold segmentation of the device in filtered image Iflt
set of pixels in the neighborhood of point (x, y) where Bα is 1
arithmetic mean of the device region (z = 1) or background region (z = 0) in the filtered image
- w
width of line in binary mask
REFERENCES
- 1.Mistretta C. A., Oberstar E., Davis B., Brodsky E., and Strother C. M., “4d-dsa and 4d fluoroscopy: Preliminary implementation,” Proc. SPIE 7622, 762227 (2010). 10.1117/12.844561 [DOI] [Google Scholar]
- 2.Baert S. A. M., van de Kraats E. B., van Walsum T., Viergever M. A., and Niessen W. J., “Three-dimensional guide-wire reconstruction from biplane image sequences for integrated display in 3-d vasculature,” IEEE Trans. Med. Imaging 22, 1252–1258 (2003). 10.1109/TMI.2003.817791 [DOI] [PubMed] [Google Scholar]
- 3.Hoffmann M., Brost A., Jakob C., Koch M, Bourier F., Kurzidim K., Hornegger J., and Strobel N., “Reconstruction method for curvilinear structures from two views,” Proc. SPIE 8671, 86712F-1–86712F-8 (2013). 10.1117/12.2006346 [DOI] [Google Scholar]
- 4.Morales C. C., Radeva P., Toledo R., Villanueva J. J., and Mauri J., “3d curve reconstruction by biplane snakes,” in Proceedings of 15th International Conference on Pattern Recognition (IEEE, Los Alamitos, California, USA, 2000), pp. 563–566. [Google Scholar]
- 5.Tomasi C. and Manduchi R., “Bilateral filtering for gray and color images,” in Sixth International Conference on Computer Vision (IEEE, Los Alamitos, California, USA, 1998), pp. 839–846. [Google Scholar]
- 6.Perona P. and Malik J., “Scale-space and edge detection using anisotropic diffusion,” IEEE Trans. Pattern Anal. Mach. Intell. 12, 629–639 (1990). 10.1109/34.56205 [DOI] [Google Scholar]
- 7.Donoho D. L., “De-noising by soft-thresholding,” IEEE Trans. Inf. Theory 41, 613–627 (1995). 10.1109/18.382009 [DOI] [Google Scholar]
- 8.Aach T. and Kunz D., “Multiscale linear/median hybrid filters for noise reduction in low dose x-ray images,” in Proceedings of International Conference on Image Processing (IEEE, Los Alamitos, California, USA, 1997), Vol. 2, pp. 358–361. [Google Scholar]
- 9.Wang J., Zhu L., and Xing L., “Noise reduction in low-dose x-ray fluoroscopy for image-guided radiation therapy,” Int. J. Radiat. Oncol., Biol., Phys. 74, 637–643 (2009). 10.1016/j.ijrobp.2009.01.020 [DOI] [PubMed] [Google Scholar]
- 10.Chan C. L., Katsaggelos A. K., and Sahakian A. V., “Image sequence filtering in quantum-limited noise with applications to low-dose fluoroscopy,” IEEE Trans. Med. Imaging 12, 610–621 (1993). 10.1109/42.241890 [DOI] [PubMed] [Google Scholar]
- 11.Dubois E. and Sabri S., “Noise reduction in image sequences using motion-compensated temporal filtering,” IEEE Trans. Commun. 32, 826–831 (1984). 10.1109/TCOM.1984.1096143 [DOI] [Google Scholar]
- 12.Mayer M. A., Borsdorf A., Wagner M., Hornegger J., Mardin C. Y., and Tornow R. P., “Wavelet denoising of multiframe optical coherence tomography data,” Biomed. Opt. Express 3, 572–589 (2012). 10.1364/BOE.3.000572 [DOI] [PMC free article] [PubMed] [Google Scholar]
- 13.Deuerling-Zheng Y., Lell M., Galant A., and Hornegger J., “Motion compensation in digital subtraction angiography using graphics hardware,” Comput. Med. Imaging Graphics 30, 279–289 (2006). 10.1016/j.compmedimag.2006.05.008 [DOI] [PubMed] [Google Scholar]
- 14.Selesnick I. W., “The double-density dual-tree dwt,” IEEE Trans. Signal Process. 52, 1304–1314 (2004). 10.1109/TSP.2004.826174 [DOI] [Google Scholar]


