

Abstract
Background.
Physical inactivity and excess adiposity are thought to be interdependent “lifestyle” factors and thus, many older adults are at exaggerated risk for preventable diseases. The purposes of this study were to determine the degree of discordance between body mass index (BMI) and adiposity among adults older than 50 years, and to determine the extent to which direct measures of adiposity, and objectively measured sedentary behavior (SB) and physical activity (PA) are associated with insulin resistance (IR) or diabetes.
Methods.
A population representative sample of 2,816 individuals, aged 50–85 years, was included from the combined 2003–2006 National Health and Nutrition Examination Survey (NHANES) datasets. BMI, percent body fat (%BF) and android adiposity as determined by dual energy x-ray absorptiometry, objectively measured SB and PA, established markers of cardiometabolic risk, IR, and type 2 diabetes were analyzed.
Results.
Approximately 50% of the men and 64% of the women who were normal weight according to BMI had excessive %BF. Adults with the least SB and greatest moderate and vigorous PA exhibited the healthiest cardiometabolic profiles, whereas adults with the greatest SB and lowest activity had highest risk. Greater android adiposity stores were robustly associated with IR or diabetes in all adults, independent of SB and activity. Among men, less moderate-to-vigorous PA was associated with IR or diabetes; whereas among women, less lifestyle moderate activity was associated with IR or diabetes.
Conclusions.
Android adiposity and low moderate and vigorous PA are the strongest predictors of IR or diabetes among aging adults.
Key Words: Insulin resistance, Diabetes, Sedentary behavior, Obesity, Android adiposity, MVPA
There is ongoing controversy regarding the appropriate anthropometric screening methodology to apply for prediction of obesity-induced chronic disease risk (1,2). Although body mass index (BMI) is a valid metric for classifying the population into different risk categories, it does not discriminate between adipose tissue and muscle, or distribution of body fat (BF), and lacks sensitivity to identify nonobese individuals with excess adiposity (3). A 2010 report from the Third National Health and Nutrition Examination Survey (NHANES III) revealed that the normal weight obese (NWO) phenotype (defined as normal BMI and excessive BF) was independently associated with elevated cardiometabolic risk and cardiovascular mortality (4). Several studies have confirmed these findings across populations, and thus demonstrate the relative value of adiposity measures over single-compartment models such as BMI, for risk stratification of chronic diseases (3,5).
To add confusion, the well-described “obesity paradox” (6) indicates that individuals in higher BMI categories may enjoy protection from early mortality, a factor that seems to be largely influenced by either fitness (7) or aging and sickness (eg, frailty, cachexia, heart failure, etc.) (8–11). Indeed, sedentary aging adults are known to be at increased risk for weakness and sarcopenic obesity (12,13), which are in-turn primary drivers of musculoskeletal fragility (14–16), cardiometabolic abnormalities (17), and early all-cause mortality (18–20). Despite the obvious public health implication of improving the detection of cardiometabolic abnormalities (21,22) across body phenotypes (23), less is known about the potential explanatory drivers that mediate the link between diabetes risk and body habitus.
Of particular interest is the extraordinary rise in the number of recent papers revealing the negative health implications of chronic sedentary behavior (SB) (24–27); yet, little is actually known about how objectively measured SB confers risk in aging adults, independent of overall volume of activity, and/or across heterogeneous fat partitioning phenotypes. Therefore, the goals of this study were to estimate the degree of discordance between BMI and percent body fat (%BF) among a nationally representative sample of adults over the age of 50 years, to compare the relative contribution of overall adiposity versus abdominal adiposity as predictors of insulin resistance (IR) and diabetes in this population, and to evaluate the extent to which SB and physical activity (PA) mediates the associations between adiposity and elevated IR or diabetes risk.
Methods
Study Design and Sample
The NHANES is a program of studies designed to assess the health and nutritional status of adults and children in the United States. The NHANES 2003/2004 and 2005/2006 surveys were specifically chosen based on their wealth of relevant information pertaining to body composition, objective activity counts, and markers of cardiometabolic health. Of the 4,446 participants of the NHANES 2003–2006 who were 50 years and older, 2,816 had valid body composition data from dual-energy x-ray absorptiometry, 4 days of objectively measured activity, and the necessary blood samples obtained after an overnight fast and/or had nonfasting samples obtained for high-sensitivity C-reactive protein (hsCRP) and high-density lipoprotein–cholesterol.
Demographic and Anthropometrics Factors
Socio-demographic characteristics were all assessed by self-report during the in-home interview. Age was used as a continuous variable. Race/ethnicity was categorized as (1): non-Hispanic white (2), non-Hispanic black, and (3) Mexican American or other Hispanic. Education was categorized as (1): less than high school graduate (2), high school graduate/general educational development or equivalent, and/or some college or associate’s degree (eg, Associate of Arts or Associate of Science), and (3) college graduate or above.
Weight was measured using a digital Toledo scale (Mettler-Toledo International, Inc., Columbus, OH), and participants wore only underwear gown and foam slippers. Height was measured using a fixed stadiometer. BMI was calculated as weight in kilograms divided by height in meters squared (kg/m2). Standard categories were applied to determine if each participant was normal weight (18.5–24.9), overweight (25–29.9), or obese (≥30). Individuals with BMI <18.5kg/m2 were excluded, due to the known association between underweight status and diabetes risk in older adults (28). Waist circumference was measured to the nearest 0.1cm at the level of the iliac crest, and used in the analyses as a continuous variable.
Body Composition and Android Adiposity
The NHANES dual-energy x-ray absorptiometry scans were administered using a Hologic QDR-4500A fan-beam densitometer with Hologic software (Hologic Corp., Bedford, MA). Total lean mass, excluding bone mass, total fat mass, and total %BF were reported. Excess adiposity was defined with sex-specific cutoffs, at a level (≥25% for men and ≥35% for women) associated with increased cardiometabolic risk, and frequently used in the literature (3,5,29,30). In addition, the Hologic APEX software computed adipose tissue within the android area of a total body dual-energy x-ray absorptiometry scan. Located within the abdomen, android area is roughly the area around the waist between the mid-point of the lumbar spine and the top of the pelvis. Android adipose tissue thus represents the combined total of subcutaneous and visceral adipose tissue in the android anatomic region, and is presented in total grams, as well as relative to body mass (ie, android adiposity/body mass).
Phenotype Definitions
Phenotypes were defined on the combined basis of BMI categories and sex-specific %BF cutoffs. Four categories were created to classify participants as (1) “lean” (any BMI, but %BF < 25% for men or 35% for women) (2); “normal weight obesity” (NWO) (BMI < 25, and %BF ≥ 25% for men or 35% for women) (3); “Overweight BMI/Obese %BF” (BMI 25–29.9, and %BF ≥ 25% for men or 35% for women); and (4) “Obese BMI/Obese %BF” (BMI ≥ 30, and %BF ≥ 25% for men or 35% for women).
Cardiometabolic Parameters
Participants were tested on routine cardiometabolic parameters. Resting systolic and diastolic blood pressures were measured three to four times with a mercury sphygmomanometer by trained staff. Nonfasting serum measures of high-density lipoprotein–cholesterol and high-sensitivity C-reactive protein concentrations were measured. Fasting measures were obtained for triglycerides, plasma glucose, and insulin. The homeostasis model assessment was calculated according to the formula: (I 0 [μU/mL] × G 0 [mmol/L])/22.5. Glycated hemoglobin A1c was included as a diagnostic test for diabetes, which reflects average plasma glucose for the previous 2–3 months.
Subjects were classified with/without IR or diabetes, on the combined basis of self-report and laboratory data. Presence of IR or diabetes was either determined through self-report during the diabetes section (prefix DIQ) of the in-person questionnaire (ie, individual answered “yes” to the question “Other than during pregnancy, have you ever been told by a doctor or health professional that you have diabetes or sugar diabetes?”), and/or reflected by any one or more abnormal finding from the following (1): elevated fasting glucose (≥126mg/dL) (2), elevated GHB (≥6.5%) (31), and/or (3) a homeostasis model assessment score of ≥5.9, as recently determined and validated against hyperinsulinemic-euglycemic clamp by Tam and colleagues (32). Diabetes was not categorized into type 1 or 2. Therefore, participants with diabetes that had been diagnosed at age 30 years or younger, and/or that were being treated with only insulin alone were excluded, as they were considered likely to have type 1 diabetes.
Objective Activity Assessment
Habitual PA and SB were assessed in NHANES with an accelerometer (Actigraph 7164; Actigraph, LLC, Pensacola, FL), which provided an objective estimate of the intensity of bodily movement. The accelerometer was worn on the right hip during waking hours by participants for 7 days. In order to represent an individual’s typical behavior in the assessment of activity, at least 4 days of monitoring with at least 10 hours per day were necessary for inclusion. Lack of, or minimal movement (ie, <100 counts per minute [cpm]) recorded by the accelerometer was used to derive the nonsleeping time spent in SB, as previously documented (33). Accelerometer counts were also used to classify all worn time as time spent in light-intensity activity (100–759 cpm), lifestyle moderate activity (760–2019 cpm) (34,35), moderate-intensity PA (2020–5998 cpm), vigorous-intensity PA (≥5999 cpm), and MVPA (ie, the combined time in moderate- and vigorous-intensity PA). Total daily minutes of SB and each activity category were summed from all time spent and averaged across all valid days. However, since subjects wore the monitors for differing amounts of time, proportion of wear-time values were calculated for each subject to account for total number of minutes spent in SB and each activity category, relative to total time spent wearing the accelerometer. SB and PA were used as both continuous predictors/covariates of IR or diabetes, as well as categorical predictors, by examining prevalence across combined SB and MVPA tertiles (ie, nine total categories).
Statistical Analysis
All statistical analyses were conducted using SAS 9.3 (SAS Institute, Cary, NC). To obtain population-representative findings, analyses were conducted using sample weights for the combined 2003/2004 and 2005/2006 NHANES cycles, which accounts for the complex survey design (including oversampling), survey nonresponse, and poststratification. Descriptive characteristics were stratified by sex and body phenotype and are provided as means, standard errors, and percentages. Differences in these characteristics across phenotypes were tested using linear regression (proc surveyreg) and logistic regression (proc surveylogistic) for continuous and categorical variables respectively, after creating appropriate categories and dummy coding for each. A similar strategy was used to test differences for outcomes between men and women across equivalent body phenotypes (eg, lean, NWO, etc.). To test the weighted prevalence differences between men and women for diabetes, separate Rao–Scott chi-square tests were conducted with the proc surveyfreq procedure and appropriate strata, cluster, and weighting options. Scatterplots were used to illustrate the shape of the relationship between %BF and BMI for men and women separately.
To assess the odds of IR or diabetes in the entire sample, separate weighted, unadjusted, and adjusted logistic regression models were performed by gender. The effects of SB and each activity category on IR or diabetes risk were assessed with unadjusted and adjusted models. Correlations between measures of adiposity (%BF and android adiposity) and indicators of adiposity (BMI) were all high (r = 0.70–0.88; p < .001), thus various collinearity diagnostics were performed. Since collinearity diagnostics are not available in the SAS logit or surveylogistic statements, and moreover, considering that collinearity is an issue of the explanatory variables (and not the dependent variable), it was possible to estimate an equivalent model using multiple linear regression. In doing so, the “tol” “vif” and “collinoint” options were used to formally examine the extent of collinearity between predictors in the full adjusted models. Despite the fact that there were high correlation coefficients between measures of %BF, BMI, and android adiposity, no variance inflation factors were >5. Moreover, despite the fact that two tolerance values (BMI and android adiposity) were <0.40, which is also indicative of multicollinearity, all eigenvalues were <10. Therefore, we chose to eliminate BMI from the final models in favor of the two direct measures of adiposity, ie, %BF and android adiposity.
Results
Descriptive data are presented as weighted means, standard errors, and percentages across body phenotypes in Table 1. In the entire sample, obesity according to BMI was prevalent in both men (31.2%) and women (38.2%), but excess adiposity according to %BF was significantly more prevalent (81.8% in men and 88.5% in women; p < .001). BMI was strongly associated with %BF for both men (r = 0.73; p < .001) and women (r = 0.74; p < .001) (Figure 1); however, there was significant discordance in both sexes. According to the initial cross-tabulation between standard BMI categories and sex-specific %BF, 49.6% of the men, and 63.0% of the women classified as normal weight according to BMI (18.5–24.9) had excess adiposity according to %BF. Figure 2 illustrates the correlation and variability between BMI and android adiposity for men and women.
Table 1.
Demographic and Cardiometabolic Characteristics of the Study Population by Sex and Body Phenotype
| Men | Women | |||||||
|---|---|---|---|---|---|---|---|---|
| Lean (%BF) | Normal Weight Obesity (NWO) | Overweight BMI/ Obese %BF | Obese BMI/ Obese %BF | Lean (%BF) | Normal Weight Obesity (NWO) | Overweight BMI/Obese %BF | Obese BMI/ Obese %BF | |
| N (% sex-specific sample) | 246 (18.0) | 176 (12.9) | 511 (37.4) | 432 (31.6) | 208 (14.3) | 260 (17.9) | 433 (29.8) | 550 (38.0) |
| Age, years | 58.83 (0.53) | 64.15 (1.01)* | 61.34 (0.37)† | 59.84 (0.36) | 59.63 (0.79) | 62.96 (0.72)* | 63.29 (0.66)†,§ | 60.73 (0.49) |
| Mobility impairment status, % | 8.8 | 8.3 | 12.6† | 16.7‡ | 13.0* | 9.8 | 11.4 | 14.3 |
| Body mass index (BMI), kg/m2 | 23.35 (0.23)§ | 23.12 (0.11) | 27.54 (0.06)† | 34.42 (0.12)‡ | 21.36 (0.19) | 23.17 (0.10)* | 27.45 (0.06)† | 36.33 (0.24)‡,§ |
| Lean body mass, kg | 54.06 (0.59) | 49.26 (0.50)* | 57.33 (0.33)† | 67.03 (0.49)‡ | 37.04 (0.38)§ | 35.26 (0.26)*,§ | 39.47 (0.18)†,§ | 48.40 (0.41)‡,§ |
| Body fat, % | 21.65 (0.15) | 28.55 (0.18)* | 30.17 (0.17)† | 34.36 (0.23)‡ | 30.79 (0.23)§ | 39.83 (0.23)*,§ | 42.36 (0.18)†,§ | 46.48 (0.15)‡,§ |
| WC, cm | 89.08 (0.61)§ | 93.13 (0.61)*,§ | 102.78 (0.35)†,§ | 118.33 (0.50)‡,§ | 78.84 (0.64) | 85.10 (0.67)* | 95.44 (0.40)† | 112.04 (0.59)‡ |
| Android adipose tissue (kg) | 1.13 (0.03)§ | 1.96 (0.06)*,§ | 2.61 (0.04)†,§ | 3.72 (0.06)‡ | 1.06 (0.04) | 1.76 (0.04)* | 2.42 (0.02)† | 3.71 (0.05)‡ |
| Objective physical activity | ||||||||
| Total sedentary behavior, min (% wear time) | 525.90 (57.1) | 535.36 (63.7) | 530.82 (60.3)§ | 533.72 (62.2) | 503.67 (57.8) | 508.96 (59.7) | 510.73 (59.1) | 523.63 (61.1) |
| Total light activity, min (% wear time) | 268.31 (29.5) | 238.36 (27.2)*,§ | 248.58 (28.2)†,§ | 248.98 (27.9)‡ | 289.83 (31.9) | 276.59 (31.5) | 275.20 (31.9) | 260.09 (31.0)‡ |
| Total lifestyle moderate activity, min (% wear time) | 99.83 (10.5) | 69.86 (7.2)* | 90.15 (9.4) | 80.45 (8.3)‡ | 90.14 (8.3) | 71.30 (7.5)* | 70.44 (7.6)†,§ | 62.10 (7.0)‡,§ |
| Total MVPA, min (% wear time) | 30.97 (2.9) | 18.20 (1.9)* | 22.51 (2.2)† | 17.24 (1.6)‡ | 22.75 (2.0)§ | 13.36 (1.3)*,§ | 13.35 (1.3)†,§ | 8.76 (1.0)‡,§ |
| Glucose, mg/dL | 106.14 (1.09)§ | 103.97 (2.49) | 110.16 (1.57) | 120.23 (2.55)‡ | 97.10 (2.83) | 101.78 (1.43) | 110.12 (2.05)† | 116.37 (1.51)‡ |
| Insulin, μU/mL | 7.04 (0.25) | 7.61 (0.70) | 11.29 (0.53)† | 17.83 (1.43)‡ | 4.61 (0.29) | 6.62 (0.39)* | 10.65 (0.57)† | 15.61 (1.09)‡ |
| HOMA | 1.82 (0.07) | 2.00 (0.18) | 3.31 (0.17)† | 5.51 (0.42)‡ | 1.15 (0.08) | 1.81 (0.19)* | 3.33 (0.23)† | 4.74 (0.40)‡ |
| Glycohemoglobin, % | 5.66 (0.08)§ | 5.56 (0.06) | 5.62 (0.04) | 6.02 (0.05)‡ | 5.46 (0.05) | 5.51 (0.05) | 5.68 (0.03)† | 5.97 (0.04)‡ |
| Diabetes, % | 16.7§ | 15.5 | 22.8† | 39.2‡ | 13.0 | 12.0 | 21.2† | 37.3‡ |
| Triglycerides, mg/dL | 117.11 (5.55)§ | 154.72 (11.61)*,§ | 156.52 (5.63)† | 166.79 (4.99)‡ | 99.65 (6.43) | 136.23 (4.30)* | 149.80 (4.25)† | 157.41 (2.70)‡ |
| Total cholesterol, mg/dL | 196.51 (2.93) | 196.97 (3.26)* | 201.38 (1.85) | 202.16 (1.81) | 202.94 (3.70) | 223.96 (2.79)*,§ | 218.58 (3.32)†,§ | 212.25 (2.22)‡,§ |
| HDL-cholesterol, mg/dL | 57.07 (1.14)§ | 52.37 (1.30)*,§ | 48.56 (0.71)†,§ | 45.42 (0.34)‡,§ | 70.26 (1.65) | 66.34 (0.82)* | 60.58 (0.54)† | 55.30 (0.58)‡ |
| hsCRP, mg/dL | 0.31 (0.02) | 0.46 (0.07)† | 0.35 (0.02) | 0.46 (0.03)‡ | 0.29 (0.05) | 0.43 (0.04) | 0.45 (0.03)†,§ | 0.71 (0.04)‡,§ |
| Systolic blood pressure, mmHg | 129.71 (1.66) | 131.39 (0.87) | 130.59 (1.02) | 131.39 (1.03) | 126.78 (0.74) | 131.27 (1.18) | 133.71 (0.99)† | 134.37 (0.64)‡ |
| Diastolic blood pressure, mmHg | 73.64 (0.91) | 72.11 (0.47) | 74.94 (0.77) | 74.83 (0.66) | 72.43 (0.55) | 72.90 (0.57) | 72.22 (0.55) | 73.88 (0.39) |
Note: Lean: Body fat < 25% (males), or 35% (females). Normal weight obesity: BMI < 25 and body fat ≥ 25% (males) or 35% (females). Overweight BMI/Obese BF%: BMI ≥ 25 but < 30 and body fat > 25% (males), or 35% (females). Obese BMI/Obese BF%: BMI ≥ 30 and body fat > 25% (males), or 35% (females). NWO-normal weight obesity; BMI-body mass index; %BF-percentage of fat; WC-waist circumference; HOMA-homeostasis model of assessment; HOMA-IR-homeostasis model of assessment, insulin resistant; HDL-high density lipoprotein/ hsCRP-high sensitivity C-reactive protein.
*Significant difference between lean and NWO (p < .01).
†Significant difference between lean and overweight BMI-obese BF% (p < .01).
‡Significant difference between lean and obese BMI-obese BF% (p < .01).
§Significant difference between men and women in equivalent BMI/BF% category (p < .05): Denoted as group with higher risk.
Figure 1.

Scatter plot depicting the correlation between body mass index (BMI) and percent body fat (%BF) for the whole sample, by sex. The vertical line represents the standard BMI cutoff for obesity (BMI ≥ 30). The horizontal lines represent the sex-specific %BF cutoffs for obesity in men (≥ 25%) and women (≥ 35%).
Figure 2.
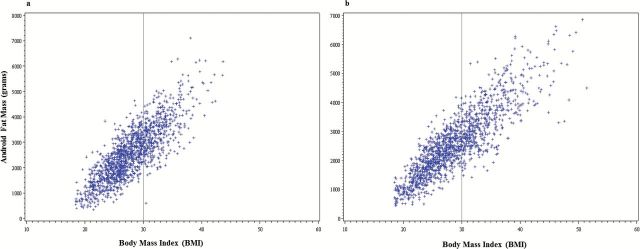
Scatter plot depicting the correlation between body mass index (BMI) and android adiposity for men (a) and women (b). The vertical line represents the standard BMI cutoff for obesity (BMI ≥ 30).
Phenotype Differences
Participants in the lean phenotype were slightly younger, had smaller waist circumferences and less android adiposity, were more active, and had lower cardiometabolic risk profiles for nearly every outcome. There was a statistically significant difference in several cardiometabolic parameters between lean and NWO phenotypes; however, the greatest differences in all factors were noted between the lean versus Obese BMI/Obese %BF phenotypes. The prevalence of IR or diabetes was 26.1% in men and 25.3% in women. Prevalence of IR or diabetes was significantly higher in overweight and obese adults, as compared to the lean category, but there were no differences in prevalence between adults in the lean and NWO phenotypes. Prevalence of IR or diabetes was significantly greater for individuals with the lowest MVPA (30.4%–32.7%; p < .001), as compared to moderate MVPA (25.5%–27.4%) and high MVPA (10.6%–17.0%) (Figure 3). Among aging adults with the highest MVPA (~25–35 minutes for women and men, respectively), there were no differences in age-adjusted prevalence of IR or diabetes across SB tertiles (p > .05).
Figure 3.

Prevalence differences in insulin resistance or diabetes across MVPA and sedentary behavior tertiles.
Table 2 provides the unadjusted odds ratios (ORs) for individual predictors of IR or diabetes, as well as a separate model adjusted for potential covariates. In the unadjusted model, lower education, being non-Hispanic black, being Hispanic or Mexican American, presence of mobility impairment, higher %BF, greater android adiposity, greater SB (women only), and less activity across all categories, were each individually associated with higher odds of having IR or diabetes. Low MVPA carried the strongest overall OR of 3.76 (95% confidence interval [CI], 2.11–6.69) and 3.45 (95% CI, 2.61–4.57) for men and women, respectively. After adjustment for all model predictors, lower education (women only), being non-Hispanic black (both men and women), being Hispanic or Mexican American (both men and women), greater android adiposity (both men and women), both lower tertiles of lifestyle moderate activity (women only), and both lower tertiles of MVPA (men only), were significantly associated with higher odds of IR or diabetes.
Table 2.
Unadjusted and Multivariate-Adjusted Odds Ratios for IR or Diabetes
| Unadjusted | Multivariable Adjusted* | |||
|---|---|---|---|---|
| Model Predictors | Men | Women | Men | Women |
| Race/ethnicity | ||||
| Non-Hispanic white | 1 [Reference] | 1 [Reference] | 1 [Reference] | 1 [Reference] |
| Non-Hispanic black | 1.85 (1.46-2.36) | 2.47 (2.01-3.04) | 2.81 (1.63-4.84) | 2.61 (1.48-4.60) |
| Hispanic or Mexican American | 1.66 (1.15-2.38) 0.95-1.47) | 1.78 (1.22-2.60) | 2.85 (1.68-4.82) | 2.82 (1.41-7.12) |
| Highest level of education | ||||
| <HS graduate | 1.86 (1.29-2.68) | 2.89 (1.90-4.37) | 1.79 (0.83-3.87) | 3.31 (1.57-6.99) |
| HS graduate and/or some college | 1.23 (0.88-1.72) | 1.92 (1.29-2.89) | 1.38 (0.74-2.60) | 2.75 (1.36-5.58) |
| ≥College graduate | 1 [Reference] | 1 [Reference] | 1 [Reference] | 1 [Reference] |
| Total percent body fat† | ||||
| Percent body fat, per 10% | 3.01 (2.36-3.83) | 2.20 (1.76-2.74) | 0.97 (0.88-1.06) | 0.42 (0.24-0.73) |
| Total android adiposity | ||||
| Android adiposity, per 1 kg | 1.59 (1.40-1.79) | 1.66 (1.41-1.95) | 1.79 (1.14-2.78) | 2.33 (1.72-3.15) |
| Sedentary behavior (<100 counts per min) | ||||
| First tertile (least SB) | 1 [Reference] | 1 [Reference] | 1 [Reference] | 1 [Reference] |
| Second tertile | 1.26 (0.86-1.84) | 1.04 (0.72-1.49) | 1.19 (0.57-2.50) | 0.85 (0.46-1.56) |
| Third tertile | 1.31 (0.90-1.93) | 1.41 (1.01-2.08) | 1.72 (0.89-3.31) | 1.42 (0.75-2.66) |
| Light activity (100–759 cpm) | ||||
| First tertile | 1.64 (1.13-2.40) | 1.98 (1.49-2.64) | 1.05 (0.54-2.02) | 0.86 (0.48-1.56) |
| Second tertile | 1.21 (0.82-1.79) | 0.77 (0.53-1.10) | 1.01 (0.62-1.63) | 0.43 (0.23-0.81) |
| Third tertile (most activity) | 1 [Reference] | 1 [Reference] | 1 [Reference] | 1 [Reference] |
| Lifestyle moderate (760–2019 cpm) | ||||
| First tertile | 3.09 (1.90-5.09) | 4.38 (3.04-6.29) | 1.20 (0.49-2.96) | 2.91 (1.10-8.60) |
| Second tertile | 1.42 (0.97-2.07) | 2.07 (1.44-2.98) | 0.76 (0.44-1.20) | 1.85 (1.01-3.90) |
| Third tertile (most activity) | 1 [Reference] | 1 [Reference] | 1 [Reference] | 1 [Reference] |
| Moderate/vigorous PA (≥2020 cpm) | ||||
| First tertile | 3.76 (2.11-6.69) | 3.45 (2.61-4.57) | 2.80 (1.41-5.58) | 1.37 (0.51-3.86) |
| Second tertile | 2.63 (1.60-4.32) | 2.30 (1.70-3.12) | 2.36 (1.21-4.59) | 1.23 (0.73-2.09) |
| Third tertile (most activity) | 1 [Reference] | 1 [Reference] | 1 [Reference] | 1 [Reference] |
Note: HS-high school; SB-sedentary behavior; PA-physical activity.
*Each factor in the table is adjusted for every other factor.
†Total percent body fat was included in the unadjusted and adjusted multivariable models, and is presented by 10% unit increments.
‡Diabetes is defined as ≥ 1 criteria for type 2 diabetes, including elevated fasting plasma glucose (≥126mg/dL); elevated Glycohemoglobin (≥6.5%); elevated homeostasis model assessment (HOMA) of insulin resistance value (≥5.9); and/or self-reported type 2 diabetes diagnosis.
Relative android adiposity was independently and robustly associated with IR or diabetes, such that for men and women, the odds of IR or diabetes increased by 2.07 (95% CI, 1.39–3.09), 3.01 (95% CI, 2.01–4.51), and 6.08 (95% CI, 4.13–8.93) for each incrementally greater quartile of android fat to body mass ratio. After adjustment for all PA, this association was only minimally attenuated: 1.69 (95% CI, 1.15–2.50), 2.44 (95% CI, 1.43–4.15), and 4.54 (95% CI, 2.88–7.17). This suggests that variability in SB and PA patterns may not mediate the associations between greater android adiposity and IR or diabetes risk among aging adults.
Discussion
The principal finding of this study was the significant discrepancy observed between classifications of overweight and obesity according to BMI, and direct measures of adiposity. Since BMI is still readily used in clinical settings, many aging adults go undetected for risk of chronic cardiometabolic diseases. In fact, nearly half of all men and over 60% of the women classified as normal weight according to BMI (18.5–24.9) had excess adiposity (ie, “Normal Weight Obese”). BMI has been shown to have poor sensitivity to detect excess adiposity in various previous studies (3), and thus it fails to identify many aging individuals with elevated risk.
Lowering the BMI cutoff for obesity would effectively decrease the false negative rate, ie, a negative result obtained from individuals in whom obesity is actually present. Although misclassifying individuals as “overweight” or “obese” who are not may certainly prompt negative psychosocial repercussions, the implications of misclassifying millions of aging adults as healthy when they might actually be at risk, inevitably delays interventions that could reduce the burden of cardiometabolic diseases. These findings may have been exaggerated by comparing a stringent and potentially arbitrary %BF threshold scheme against an already conservative BMI threshold scheme-a true risk threshold may lie somewhere in between. However, these results do highlight the need for clinicians to be aware of the risk of excess adiposity in older adults, even in individuals with a “normal” BMI. The discordance and variability between BMI thresholds and body composition has been well-described in the past (36,37); however, the question remains as to the long-term health implications across body phenotypes. Indeed, even among the individuals characterized as NWO, clinical markers of cardiometabolic risk were only marginally elevated above those of lean subjects. Based on these data, and regardless of gender and sociodemographic factors, it appears that true risk is pronounced for individuals who have larger android adiposity depots. This is supportive of a recent meta-analysis which demonstrated that, in comparison to metabolically healthy normal-weight individuals, obese persons are at increased risk for adverse long-term outcomes even in the absence of metabolic abnormalities (38). In fact, we found that android adiposity was actually the strongest predictor of IR and diabetes in this population, even after adjustment for total body adiposity, sociodemographic covariates, and known behavioral predictors such as SB and PA.
However, and although excess android adiposity itself contributes to the pathophysiologic milieu of chronic disease, the adipogenic process is merely a side effect of chronic disequilibrium between energy overconsumption and/or under-utilization. Various lifestyle factors pertaining to poor nutrition and lack of daily PA have received the bulk of attention as underlying factors to potentiate the risk for chronic disease in later adulthood. During the past few years, chronic SB has been touted as one of the strongest independent drivers for cardiometabolic disease and early mortality (24–26). The bulk of this previous work has revealed self-reported sitting time as a cross-sectional and longitudinal predictor of disease and mortality, even after adjusting for BMI and PA. These findings are extremely important and provide the foundation for which lifestyle modification recommendations and public health interventions can be implemented. However, what has remained to be determined is the extent to which SB independently mediates the link between adiposity and IR or diabetogenic outcomes.
Thus, using data from accelerometry, we were able to assess objectively measured SB and PA across phenotypes, as well as to determine if the total volume of SB was indeed associated with diabetes. Interestingly, there were no differences in time spent in SB across phenotypes of greater BMI and %BF; however, there were significant differences for both men and women in time spent in MVPA, such that “lean” adults participated in the most (~31min for men and ~23min for women), and obese adults (by BMI and %BF) participated in the least (~17min for men and ~9min for women). Simple linear regression revealed an association between time spent in SB and IR or diabetes among women. However, after adjusting for sociodemographic factors, adiposity, and total PA, the association between SB and IR or diabetes became nonsignificant. These results are somewhat contradictory to another recent NHANES study which revealed that, among adults aged 65 years and older, the associations between SB and various cardiometabolic health outcomes was not ameliorated by MVPA participation (39). However, the use of a significantly lower cut point for MVPA (>760 cpm vs 2020 cpm) in this previous work may have diminished the potential mediating effects of true moderate and vigorous exercise among older adults. It is also quite plausible that by dichotomizing the MVPA variable to “differentiate those with sufficient activity to meet the recommended amount of ≥150 min·wk−1 of MVPA in bouts of at least 10min,” the ability to detect a statistically significant mediating effect in a fairly homogeneous sample was greatly diminished. As the authors highlighted, older adults represent the most sedentary age group, spending approximately 60%–70% of their waking hours in SB (40). Thus, in the context of PA for health in adults over the age of 50 years, our findings suggest that moderate and vigorous PA be regarded as a continuous variable, and modifiable behavior that can significantly influence risk for IR and diabetes.
Our study also differs from other previous work in that we adjusted for total daily activity, at all accelerometer count levels greater than SB. Once these analyses were performed, the association between time spent in SB and IR or diabetes risk was diminished. Previous failures to make this adjustment may have artificially inflated the negative effects of SB, due merely to the residual influences originating from other activities unaccounted for (eg, true time spent in moderate and/or vigorous activity). Indeed, time spent in lifestyle moderate activity and MVPA were independently associated with lower odds of IR or diabetes in women and men, respectively. It is imperative that future studies account for all activity when assessing the contribution of any specific “intensity” cut point or range of intensities from accelerometers, as doing so will provide a true estimate of the independent association with the outcome of interest.
As with any cross-sectional study, a limitation in this investigation is the inability to distinguish the actual causal link between related exposures and outcomes. Our findings certainly cannot discount the importance of promoting lifestyle modifications that lead to reductions in SB, nor do they prove a disassociation between chronic SB and obesity-related cardiometabolic abnormalities. They do, however, highlight the relative value of moderate and vigorous PA accumulation, independent of SB at <100 cpm, to attenuate risk. It is quite possible that the magnitude of the association between SB and clustering of cardiometabolic risk would be influenced by the chosen cut point of the exposure variable, as was recently demonstrated in children (41). In that case, a higher cut point in the current study might have produced a stronger association, but such findings could have been less useful in comparing results across studies or cohorts, and would have limited generalizability.
Clinical diagnostic screening should be modified to account for android adiposity, as this was independently and robustly associated with IR or diabetes risk in both men and women. Interestingly, once android adiposity was entered in the full model, the association between %BF and IR or diabetes was completely eliminated. This suggests that incorporating body composition as a predictor for cardiometabolic diseases might only be useful as a proxy representative of abdominal adiposity in men. Conversely, and as an important point of clarification, among women the association between %BF and IR or diabetes risk was reversed when android adiposity is included in the model. This finding may support the growing evidence that subcutaneous fat in women (especially lower body) may serve a protective role in metabolic outcomes (42). For both men and women, the associations between relative android adiposity (ie, android fat mass/body mass), was not mediated by SB or PA patterns. Thus, in addition to recommending replacement of SB with regular moderate and vigorous PA, this study supports the clinical value of screening for android (abdominal) adiposity with waist circumference monitoring. Future prospective work is needed to distinguish the attributable risk of habitual participation across differing doses or combinations of daily activity.
Funding
This study was funded by the National Institutes of Health: R24 HD065702-03 (M. Peterson & S. Al Snih). Dr. Peterson is funded by the National Institutes of Health (1KO1 HD074706). Dr. Burant is funded by the Robert C. and Veronica Atkins Foundation and the Michigan Nutrition Obesity Research Center (DK089503).
Conflict of interest
The authors report no conflicts of interest.
Acknowledgments
The authors would like to acknowledge the University of Texas Medical Branch Claude D. Pepper Center (P30-AG024832), and the Michigan Institute for Clinical & Health Research (2UL1TR000433-06). The funders had no role in the design and conduct of the study; the collection, analysis, and interpretation of the data; or the preparation, review, or approval of the manuscript.
References
- 1. Flegal KM, Kit BK, Orpana H, Graubard BI. Association of all-cause mortality with overweight and obesity using standard body mass index categories: a systematic review and meta-analysis. JAMA. 2013;309:71–82. 10.1001/jama.2012.113905 [DOI] [PMC free article] [PubMed] [Google Scholar]
- 2. Willett WC, Hu FB, Thun M. Overweight, obesity, and all-cause mortality. JAMA. 2013;309:1681. 10.1001/jama.2013.3075 [DOI] [PubMed] [Google Scholar]
- 3. Okorodudu DO, Jumean MF, Montori VM, et al. Diagnostic performance of body mass index to identify obesity as defined by body adiposity: a systematic review and meta-analysis. Int J Obes (Lond). 2010;34:791–799. 10.1038/ijo.2010.5 [DOI] [PubMed] [Google Scholar]
- 4. Romero-Corral A, Somers VK, Sierra-Johnson J, et al. Normal weight obesity: a risk factor for cardiometabolic dysregulation and cardiovascular mortality. Eur Heart J. 2010;31:737–746. 10.1093/eurheartj/ehp487 [DOI] [PMC free article] [PubMed] [Google Scholar]
- 5. Gómez-Ambrosi J, Silva C, Galofré JC, et al. Body mass index classification misses subjects with increased cardiometabolic risk factors related to elevated adiposity. Int J Obes (Lond). 2012;36:286–294. 10.1038/ijo.2011.100 [DOI] [PubMed] [Google Scholar]
- 6. Lavie CJ, Milani RV, Ventura HO. Obesity and cardiovascular disease: risk factor, paradox, and impact of weight loss. J Am Coll Cardiol. 2009;53:1925–1932. 10.1016/j.jacc.2008.12.068 [DOI] [PubMed] [Google Scholar]
- 7. McAuley PA, Kokkinos PF, Oliveira RB, Emerson BT, Myers JN. Obesity paradox and cardiorespiratory fitness in 12,417 male veterans aged 40 to 70 years. Mayo Clin Proc. 2010;85:115–121. 10.4065/mcp.2009.0562 [DOI] [PMC free article] [PubMed] [Google Scholar]
- 8. Kulminski AM, Arbeev KG, Kulminskaya IV, et al. Body mass index and nine-year mortality in disabled and nondisabled older U.S. individuals. J Am Geriatr Soc. 2008;56:105–110. [DOI] [PubMed] [Google Scholar]
- 9. Burger AJ, Han Y, Aronson D. The relationship between body mass index and mortality in patients with acute decompensated heart failure. Int J Cardiol. 2009;134:132–135. 10.1016/j.ijcard.2007.12.047 [DOI] [PubMed] [Google Scholar]
- 10. Oreopoulos A, Padwal R, Kalantar-Zadeh K, Fonarow GC, Norris CM, McAlister FA. Body mass index and mortality in heart failure: a meta-analysis. Am Heart J. 2008;156:13–22. 10.1016/j.ahj.2008.02.014 [DOI] [PubMed] [Google Scholar]
- 11. Fonarow GC, Srikanthan P, Costanzo MR, Cintron GB, Lopatin M. Committee ASA, et al. An obesity paradox in acute heart failure: analysis of body mass index and inhospital mortality for 108,927 patients in the Acute Decompensated Heart Failure National Registry. Am Heart J. 2007;153:74–81. [DOI] [PubMed] [Google Scholar]
- 12. Kortebein P, Symons TB, Ferrando A, et al. Functional impact of 10 days of bed rest in healthy older adults. J Gerontol A Biol Sci Med Sci. 2008;63:1076–1081. [DOI] [PubMed] [Google Scholar]
- 13. Ryu M, Jo J, Lee Y, Chung YS, Kim KM, Baek WC. Association of physical activity with sarcopenia and sarcopenic obesity in community-dwelling older adults: the Fourth Korea National Health and Nutrition Examination Survey. Age and ageing. 2013. 10.1093/ageing/aft063 [DOI] [PubMed] [Google Scholar]
- 14. Nielson CM, Srikanth P, Orwoll ES. Obesity and fracture in men and women: an epidemiologic perspective. J Bone Miner Res. 2012;27:1–10. 10.1002/jbmr.1486 [DOI] [PubMed] [Google Scholar]
- 15. Tuttle LJ, Sinacore DR, Mueller MJ. Intermuscular adipose tissue is muscle specific and associated with poor functional performance. J Aging Res. 2012;2012:172957. 10.1155/2012/172957 [DOI] [PMC free article] [PubMed] [Google Scholar]
- 16. Pasco JA, Gould H, Brennan SL, Nicholson GC, Kotowicz MA. Musculoskeletal deterioration in men accompanies increases in body fat. Obesity (Silver Spring). 2014;22:863–867. 10.1002/oby.20496 [DOI] [PubMed] [Google Scholar]
- 17. Lim S, Kim JH, Yoon JW, et al. Sarcopenic obesity: prevalence and association with metabolic syndrome in the Korean Longitudinal Study on Health and Aging (KLoSHA). Diabetes Care. 2010;33:1652–1654. 10.2337/dc10-0107 [DOI] [PMC free article] [PubMed] [Google Scholar]
- 18. Balboa-Castillo T, Guallar-Castillón P, León-Muñoz LM, Graciani A, López-García E, Rodríguez-Artalejo F. Physical activity and mortality related to obesity and functional status in older adults in Spain. Am J Prev Med. 2011;40:39–46. 10.1016/j.amepre.2010.10.005 [DOI] [PubMed] [Google Scholar]
- 19. Ruiz J, Sui X, Lobelo F, et al. Association between muscular strength and mortality in men: prospective cohort study. BMJ. 2008;337:a439. 10.1136/bmj.a439 [DOI] [PMC free article] [PubMed] [Google Scholar]
- 20. Xue QL, Beamer BA, Chaves PH, Guralnik JM, Fried LP. Heterogeneity in rate of decline in grip, hip, and knee strength and the risk of all-cause mortality: the Women’s Health and Aging Study II. J Am Geriatr Soc. 2010;58:2076–2084. 10.1111/j.1532-5415.2010.03154.x [DOI] [PMC free article] [PubMed] [Google Scholar]
- 21. Carnethon MR, De Chavez PJD, Biggs ML, et al. Association of weight status with mortality in adults with incident diabetes. JAMA. 2012;308:581–590. 10.1001/jama.2012.9282 [DOI] [PMC free article] [PubMed] [Google Scholar]
- 22. Wildman RP, Muntner P, Reynolds K, McGinn AP, Rajpathak S, Wylie-Rosett J, et al. The obese without cardiometabolic risk factor clustering and the normal weight with cardiometabolic risk factor clustering: prevalence and correlates of 2 phenotypes among the US population (NHANES 1999–2004). Archives of internal medicine. 2008;168:1617–1624. 10.1001/archinte.168.15.1617 [DOI] [PubMed] [Google Scholar]
- 23. Flegal KM, Shepherd JA, Looker AC, et al. Comparisons of percentage body fat, body mass index, waist circumference, and waist-stature ratio in adults. Am J Clin Nutr. 2009;89:500–508. 10.3945/ajcn.2008.26847 [DOI] [PMC free article] [PubMed] [Google Scholar]
- 24. Du H, Bennett D, Li L, et al. Physical activity and sedentary leisure time and their associations with BMI, waist circumference, and percentage body fat in 0.5 million adults: the China Kadoorie Biobank study. Am J Clin Nutr. 2013;97:487–496. 10.3945/ajcn.112.046854 [DOI] [PMC free article] [PubMed] [Google Scholar]
- 25. van der Ploeg HP, Chey T, Korda RJ, Banks E, Bauman A. Sitting time and all-cause mortality risk in 222 497 Australian adults. Arch Intern Med. 2012;172:494–500. 10.1001/archinternmed.2011.2174 [DOI] [PubMed] [Google Scholar]
- 26. Katzmarzyk PT, Church TS, Craig CL, Bouchard C. Sitting time and mortality from all causes, cardiovascular disease, and cancer. Med Sci Sports Exerc. 2009;41:998–1005. 10.1249/MSS.0b013e3181930355 [DOI] [PubMed] [Google Scholar]
- 27. Matthews CE, George SM, Moore SC, et al. Amount of time spent in sedentary behaviors and cause-specific mortality in US adults. Am J Clin Nutr. 2012;95:437–445. 10.3945/ajcn.111.019620 [DOI] [PMC free article] [PubMed] [Google Scholar]
- 28. Sairenchi T, Iso H, Irie F, Fukasawa N, Ota H, Muto T. Underweight as a predictor of diabetes in older adults: a large cohort study. Diabetes Care. 2008;31:583–584. [DOI] [PubMed] [Google Scholar]
- 29. Romero-Corral A, Somers VK, Sierra-Johnson J, et al. Diagnostic performance of body mass index to detect obesity in patients with coronary artery disease. Eur Heart J. 2007;28:2087–2093. [DOI] [PubMed] [Google Scholar]
- 30. Romero-Corral A, Somers VK, Sierra-Johnson J, et al. Accuracy of body mass index in diagnosing obesity in the adult general population. Int J Obes (Lond). 2008;32:959–966. 10.1038/ijo.2008.11 [DOI] [PMC free article] [PubMed] [Google Scholar]
- 31. International Expert C. Nathan DM, Balkau B, Bonora E, Borch-Johnsen K, Buse JB, et al. International Expert Committee report on the role of the A1C assay in the diagnosis of diabetes. Diabetes care. 2009;32:1327–1334. 10.2337/dc09-9033 [DOI] [PMC free article] [PubMed] [Google Scholar]
- 32. Tam CS, Xie W, Johnson WD, Cefalu WT, Redman LM, Ravussin E. Defining insulin resistance from hyperinsulinemic-euglycemic clamps. Diabetes Care. 2012;35:1605–1610. 10.2337/dc11-2339 [DOI] [PMC free article] [PubMed] [Google Scholar]
- 33. Maher CA, Mire E, Harrington DM, Staiano AE, Katzmarzyk PT. The independent and combined associations of physical activity and sedentary behavior with obesity in adults: NHANES 2003-06. Obesity (Silver Spring). 2013;21:E730–E737. 10.1002/oby.20430 [DOI] [PMC free article] [PubMed] [Google Scholar]
- 34. Camhi SM, Sisson SB, Johnson WD, Katzmarzyk PT, Tudor-Locke C. Accelerometer-determined moderate intensity lifestyle activity and cardiometabolic health. Prev Med. 2011;52:358–360. 10.1016/j.ypmed.2011.01.030 [DOI] [PubMed] [Google Scholar]
- 35. Matthew CE. Calibration of accelerometer output for adults. Med Sci Sports Exerc. 2005;37(11 Suppl):S512–S522. [DOI] [PubMed] [Google Scholar]
- 36. Heo M, Faith MS, Pietrobelli A, Heymsfield SB. Percentage of body fat cutoffs by sex, age, and race-ethnicity in the US adult population from NHANES 1999-2004. Am J Clin Nutr. 2012;95:594–602. 10.3945/ajcn.111.025171 [DOI] [PubMed] [Google Scholar]
- 37. Jean N, Somers VK, Sochor O, Medina-Inojosa J, Llano EM, Lopez-Jimenez F. Normal-weight obesity: implications for cardiovascular health. Curr Atheroscler Rep. 2014;16:464. 10.1007/s11883-014-0464-7 [DOI] [PubMed] [Google Scholar]
- 38. Kramer CK, Zinman B, Retnakaran R. Are metabolically healthy overweight and obesity benign conditions?: A systematic review and meta-analysis. Ann Intern Med. 2013;159:758–769. 10.7326/0003-4819-159-11-201312030-00008 [DOI] [PubMed] [Google Scholar]
- 39. Gennuso KP, Gangnon RE, Matthews CE, Thraen-Borowski KM, Colbert LH. Sedentary Behavior, Physical Activity, and Markers of Health in Older Adults. Med Sci Sports Exerc. 2013; 45:1493–1500. 10.1249/MSS.0b013e318288a1e5 [DOI] [PMC free article] [PubMed] [Google Scholar]
- 40. Matthews CE, Chen KY, Freedson PS, et al. Amount of time spent in sedentary behaviors in the United States, 2003-2004. Am J Epidemiol. 2008;167:875–881. 10.1093/aje/kwm390 [DOI] [PMC free article] [PubMed] [Google Scholar]
- 41. Atkin AJ, Ekelund U, Møller NC, et al. Sedentary time in children: influence of accelerometer processing on health relations. Med Sci Sports Exerc. 2013;45:1097–1104. 10.1249/MSS.0b013e318282190e [DOI] [PubMed] [Google Scholar]
- 42. Tchkonia T, Thomou T, Zhu Y, et al. Mechanisms and metabolic implications of regional differences among fat depots. Cell Metab. 2013;17:644–656. 10.1016/j.cmet.2013.03.008 [DOI] [PMC free article] [PubMed] [Google Scholar]