

Abstract
Dendritic protrusions (spines and filopodia) are structural indicators of synapses that have been linked to neuronal learning and memory through their morphological alterations induced by development and experienced-dependent activities. Although previous studies have demonstrated that depriving sensory experience leads to structural changes in neocortical organization, the more subtle effects on dendritic protrusions remain unclear, mostly due to focus on only one specific cell type and/or age of manipulation. Here, we show that sensory deprivation induced by whisker trimming influences the dendritic protrusions of basilar dendrites located in thalamocortical recipient lamina (IV and VI) of the mouse barrel cortex in a layer-specific manner. Following 1 month of whisker trimming after birth, the density of dendritic protrusions increased in layer IV, but decreased in layer VI. Whisker regrowth for 1 month returned protrusion densities to comparable level of age-matched controls in layer VI, but not in layer IV. In adults, chronic sensory deprivation led to an increase in protrusion densities in layer IV, but not in layer VI. In addition, chronic pharmacological blockade of N-methyl-d-aspartate receptors (NMDARs) increased protrusion density in both layers IV and VI, which returned to the control level after 1 month of drug withdrawal. Our data reveal that different cortical layers respond to chronic sensory deprivation in different ways, with more pronounced effects during developmental critical periods than adulthood. We also show that chronically blocking NMDARs activity during developmental critical period also influences the protrusion density and morphology in the cerebral cortex.
Keywords: barrel cortex, dendritic spines, deprivation, development, filipodia, sensory
Introduction
How sensory experience can influence the development of neural circuitry is a fundamental question of modern neurobiology. Studies have described the circuitry and development of the whisker-to-barrel pathway with emphasis on the intra/intercellular mechanisms that govern activity-dependent synaptic plasticity as a result of changes in sensory experience (for reviews see Feldman and Brecht 2005; Fox and Wong 2005; Holtmaat and Svoboda 2009; Fu and Zuo 2011). Large-scale reorganization of the barrel cortex was first described by Van der Loos and Woolsey (1973), demonstrating that the formation of barrel cortex topographic pattern was dramatically disrupted when vibrissae follicles were ablated after birth. However, once the animals matured past a critical developmental period, the same follicle ablations no longer affected barrel pattern formation (Weller and Johnson 1975; Woolsey and Wann 1975). Moreover, depriving sensory experience after birth, in addition to altering whisker-related behavior (Carvell and Simons 1996) also affects the physiological properties of barrel cortical neurons (Simons and Land 1987; Lee et al. 2007; Popescu and Ebner 2010), resulting in alteration of the size of their receptive field, as well as the strength of their responses to whisker deflections (Keller and Carlson 1999; Knott et al. 2002; Barrera et al. 2013).
A body of research has pinpointed the structural basis of the observed behavioral and physiological alterations that result from sensory deprivation (Zuo, Yang, et al. 2005; McRae et al. 2007; Chen, Tam, et al. 2012, also see Feldman and Brecht 2005). More recently, there has been focus on even more subtle aspects, such as the impact of sensory experience on morphological development of dendritic arborizations and spines (Zuo, Yang, et al. 2005; Briner et al. 2010; Chen, Tam, et al. 2012), which are the predominant locations of excitatory inputs onto pyramidal neurons (Harris and Kater 1994; Segal 2005; Harms and Dunaevsky 2007). Dendritic spines and filopodia are highly motile structures (Lendvai et al. 2000; Oray et al. 2004; Cruz-Martin et al. 2010), and it has been shown that depriving animals of sensory experience during development influences spine elimination and motility in areas such as the primary somatosensory and visual cortices (Oray et al. 2004; Zuo, Yang, et al. 2005). Although these studies have found that experience-dependent changes can induce dendritic and spine plasticity in superficial layers of the cortex, its full effect(s) on the principal thalamocortical recipient layers (layers IV and VI), remains largely undiscovered, especially regarding detailed quantitative analyses on spine morphological alterations.
In this study, we investigated the development of dendritic protrusions (spines and filopodia) in pyramidal neurons located in the main thalamocortical recipient layers of mouse primary somatosensory cortex. We first describe the normal maturational profile of dendritic spines and filopodia (morphology and density) in the barrel cortex, followed by description of the disrupted pattern of these parameters due to peripheral manipulations of sensory experience. In addition, we restored the sensory experience to test if recovery of tactile sensation after early postnatal development can ameliorate the impacts of sensory deprivation. We report that chronic sensory deprivation affectss dendritic protrusions in a profound way, and restoring sensory experience provides partial recovery of dendritic spine density, depending on the cortical layer.
Materials and Methods
Animals and Experimental Groups
The selection and treatment of experimental animals were followed as previously described (McRae et al. 2007; Chen, Tam, et al. 2012) and in accordance with the Queens College, CUNY Institutional Animal Care and Use Committee (protocol #100) and NIH guidelines for the humane treatment of animals. CD-1 male and female mice obtained from pregnant mothers (purchased from Charles River Laboratories) were kept in standard laboratory housing with unlimited access to food and water. For the developmental profile portion of the study, we investigated untreated control animals at different developmental time points: Postnatal day (P) 15, 30, 60, 100, and 130, making this a cross-sectional study investigating their dendritic protrusions (also see Table 2 for numbers of animals, neurons, and dendritic protrusions per condition). These postnatal periods were chosen based on our observation that P15 is the earliest postnatal day that we see dendritic protrusions labeled consistently with our Golgi staining protocol. Additionally, we have previously characterized the effect of sensory deprivation and restoration on dendritic architecture, as well as myelin density and extracellular matrix development in P30 and P60 animals (McRae et al. 2007; Chen, Tam, et al. 2012; Barrera et al. 2013). P100 and P130 were chosen based on the fact that mice have reached adulthood by P100, and we wanted to utilize the same duration of sensory deprivation in adult trimmed animals as neonatal trimmed animals, thus P130 was chosen. In the sensory deprivation/restoration portion of the study, mice were randomly assigned to control, sensory deprivation (via whisker trimming, see below), or N-methyl-d-aspartate receptor (NMDAR) blockage group, a subsequent sensory restoration and a NMDAR antagonist withdrawal group. For the chronic sensory deprivation group, whiskers were unilaterally or bilaterally trimmed from P0 to P30. For the NMDAR blockage group, mice were administered MK801 twice daily from P0 to P30 in the dosage that was previously established (Zuo, Yang, et al. 2005). For the sensory restoration group, sensory-deprived mice were allowed 30 days for their whiskers to regrow before their brains were analyzed. For the NMDAR antagonist withdrawal group, mice administered MK801 were allowed 30 days without the drug before sacrifice. The P15 group was an independent cohort, while the P30 control and P30 trim (unilateral and bilateral) were siblings housed together as were the P60 regrow and P60 control groups. The P100 group was an independent cohort and the P100–130 bilateral trim and P130 controls were siblings housed together.
Table 2.
The number of animals and reconstructed neurons in various conditions (normal sensory experience (control) vs. treatment groups)
| Age and condition of animals | Cortical layer | No. of animals | No. of reconstructed neurons | No. of counted/categorized dendritic protrusions per condition |
|---|---|---|---|---|
| P15, normal sensory experience | IV | 4 | 19 | 1882 |
| P15, normal sensory experience | VI | 4 | 16 | 1836 |
| P30, normal sensory experience | IV | 5 | 25 | 2157 |
| P30, normal sensory experience | VI | 5 | 22 | 2426 |
| P30, unilaterally trimmed P0–30 | IV | 5 | 14 | 1712 |
| P30, bilaterally trimmed P0–30 | IV | 5 | 16 | 1884 |
| P30, bilaterally trimmed P0–30 | VI | 5 | 23 | 1996 |
| P30, MK801 inject P0–30 | IV | 3 | 17 | 2327 |
| P30, MK801 inject P0–30 | VI | 3 | 18 | 2632 |
| P60, normal sensory experience | IV | 4 | 19 | 1877 |
| P60, normal sensory experience | VI | 4 | 17 | 1623 |
| P60, bilateral regrow P31–60 | IV | 4 | 13 | 1591 |
| P60, bilateral regrow P31–60 | VI | 4 | 14 | 1779 |
| P60, MK801 withdraw P31–60 | IV | 3 | 12 | 1400 |
| P60, MK801 withdraw P31–60 | VI | 3 | 13 | 1454 |
| P100, normal sensory experience | IV | 6 | 18 | 1349 |
| P100, normal sensory experience | VI | 6 | 19 | 1490 |
| P130, normal sensory experience | IV | 7 | 15 | 2822 |
| P130, normal sensory experience | VI | 7 | 15 | 2644 |
| P130, bilaterally trimmed P100–130 | IV | 6 | 15 | 3454 |
| P130, bilaterally trimmed P100–130 | VI | 6 | 14 | 2847 |
Sensory Deprivation and Restoration
Each animal from a litter of CD-1 mice was arbitrarily assigned at birth to be either the control or sensory-deprived (whisker trim) condition. The animals' tails were tattooed according to the experimental condition for identification purposes. For the sensory-deprived animals, their whiskers on the mystacial pad were manually clipped by precision microscissors as close to the base of the follicle as possible every other day for the animals' first 30 postnatal days. Brief administration (∼1 min) of anesthesia (5% isoflurane, Aerrane in 100% O2) was used from P14 to prevent the animals from moving during the trimming procedure. The within-litter control method was followed: all animals were exposed to the same conditions such as bedding texture, food and water source, maternal influence, anesthesia, handling, and so forth. The control animals were handled, anesthetized, and returned to the cage on the same trimming session as the sensory-deprived animals. For the animals that were selected in the sensory restoration condition, we simply stopped trimming and allowed the whiskers to grow back for 1 month after P30. We also performed an ear punch at P31 for the purpose of identifying which animals belong to the regrow condition, so we could discern these experimental animals from their control littermates at P60. For the adult sensory deprivation portion of the study, trimming commenced from when the animals reached P100 and were trimmed every other day and sacrificed at P130.
MK801 Injection and Withdraw
Previous findings have implicated the importance of glutamatergic activities in influencing the dendritic arborization as well as dendritic protrusions, particularly the NMDAR (McAllister et al. 1996; Racca et al. 2000; Zuo, Yang, et al. 2005). To explore the role of NMDARs in the density and morphology of dendritic protrusions, we intraperitoneally injected MK801 (Sigma-Aldrich), a noncompetitive NMDAR blocker (0.25 μg g−1 body weight) twice per day (as per Zuo, Yang, et al. 2005), starting from the P0. As MK801 is a hypothermic inducer, the cages were kept artificially above room temperature for 1 h after administering MK801 for the purpose of reducing the mortality rate of the experimental animals. Typical mortality of MK801-injected animals during the first postnatal week is ∼80–85% without placing the pups in above room temperature conditions. Placing them 1 h in above room temperature (∼28–30 °C) decreased the mortality rate to ∼50% during the first postnatal week. Similar to the sensory deprivation portion of the study, the animals' tails were tattooed according to the experimental condition for identification purposes. For the animals that were selected in the drug withdrawal condition, we stopped administering MK801 after P30. We also performed an ear punch at P31 for the purpose of identifying which animals belong to the drug-withdrawal condition, so we can discern these experimental animals from their control littermates at P60.
Golgi Impregnation and Identification of Pyramidal Neurons in Layer IV and VI in the Barrel Cortex
Brains were processed with our Golgi protocol as previously described (Chen et al. 2009; Chen, Lu, et al. 2012; Chen, Tam, et al. 2012). In brief, after the establishment of anesthesia (0.3 mL euthasol per animal, Henry Schein, Inc.), brains were immediately removed, rinsed with double distilled water, and transferred to a Golgi–Cox solution composed of potassium dichromate, mercuric chloride, and potassium chromate that comes bundled within the FD Rapid GolgiStain™ Kit (FD Neurotechnologies, Inc.). The brains were stored at room temperature for 12–14 days in a glass bottle and transferred to a cryoprotectant solution stored at 4 °C for at least another week in the dark. The brains were next rapidly frozen with dry ice and quickly embedded in Neg-50™ (ThermoFisher Scientific) and cut at 180–200 µm in the coronal plane with a freezing cryostat. This section thickness was chosen by test-and-trial basis for optimized optical clarity of dendrites and dendritic protrusions while simultaneously preserving the integrity of neuronal morphology. Sections were transferred onto triple-coated gelatin-dipped slides and allowed to air-dry at room temperature in the dark for ∼4–5 days. Following drying, sections were rehydrated with double distilled water, reacted in a developing solution (FD Neurotechnologies, Rapid Golgi Stain Kit), and dehydrated with 50%, 75%, 95%, and 100% ethanol (in double distilled H2O), respectively. Finally, sections were defatted in xylene-substitute (SafeClearII, ThermoFisher Scientific) and cover-slipped using Permount (ThermoFisher Scientific). Golgi staining was chosen as it is a standard method to investigate the qualitative and morphometric properties of neurons in the cerebral cortex (Lorente de Nó 1949; Woolsey and Wann 1975; White 1978; Harris and Woolsey 1981; Lund and Wu 1997; Prieto and Winer 1999; Furtak et al. 2007; Chen et al. 2009; Chen, Tam, et al. 2012; Chen, Lu, et al. 2012), and was well suited to our needs to fully label a subset of neurons in the barrel cortex.
In order to accurately identify the barrel cortex, the characteristic cluster of cells found in granular and supragranular layers were observed (see Chen et al. 2009; Chen, Lu, et al. 2012; Chen, Tam, et al. 2012) and then matched with an atlas of a Golgi-stained mouse brain (Valverde 1998). The anterior limit of the barrel cortex was identified by the appearance of the anterior commissure, and the posterior limit of barrel cortex was identified by the separation of corpus callosum at the longitudinal fissure. Golgi-stained pyramidal neurons in layers IV and VI were identified on opposite borders of the large pyramidal neurons characteristic of layer V. Layer VI was defined as previously described, in which layer VIa borders the large pyramidal neurons in layer V, and layer VIb is immediately superior and lateral to the white matter (Chen et al. 2009). Pyramidal neurons in layer IV are distinguished from layer Va pyramidal neurons by observing that their apical dendrites do not extend to the pia mater, and by the co-occurrence of spiny stellate cells in the same layer.
Neuron Selections and Spine Classification
Imaging of neurons and their respective dendritic protrusions (basilar dendrites of pyramidal neurons those somata located in layers IV and VI, respectively) was accomplished with the Neurolucida 8.0 system (MBF Bioscience, Inc.) and an Olympus Bx51 microscope equipped with a high-resolution digital camera (Optronics Microfire), a mechanical stage (Ludl, Thornwood, NY), and an x-y-z-axes encoder connected to a dedicated Windows XP Pentium 4 PC. Neurons were initially imaged under ×4 (0.1 Numerical Aperture [NA]), ×10 (0.25 NA), and ×20 (0.8 NA) magnifications showing layers IV and VI (Fig. 1A,B), with the selection of candidate pyramidal neurons for future reconstruction and dendritic protrusion analyses, for the purpose of tracking somatic and dendritic locations. Owing to the absence of a definitive spiny stellate cell homolog in layer VI, we chose to focus only on layer IV and VI pyramidal neurons to obtain a fair cell-type comparison across these 2 thalamocortical recipient layers.
Figure 1.
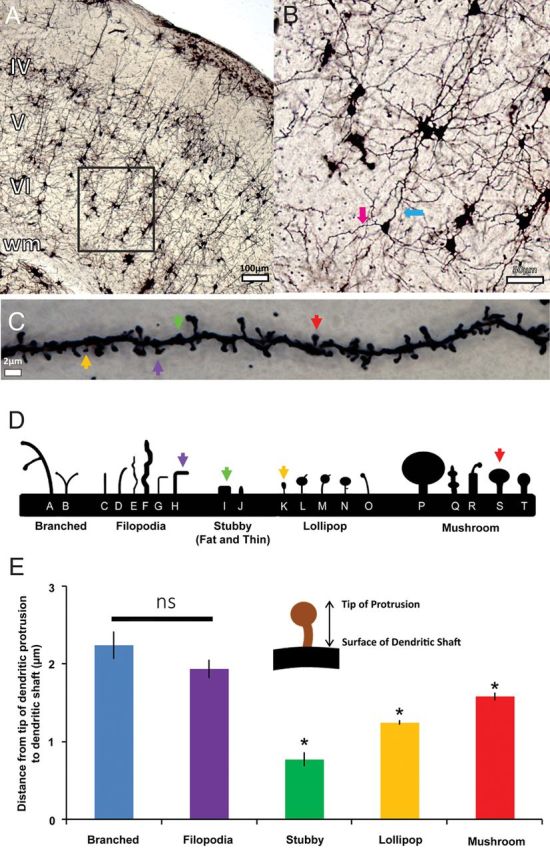
Morphological heterogeneity of dendritic protrusions. (A) Low-magnification (×4) view of the cortex in coronal section view. Scale bar: 100 μm. (B) ×10 magnification view of the barrel cortex. Scale bar 50 μm: The blue arrow is pointing to an apical dendrite while magenta arrow is pointing to the basilar dendrite of a layer VI pyramidal neuron. (C) High magnification (×100) view of the basilar dendritic shaft and protrusions in a Golgi-labeled cortical neuron. The sample microphotograph was obtained from layer IV basilar dendrite in P100 adult barrel cortex. (D) Representative schematic drawing of the distinctive dendritic protrusions categorized and grouped into several morphological categories: branched, filopodia, stubby, lollipop-like spines, and thick-neck mushrooms. (E) The numerical average showing the distance from the tip of the dendritic protrusion to the surface of the dendritic shaft by different protrusion categories. Inset: cartoon drawing showing distance from protrusion head to surface of dendritic shaft. Error bars: 1 standard error of the mean (SEM). Asterisks represent statistically significances at P < 0.05 (also see Table 1 for results of pair-wise comparison).
Under ×60 objective (oil immersion, 1.42 NA), pyramidal cells were further examined for uncut basilar dendrites of sufficient length (>100 µm) and tapered to a point, characteristics of uncut dendrites. Finally, under ×100 objective (oil immersion, 1.4 NA), dendrites were examined to ensure that its dendritic protrusions had been thoroughly labeled with the Golgi solution to reveal their distinct morphologies (see Fig. 1C). The experimenter reconstructed the soma and basilar dendrites, and then moved on to classifying the dendritic protrusions into several major morphological categories (see Fig. 1D, adapted from a classification scheme developed by William Greenough, see Comery et al. 1997; Irwin et al. 2000) by labeling each type of dendritic protrusions with a different marker (Neurolucida 8.0 version). We operationally defined filopodia with protrusion length of ≥1 µm with no distinguishable bulbous head, and stubby spines as being <1 µm. Mushroom and lollipop spines were discriminated by the width of their spine heads; mushroom spines displays much wider spine head, generally ∼1 µm, while lollipop spine heads are considerably smaller. Our categorical observations were confirmed by quantifying their length using the spine category measurement function in Neurolucida (see Fig. 1E). Approximately 15–18 neurons per layer in each condition were chosen for reconstruction and categorical analyses of dendrites and their respective dendritic protrusions. Only the basilar dendrites that are longer than 100 µm and run parallel to the pia/white matter were selected for the quantification of protrusions; this is to control the specificity of lamina location (i.e., apical dendritic segments often traverse outside of the cortical layer from which they originate and thus may receive different classes of inputs at different locations (Briggs and Callaway 2005)). For the trimming, regrow, and MK801 injection comparison portions of the study, the length of reconstructed dendrites were compared as a means to provide additional control of the conditions. It was found that for all possible age-matched comparisons in terms of the length of reconstructed dendrites, there were no statistical significances found (Student's t-tests, all P's > 0.4; also see Supplementary Tables 1 and 2).
Table 1.
Statistical results (in P-values, test: Unequal N HSD) of pair-wise comparisons between the different morphological categories of dendritic spines in their lengths of dendritic spines, defined as the distance from the most distal portion of the spine (spine head) to the base of the spine (surface of the dendritic shaft)
| Branched | Filopodia | Mushroom | Stubby | Lollipop | |
|---|---|---|---|---|---|
| Branched | 0.641777 | 0.023721 | 0.000017 | 0.000083 | |
| Filopodia | 0.641777 | 0.014589 | 0.000017 | 0.000017 | |
| Mushroom | 0.023721 | 0.014589 | 0.000017 | 0.004118 | |
| Stubby | 0.000017 | 0.000017 | 0.000017 | 0.000031 | |
| Lollipop (thin) | 0.000083 | 0.000017 | 0.004118 | 0.000031 |
Note: Statistical significance indicated in bold (Also see Fig. 1E).
Statistical Methods of Analyzing Dendritic Protrusion Density/Morphology
The NeuroExplorer software (Microbrightfield, Inc.) enables detailed analyses of the length and overall dendritic protrusion densities. Owing to the fact that longer dendrites would inevitably yield higher number of observed dendritic protrusions, we decided to focus on the density of protrusions instead of total number of protrusions. Dendritic protrusion density was calculated as the total quantified/classified dendritic protrusions in a neuron (as the numerator) divided by the total length of the reconstructed dendrite (as the denominator). Protrusion density is expressed as the number of dendritic protrusions (spines + filopodia)/10 µm dendritic length. The mean, standard deviation, and standard error of the mean were computed for the density of dendritic protrusions in each condition for both layers IV and VI dendrites. As we treated each neuron as an independent case, the independent sample t-tests and analysis of variance, where appropriate, were conducted between the protrusion densities of the control and the manipulated conditions for each respective layer. As a way to quantify and compare changes in dendritic protrusions over time, we obtained the numerical mean at 2 consecutive time points and subtracted them, and divided by the number of days elapsed between the 2 consecutive time points. For this analysis, the highest and lowest data points at each time epoch were eliminated prior to the subtraction in order to prevent significant skewing due to outliers. For each of the morphological categories of dendritic protrusions (filopodia, stubby, mushroom, etc.), the data are expressed as the percentage (distribution) of the total observed dendritic protrusions at a specific developmental age/experimental condition, by taking the observed number of dendritic protrusions per morphological class and divided by total number of observed protrusions . Specifically, the percentage of each type of dendritic protrusion type was determined for every neuron and then population means were constructed derived by averaging all the obtained percentage per morphological class in all sampled neurons measurements. We opted to explore the percentage distribution rather than the total number of dendritic protrusions, primarily due to the fact that the length of each dendrite is different. Longer dendrites are more likely to yield overall higher quantities of dendritic protrusions, and it is thereby more appropriate to investigate the percentage rather than the absolutely quantity of dendritic protrusions. Sholl analyses were performed similarly to previously described (Sholl 1956; Chen et al. 2009, Chen, Tam, et al. 2012). Unless otherwise noted, the analysis of variance (where appropriate with multiple groups comparisons) was utilized to distinguish the main effect(s), and if statistical significance was found (P < 0.05), an appropriate post hoc test (Fisher LSD or Tukey HSD) was utilized to determine which pairs are significantly different from each other. For the statistically significant pairs, Cohen's d test was also performed to determine the effect size. All statistical analyses were performed using Statistica 8.0 Software (StatSoft.com) on a PC.
Results
The dendrites of cortical excitatory neurons are characterized by their spines and filopodia which we will refer collectively as dendritic protrusions. The Golgi impregnation technique allowed us to clearly visualize various types of dendritic protrusions (Fig. 1C) based on their morphology (see also Fig. 1D for a schematic drawing based on morphological categorization of dendritic protrusions). We identified each protrusion length from its tip to its base on the parent dendrite. Each morphological class of dendritic protrusions yielded significant differences in terms of length from the distal ending of the protrusion itself to the surface of the parent dendrite (Fig. 1C, P < 0.05 for all pairs except branched vs. filopodia; Unequal-N HSD test, n = 623 protrusions quantified in 10 neurons from 4 animals). Our data suggested that branched and filopodia type of dendritic protrusions in general have the longest length, followed by mushroom spines and lollipop spines. The stubby (both small and fat) as expected exhibited the shortest distance from the distal ending to the surface of the parent dendrite. We thereby demonstrated that our qualitative assessment method matches our quantitative analyses with regards to the length of dendritic protrusions. It also provides a reliable basis for quantitatively assessing the influence of developmental maturation and the impact of peripheral manipulation (e.g., trimming, blocking NMDARs) on the density and morphological diversity of dendritic protrusions.
Density and Morphological Distribution of Dendritic Protrusions During Development
To explore the normal developmental trajectory of dendritic protrusions, we investigated the density of dendritic protrusions and the distribution of different morphological categories at several developmental time stages: P15, P30, P60, P100, and P130 in the basilar dendrites of both layers IV and VI of the barrel cortex (Fig. 2A), for these 2 layers are the main recipient layers of lemniscal thalamocortical afferents. It was found that from P15, which exhibited the highest protrusion density, there is a significant and steady decline of dendritic protrusion density in both layers IV and VI [Layer IV: Between-groups ANOVA: F4,81 = 34.392, P < 0.001; Layer VI: Between-groups ANOVA: F4, 74 = 46.887, P < 0.001]. Post hoc comparisons (Fisher LSD) revealed that for both layers, this trend of decrease in dendritic protrusion density across development is statistically significant (P < 0.05), with the exception of P100 versus P130 where it yielded a nonsignificant result (P = 0.13 for layer IV and P = 0.08 for layer VI). Sholl analyses (Fig. 2B,C) of dendritic protrusion density at these different developmental stages confirmed our initial overall density data, which P15 exhibited the highest density, followed by 30, 60, 100, and 130, respectively [mixed-model ANOVA (age × distance from soma); post hoc: Tukey HSD, significant at P < 0.05]. Overall, it was observed that for both layers IV and VI, this age-dependent effect on protrusion densities are more pronounced in the intermediate segments (∼30–80 µm away from the center of soma) compared with the immediately proximal, or the very distal segments of the basilar dendrites.
Figure 2.
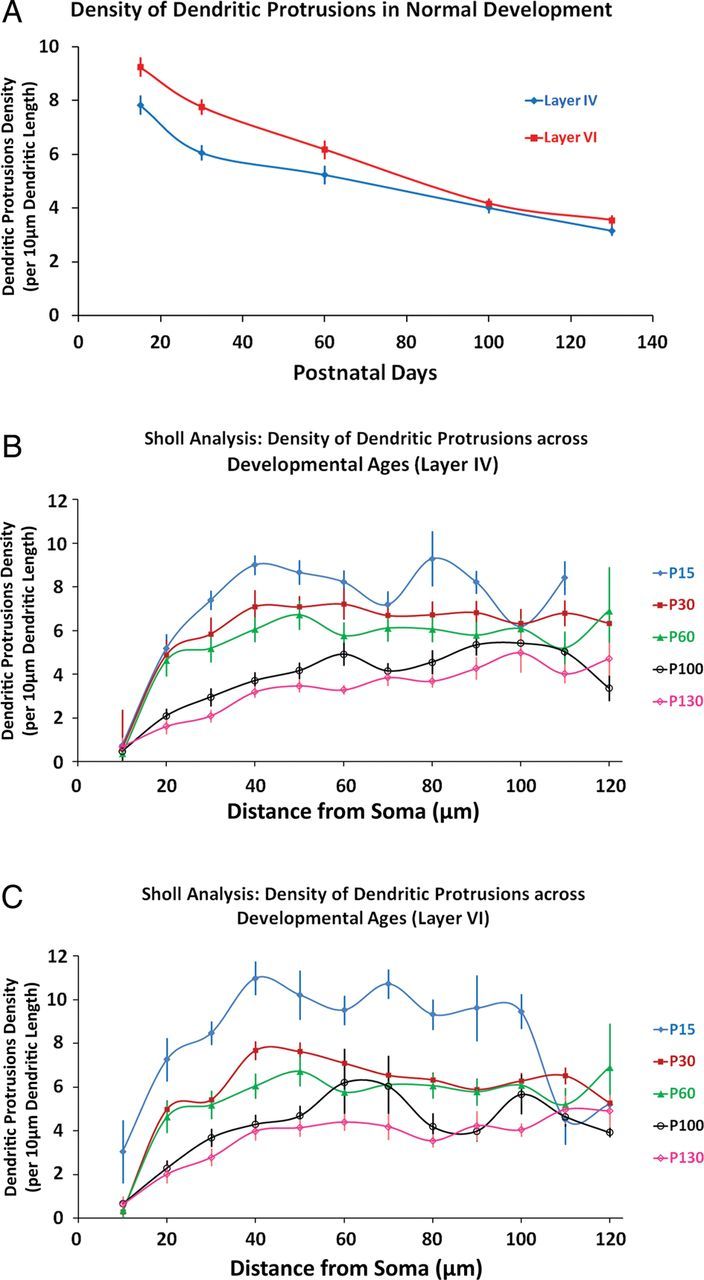
Density of dendritic protrusions in normal developing barrel cortex. (A) Density of dendritic protrusions in the basilar dendrites of layers IV and VI barrel cortical neurons. Note the overall trend in the steadily decreasing density of dendritic protrusions as the animals mature. (B and C) Sholl analyses (density of dendritic protrusions) across development. Note that, for both layers IV and VI, the effect of different developmental ages are more pronounced in the intermediate regions (∼30–80 μm away from somata). Data points represent numerical averages with the error bars showing one SEM.
Consistent with previously published findings in other layers (Yang et al. 2009), we show that there is a steady net loss of dendritic protrusions from P15 in both layers IV and VI as the animals mature (Fig. 2A). We estimated the rate of net loss of dendritic protrusions (see Materials and Methods) across various developmental stages. The data suggested that the highest rate of dendritic protrusion loss happens in the time epoch between P15 and P30. Following this time period, the rate of net loss of protrusions significantly slows down, and the rate of net loss of protrusions differs depending on the cortical layer [Layer IV: Between-groups ANOVA: F3,63 = 11.50, P < 0.001; Layer VI: Between-groups ANOVA: (3,59), P < 0.001]. It appears that the rate of net loss of dendritic protrusion in layer IV is slowed down earlier compared with layer VI, as post hoc tests revealed the rate of dendritic protrusion loss is significantly decreased in the P31–60 epoch in layer IV (Tukey HSD, P < 0.05), but not in layer VI (P = 0.32). This suggests that, as the animals mature, the rate of net loss of dendritic protrusions is different in these 2 cortical layers, possibly implicating that layers IV and VI mature at 2 distinct rates.
Figure 3.

Representative photographs of dendritic protrusions. The rows depict the age and experimental conditions of the animals, and the columns depict the cortical layers IV and VI. Scale bar: 2 μm. All pictures were taken under ×100 magnification (oil immersion, N.A. = 1.4).
We next investigated the shift in morphological makeup of dendritic protrusions as the animals matured (Fig. 4). It is evident that the distributions of different morphological classes of dendritic protrusions differed as a function of developmental period. A mixed-model ANOVA (protrusion type × developmental age) yielded a significant main effect for protrusion type [F5,450 = 161.00, P < 0.001] and a significant interaction effect [F20,450 = 27.00, P < 0.001] for layer IV. Similarly, for layer VI, there was a significant main effect for protrusion type [F5, 380 = 147.41, P < 0.001] and a significant interaction effect [F20,380 = 17.14, P < 0.001]; thus, the distribution of morphological classes of dendritic protrusions varies over time as the animals mature into adulthood.
Figure 4.
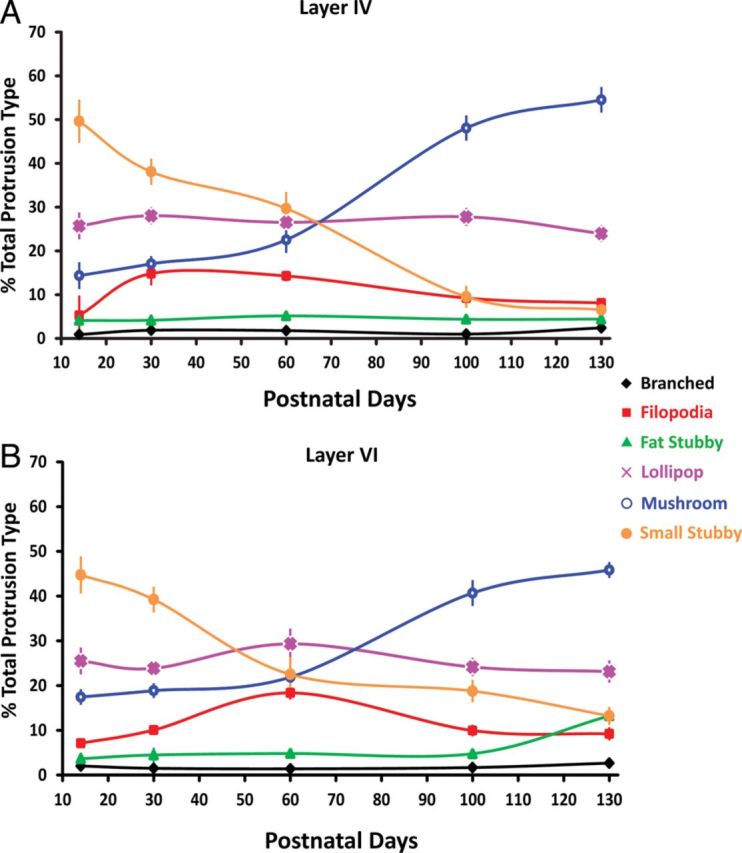
Morphologic distribution of dendritic protrusions across developmental life span in layers IV (A) and VI (B). The percentage distribution of dendritic protrusions on basilar dendrites changes significantly as the animals mature. While the distribution of branched, thin lollipops and fat stubby did not vary significantly, the small stubby and filopodia protrusions steadily decreased as the animals mature, and the mushroom spines showed a progressive increase as the animals reached adulthood. Data points represent sample means with the error bars representing one SEM.
To pinpoint morphological alterations of dendritic protrusions over the animals' lifespan, we examined each class of dendritic protrusions as a function of the animal's age. Upon more detailed inspection (using Tukey HSD as a means of post hoc) in layer IV, the branched type did not vary significantly across developmental ages (P > 0.4 for all comparisons). Layer IV filopodia showed an inverted-U trend, in which there were significant elevation in P30 compared with P15 (P < 0.001), followed by a brief plateau at P60, and dropping in the total percentage at P100 and P130 (P60 vs. P100 and P130, P < 0.001; P100 vs. P130, P > 0.5). Layer IV small stubby protrusions showed a dramatic decrease in its distribution as the animal matured (P < 0.001 for all pairs except P100 vs. P130 where P > 0.05). Both layer IV thick stubby and lollipop spines, by contrast, showed no changes in their distributions as the animals matured (P > 0.7 for all pairs). The layer IV mushroom spines start showing increased distribution from P60 all the way until P130 (P's < 0.01), but not before P60 (P15 vs. P30, P > 0.9). Overall, the relative distribution of dendritic protrusions fluctuates based on animals' development, with mushrooms increasing, the lollipop and fat stubby remaining relatively stable, and the small stubby protrusions and filopodia steadily decreasing throughout the animals' lifespan.
The change of dendritic protrusion morphology in layer VI is quite similar to that of layer IV, with minute differences. As in layer IV, branched protrusions showed no significant change in the distribution across developmental ages (P > 0.4 for all pairs) in layer VI. Filopodia in layer VI also showed an inverted-U trend similar to layer IV, but this elevation in distribution does not start until the second postnatal month (P60, P < 0.001; Tukey HSD), followed by a quick drop in the percentage of distribution within total dendritic protrusions by P100 (P < 0.001). The reduction of small stubby protrusions, although steady, does not significantly drop until P30 to P60 (P15 vs. P30, P > 0.05), but there is a dramatic drop from P15 to P60, as well as P30 to P60 (P's < 0.001) and this decrease of small stubby protrusions continues throughout P130 (P's < 0.05 for all). Fat stubby spines remains comparable across age until between P100 and P130, where there is a slight but significant increase (P < 0.05). The lollipop spines, as was the case in layer IV, remain constant throughout the animals' developmental life (P > 0.4 for all pairs; Tukey HSD). Lastly, the increase in the percentage of mushroom spines in layer VI is similar to that of layer IV, as the increased addition starts from P60 all the way until P130 (P < 0.01 for all comparisons), but not before P60 (P15 vs. P30, P30 vs. P60, P's > 0.05). Our data are in line with previous findings (Dumitriu et al. 2010) which demonstrated that as the animals mature, there is a significant redistribution in the morphologies of dendritic protrusions, and this shift is dominated by a significant increase of mushroom types as the animals become older. This supports the hypothesis that the roles of mushroom-type spines are more mature compared with other classes of spines, and thus are likely to be the “memory storage sites” of neurons as the animals go through various life time experiences (see Holtmaat and Svoboda 2009; Xu et al. 2009; Yang et al. 2009; Fu et al. 2012).
Layer-Specific and Age-Dependent Effect of Whisker Trimming and Sensory Restoration on Density and Morphology of Dendritic Protrusions
Effect of Trimming from P0 to P30 on Dendritic Protrusions Profile
Sensory experience plays a critical role in driving the maturation processes of the developing cerebral cortex (see Feldman and Brecht 2005). We thus explored whether depriving somatic sensation via whisker trimming would have a significant impact on the dendritic protrusions of the pyramidal neurons in the thalamocortical afferent layers (IV and VI). We focused only on the basilar dendrites of the layer IV and VI pyramidal neurons due to the fact that apical dendrites traverse outside of their home layers, and it has been previously demonstrated that the impact of sensory deprivation on apical dendritic protrusions is dependent on which cortical lamina of the segment of the dendrite is located (Oray et al. 2004; Briner et al. 2010). We found that chronic sensory deprivation by both methods of unilateral (investigating the contralateral barrel field from the trimmed mystacial pad) and bilateral trimming from P0 to P30 yielded significantly higher density of dendritic protrusions in the basilar dendrites of layer IV pyramidal neurons (Fig. 5A) [Between-groups ANOVA, F2,52 = 4.46, P < 0.05, Cohen's d = 0.83; control n = 25 neurons from 5 animals, unilateral trim: n = 14 from 5 animals, bilateral trim: n = 16 from 5 animals]. Post hoc analysis (Tukey HSD for all of the post hoc pair-wise comparisons mentioned in this section) revealed that this elevated density in both whisker-trimmed conditions, while not significantly different from one another (P > 0.8), are both significantly higher than their P30 control counterpart (P's < 0.05). While there were no significant shifts in the distribution seen in filopodia, fat stubby, and mushrooms as a function of whisker trimming, the branched, small stubby, and lollipop spines showed significant shifts as a result of chronic sensory deprivation (P's < 0.05). The most apparent alterations are observed in the significant drop of small stubby spines and elevated lollipop spines in their distribution within total dendritic protrusions following whisker trimming, and depending on the method of trimming (unilateral vs. bilateral), the magnitude of the distribution shift varies (see Fig. 5B).
Figure 5.

Layer-specific response of dendritic protrusions in barrel cortex to chronic sensory deprivation in neonatal mice. (A) Following chronic sensory deprivation from P0 to P30, the density of dendritic protrusions in layer IV barrel cortical neurons (basilar dendrite of pyramidal cells) is significantly elevated in the deprived groups. (B) Chronic sensory deprivation from P0 to P30 resulted in a distributional shift in the distribution of dendritic protrusions. The response to deprivation varies depending on the morphological class. (C) Following chronic deprivation from P0 to P30, the density of dendritic protrusion in layer VI is lower compared with the control counterparts. (D) Same as (C) but in layer VI. Data are presented as mean ± 1 SEM. *P < 0.05, **P < 0.01, ***P < 0.001.
The effect of chronic sensory deprivation from birth to P30 on the density of dendritic protrusion in layer VI pyramidal neurons were opposite of what was observed in layer IV (Fig. 5C), in which there was a significant reduction of density when we compared bilaterally trimmed versus P30 controls [t(43) = 3.76, P < 0.001, Cohen's d = 1.13; control n = 22 neurons from 5 animals, bilateral trim: n = 23 from 5 animals]. Similar to layer IV, the distributional shift in layer VI dendritic protrusion morphology following bilateral trimming is evident as well (Fig. 5D). Specifically, we observed a significant increase in the proportion of branched, filopodia, and lollipop spines (P's < 0.03 for all), while the distribution of small stubby and mushroom spines were significantly reduced following bilateral trimming from birth to P30 (P's < 0.01 for all). The fat stubby spines, similar to layer IV, following trimming did not show statistical significance when compared with the P30 control counterparts.
Restoring Sensation via Whisker Regrow From P31 to P60 Provides Partial Recovery of Dendritic Protrusion Profile Depending on Cortical Layer
Next, we allowed the whiskers to grow back to their full length for 1 month following P0–30 trimming, and compared the dendritic protrusion parameters in the P60 control against the P60 whisker-regrow animals. The findings indicated that while the density of dendritic protrusions of layer IV neurons remained elevated [t(30) = −2.56, P < 0.03, Cohen's d = 0.91; control n = 19 neurons from 4 animals, whisker-regrow: n = 13 from 4 animals] (Fig. 6A), the density of dendritic protrusions in layer VI returned to comparable levels with those of P60 control animals [t(29) = 0.35, P > 0.7; control n = 17 neurons from 4 animals, whisker-regrow: n = 14 from 4 animals] (Fig. 6C). In exploring the distributional shift in dendritic protrusion morphology following sensory restoration (P60 control vs. P60 regrow), we observed that in layer IV, the pattern stayed identical to that of P30 control versus P30 bilateral trimmed: branched and lollipop spines remained higher while the small stubby spines remained lower in the whisker-regrow condition when compared with the control P60 s (P's < 0.05 for all), with no statistical significance reached for filopodia, fat stubby, and mushroom spines, similar to P30 control versus P30 bilateral trimmed in layer IV neurons. In layer VI, even though the density showed a return to comparable levels with that of P60 control animals, the impact of earlier sensory deprivation lingered for most morphological classes of dendritic protrusions, with the direction of the significance staying identical for all classes (P's < 0.05 for all) with the exception of filopodia (P > 0.05). The distribution of filopodia returned to comparable level with that of P60 following whisker-regrow, and the fat stubby spines remained unaffected, like previously observed in P30 control versus trimmed condition (P's > 0.05). It may seem that layer VI in terms of the density of dendritic protrusions, is more malleable and responsive to postdeprivation experiences compared with layer IV. The effect of deprivation from birth on the morphology of dendritic protrusions, however, lingered in both layers IV and VI even after the sensation was restored, thus suggesting the long-lasting impact of depriving sensation in early developmental period has on the animal throughout their lifespan.
Figure 6.

Layer-specific response of dendritic protrusions in barrel cortex following a period (P31–60) of sensory restoration. (A) Following a period of sensation recovery (P31–60 in P0–30 previously trimmed mice), the density of dendritic protrusions in layer IV barrel cortical neurons remained significantly elevated compared with P60 control groups. (B) Prior sensory deprivation from P0 to P30 resulted in a long-lasting repercussion in terms of the distributional shift in the proportion of morphological classes. The pattern of statistical significance remained similar to that of P30 control versus P0–30 trimmed, suggesting that prior deprivation experience lingered until P60, even following sensory restoration period of 1 month. (C) However, the densities of dendritic protrusions in layer VI returned to control levels following sensory restoration. (C and D) Same as 6B but in layer VI. Note the similarity of data pattern compared with 5D. Data are presented as mean ± 1 SEM. *P < 0.05, **P < 0.01, ***P < 0.001.
Effect of Trimming on Adult Animals, P100–130
It has been previously demonstrated that chronic sensory deprivation in adult animals can lead to an elevated density of dendritic spines in layer V pyramidal neurons in the sensory cortices (Zuo, Yang, et al. 2005; Hofer et al. 2009). However, the effect of adult sensory deprivation on the spines located in thalamocortical layers remains unknown, and thus we examined the repercussion of chronic sensory deprivation on the density and morphology of dendritic protrusions. It was found in adult animals that were deprived of sensation (whisker trimmed bilaterally from P100 to P130), and that their layer IV dendritic protrusion densities were significantly elevated compared with age-matched P130 control group (Fig. 7A) [t(28) = 2.23, P < 0.05, Cohen's d = 0.81; control: n = 15 neurons from 7 animals, bilateral trim: n = 15 from 6 animals]. In terms of the morphology of dendritic protrusions (Fig. 7C), layer IV dendrites in the adult deprived condition showed a significantly higher percentage of lollipop spines but a lower percentage of small stubby and mushroom spines when compared with their P130 control counterparts (P's < 0.05). Branched, filopodia, and fat stubby dendritic protrusions in layer IV were not dramatically influenced as a result of chronic sensory deprivation in adult animals (P's > 0.05 for all). These results are similar compared with P0–P30 trimmed animals, in which both P100–P130 and P0–P30 trimmed animals showed lower small stubby and higher lollipop spines distributions compared with their control counterparts. The only difference is that the adult trimmed animals exhibited a statistically significant reduction in the distribution of mushroom spines, which was trending similarly in the P0–P30 bilaterally trimmed animals but did not reach statistical significance. This might be due to the fact that mushroom spines are much more abundant in P130 compared with P30 and, hence, the effect can be more readily detected statistically.
Figure 7.

Effect of sensory deprivation from P100 to P130 on dendritic protrusions. The response to sensory deprivation in mature animals results in layer-specific responses. (A) Chronic sensory deprivation via whisker trimming in mature animals leads to elevated density of dendritic protrusions in layer IV. (B) Chronic sensory deprivation from P100 to P130 resulted in a distributional change in the morphology of dendritic protrusions in layer IV. The small stubby and mushroom spines significantly decreased, while the proportion of lollipop spines increased. The other types of dendritic protrusions remained comparable following adult trimming. (C) Chronic sensory deprivation in adults, however, did not significantly influence the density of dendritic protrusions in layer VI. (D) Despite little influence on spine density, adult chronic trimming was still able to influence subtle aspects of spine morphologies. Data are presented as mean ± 1 SEM. *P < 0.05, **P < 0.01, ***P < 0.001.
In layer VI, chronic sensory deprivation in adult animals did not lead to a significant change in the overall density of dendritic protrusions (Fig. 7C) [t(27) = 0.86, P > 0.3; control: n = 15 neurons from 7 animals, bilateral trim: n = 14 from 6 animals]. Even though the density of dendritic protrusions did not differ significantly, there were still some subtle alterations in the morphological makeup of these dendritic protrusions, mainly in the significantly lower percentage of small stubby and mushroom spines, and the elevated percentage of lollipop spines in the P130 trimmed group when compared with their age-matched counterpart (P's < 0.05 for all pairs). The branched, filopodia, and fat stubby types of dendritic protrusions did not show statistical indications of being different (P's > 0.05). Taken together, the more robust effects of adult sensory deprivation in layer IV may be reflective of the relative importance of thalamic input in driving the activity in that layer IV compared with layer VI.
The Effect of Chronically Blocking NMDAR Transmission on Density and Morphology of Dendritic Protrusions
It has been previously shown that interfering with the transmission of NMDARs leads to alterations of spine dynamics in the apical dendrite of layer V pyramidal neurons (Zuo, Yang et al. 2005) and increased spine density in layer IV spiny stellate cells (Datwani et al. 2002), but the full spectrum of the role of NMDAR has on layer IV and VI pyramidal neurons remains unexplored, particularly on dendritic protrusions. We observed that following chronic intraperitoneal administration of the NMDAR antagonist MK801 from birth to P30, both the basilar dendrites of layer IV and VI pyramidal exhibited significantly higher overall densities of dendritic protrusions (Fig. 8A,C) [Layer IV: t(40) = 6.60, P < 0.001, Cohen's d = 2.03; control n = 25 neurons from 5 animals, MK801 n = 17 from 3 animals. Layer VI: t(38) = 2.73, P < 0.01, Cohen's d = 0.85; control n = 22 neurons from 5 animals, MK801 n = 18 from 3 animals]. There was also a significant impact of chronically blocking NMDAR on the morphology of dendritic protrusions which was also evident (Fig. 8B,D), as both layers IV and VI branched and filopodia showed significant increases in their overall percentage of distribution, while the small stubby protrusions showed a significant decrease (P's < 0.05). The fat stubbies remained unchanged for both layers (P's > 0.3). While the lollipop and mushroom spines did not vary significantly in layer IV (P's > 0.5), in layer VI there was a significantly higher percentage of the lollipop spines and lower percentage of mushroom spines (P's < 0.05).
Figure 8.

Effect of chronically blocking NMDAR (from P0 to P30) on layers IV and VI dendritic protrusions. (A and C) Chronically administering MK801 (a NMDAR noncompetitive blocker) from birth to P30 resulted in significant elevation of dendritic protrusions in layers IV and VI, respectively. (B and D) Chronically blocking NMDAR from birth to P30 resulted in notable distributional change in the morphology of dendritic protrusions. In layer IV, the MK801-injected group showed significantly higher distributions of branched and filopodia, and lower distributions of small stubby type of protrusions. In layer VI, the MK801-injected group showed significantly higher distributions of branched, lollipop, and filopodia, with a paralleling decrease in the mushroom and small stubby type of dendritic protrusions. Data are presented as mean ± 1 SEM. *P < 0.05, **P < 0.01, ***P < 0.001.
Comparing the P0–P30 MK801-injected group with the bilaterally trimmed group in terms of dendritic protrusion density, it was found that in both layers IV and VI, the MK801-injected group had a dramatically higher density of dendritic protrusions compared with the bilaterally trimmed group (P's < 0.05). Our data also suggest that blocking NMDAR transmission is associated with the decrease of small stubby protrusions and increase of branched dendritic protrusions similarly seen in P0–P30 trimming. However, it does not readily explain the significant increase of lollipop spines observed in the deprived animals in both layers IV and VI, as chronically injecting MK801 failed to reproduce this type of data pattern.
Next, we withdrew the MK801 (no injections) from P31 to P60 in the previously 1-month (P0–30) MK801-injected mice, and compared these animals with P60 control animals (Fig. 9). We found that, in both layers IV and VI, the density of dendritic protrusions returned to comparable levels to the control group [Layer IV: t(29) = 0.82, P > 0.42; control n = 19 neurons from 4 animals, Drug withdraw n = 12 from 3 animals. Layer VI: t(28) = 1.4, P > 0.15, control n = 17 neurons from 4 animals, Drug withdraw n = 13 from 3 animals]. In the morphological distribution of dendritic protrusions in layer IV pyramidal neurons, the branched and filopodia, returned to comparable levels with that of controls (P's > 0.05), and it was observed that there was a significant increase in the distribution of mushroom spines (P < 0.001). Within layer VI, the distribution of branched, filopodia, and mushroom spines returned to comparable levels (P's > 0.05), while there was a significant increase of the small stubby and a decrease of the lollipop spines (P's < 0.05). Overall, unblocking the activity of previously perturbed NMDAR activity returns to the protrusion densities to comparable levels with that of the control animals, although there are still subtle changes in the morphological makeup of the dendritic protrusions.
Figure 9.

Unblocking NMDAR activity from P31 to P60 results in partial recovery of dendritic protrusion phenotype. (A) The density of dendritic protrusions, upon withdrawing MK801 from P31 to P60 after P0–30 NMDAR blocking, returned to comparable levels compared with age-matched P60 control in layer IV. (B) The distributional change in the morphology of dendritic protrusions in layers IV. The branched and filopodia type of dendritic protrusions returned to comparable levels after withdrawing MK801, while the distribution of stubby spines remained lower, with possible compensatory increase in the mushroom spines. (C) Same as 9A but in layer VI. (D) Distribution of protrusion classes in layer VI. The branched, filopodia, and mushroom dendritic protrusions returned to comparable with that of P60 control group, while the distribution of small stubby and lollipop spines showed compensated increase and decrease, respectively. Data are presented as mean ± 1 SEM. *P < 0.05, **P < 0.01, ***P < 0.001.
Last, to further clarify the relationship between chronic sensory deprivation from birth and subsequent sensory restoration, as well as chronic blocking of NMDA-R from birth and subsequent MK801 withdrawal, we selected the P30 and P60 age-matched data on dendritic protrusion density, and performed a between-groups factorial ANOVA [age (2 levels; P30 and P60) × types of treatment (3 levels; Control, Sensory Deprivation, MK-801 injected)], followed by pair-wise post hoc tests for all possible pairs (Fig. 10A,B). The data indicated that for layers IV and VI, both developmental age and types of treatment are prominent factors which influence dendritic protrusion density [Layer IV age: F1,104 = 23.695, P < 0.001; Layer VI age: F1, 101 = 14.42, P < 0.001; Layer IV treatment: F2,104 = 9.240, P < 0.001; Layer VI treatment: F2,101 = 13.15, P < 0.001.], and these 2 factors significantly interact with one another for layer IV [F2,104 = 13.052, P < 0.001] and approaches statistical significance for layer VI [F2,101 = 2.76, P = 0.067]. When comparing the density of dendritic protrusions in P30 versus P60 across various types of treatment, post hoc analyses (Fisher LSD) revealed that there is a significant density decrease in layer IV (P < 0.05), but not in layer VI (P > 0.05). In the MK801 treatment conditions, MK801 withdrawal mice (P60) displayed significantly lower protrusion density compared with MK801-injected (P30) mice (both layer IV and VI; P's < 0.01). With regards to the trimmed conditions, the density of whisker-regrow group (P0–30 trim, P31–60 regrow) versus P0–30 bilateral trimmed group showed no difference (P = 0.94, layer IV; P = 0.77, layer VI. (For statistical significance of all possible pair-wise tests, please refer to Table 3).
Figure 10.
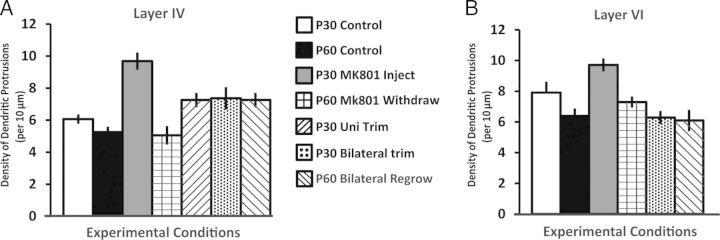
Summary graph on dendritic protrusion density in various groups mentioned in the present paper. Various condition groups in layer IV (A) and layer VI (B), respectively (also see Table 3 for results of pair-wise comparison).
Table 3.
Statistical results (in P-values, test: Fisher LSD) of pair-wise comparisons between various experimental conditions mentioned in the current study
| P30 Control | P30 MK801 Inject | P30 Unilateral trim | P30 Bilateral trim | P60 Control | P60 MK801 Withdraw | P60 Bilateral regrow | |
|---|---|---|---|---|---|---|---|
| P30 Control | 0.000 | 0.043 | 0.041 | 0.200 | 0.142 | 0.074 | |
| P30 MK801 Inject | 0.020 | 0.001 | 0.001 | 0.000 | 0.000 | 0.001 | |
| P30 Unilateral trim | n/a | n/a | 0.958 | 0.003 | 0.002 | 0.897 | |
| P30 Bilateral trim | 0.001 | 0.000 | n/a | 0.003 | 0.002 | 0.936 | |
| P60 Control | 0.000 | 0.000 | n/a | 0.868 | 0.795 | 0.007 | |
| P60 MK801 withdraw | 0.240 | 0.002 | n/a | 0.062 | 0.107 | 0.004 | |
| P60 Bilateral regrow | 0.001 | 0.000 | n/a | 0.774 | 0.677 | 0.054 |
Data are expressed in density of dendritic protrusions (# protrusions/10-µm dendritic length). Layer IV normal font; Layer VI: italics. Statistical significance indicated in bold (also see Fig. 10A,B).
Discussion
We provide structural evidence that cortical pyramidal neurons respond in a layer-specific manner to the same peripheral manipulation, and the same manipulation (i.e., chronic sensory deprivation) yields different results depending on the age of the animals investigated. We have also provided pharmacological evidence that perturbing the sensory system during developmental critical period by chronically blocking NMDAR transmission can also leads to density as well as morphological alterations of dendritic protrusions. Exploring the effects of sensory system disruption in various developmental ages and subsequently analyzing dendritic protrusion density and morphology builds the foundation in describing sensory experience-dependent synaptic plasticity and the rearrangement of cortical circuitry in the cerebral cortex.
Dendritic Protrusion Density Decreases as a Function of Normal Development in Layer IV and VI
Our data from layers IV and VI are consistent with previously published studies describing dendritic protrusions from layer V pyramidal neurons (Zuo, Lin, et al. 2005; Yang et al. 2009). Similar to layer V apical dendrites, pyramidal neurons in both layers IV and VI experience a net loss of protrusions as the animals mature into adulthood. Consistent with these previously published studies, we showed that initially there was a sharp loss of protrusion densities from P15 to 30, and as the animals become more mature, the rate of net dendritic protrusion loss decelerates. This sharp net loss of dendritic protrusion density might be correlated with the onset of whisking in mice (see Prescott et al. 2011). As the animals increase the functional use of their whiskers, thereby increasing the neuronal activities in the barrel cortex, the onset of activity-dependent spine pruning also starts. We demonstrate that this rate of net protrusion loss is slightly different depending on the cortical layer. As described previously (Rausch and Scheich 1982; Zuo, Lin, et al. 2005; Yang et al. 2009), this age-dependent net loss of dendritic protrusions is likely an indication of activity-dependent synaptic refinement during the developmental critical period, a likely sign of cortical maturation. Our results are consistent with these findings as we saw a sharp decrease in the protrusion density in both layers from P15 to P30, followed by less rapid rate of protrusion loss thereafter. Similarly, our finding that there is a shift in the morphology of the dendritic protrusions is consistent with a previous report (Dumitriu et al. 2010); the most noticeable is the significant decrease of the small stubby protrusions and a significant increase of the mushroom spines as the animals matured.
Response of Dendritic Protrusions to Perturbation of Sensory Input is Age and Cortical Layer-Specific
Previous studies have demonstrated that monocular deprivation leads to increased spine density in apical dendrites of layer V pyramidal neurons, but not in layer II/III neurons (Mataga et al. 2004; Hofer et al. 2009). In our study, the significantly higher density of dendritic protrusions in sensory-deprived layer IV pyramidal neurons may indicate an increase in the number of excitatory synapses. Our results provide a possible structural basis as to why cells show increased excitability under a sensory-deprived condition during the critical period, consistent with previously published data from in vivo recordings (Simons and Land 1987; Shoykhet et al. 2005; Lee et al. 2007). Higher dendritic protrusion density is likely correlated with increased excitatory inputs onto these cells. Although our data do not directly provide a mechanism for this increased density of dendritic protrusions, it may result from decreased spine elimination as suggested previously on layer V apical dendrites (Zuo, Yang, et al. 2005), or increased spine formation similarly to monocular deprivation (Hofer et al. 2009). Even though bilateral and unilateral trimming both resulted in higher protrusion density in layer IV, it affects the relative distribution of protrusion subtypes differentially. With the methods used in the current manuscript, it is difficult to specifically pinpoint why bilateral versus unilateral trimming induced slightly different changes on spine morphology distributions. The more dramatic impact of bilateral trimming may be due to the much greater loss of afferent drive as opposed to when the ipsilateral whiskers remained, there is some impact of the callosal input on layer IV activity. This may be related to the finding that unilateral versus bilateral trimming does not evoke the same physiological responses (Popescu and Ebner 2010), perhaps due to the differences in collaosal inputs in the unilateral versus bilaterally trimmed mice.
Unexpectedly, there was a concomitant decrease in spine density in layer VI pyramidal neuronal dendrites. Why these neurons respond to whisker trimming by decreasing their protrusion densities is unclear, as the current literature on sensory-deprived manipulations that investigate layer VI neurons is limited. One possibility may be the significantly increased length of basilar dendrites in layer VI pyramidal neurons in response to an identical deprivation paradigm (Chen, Tam, et al. 2012), thus making the dendritic protrusions more sparsely located from one another. Another possibility of this lowered level of protrusion densities might be due to the reduced axonal branches originating from layer II/III (Bruno et al. 2009) and the thalamus (Wimmer et al. 2010); which may result in a decrease in the overall number of excitatory inputs to layer VI. Lastly, our previous work has identified a variety of excitatory neurons within cortical layer VI (Chen et al. 2009). It should be kept in mind that since we selectively sampled basilar dendrites that are over 100 µm in length, we might be sampling a more homogeneous grouping of the larger pyramidal neurons in layer VI (i.e., Groups 1 and 3 in Chen et al. 2009). Taken together, these findings indicate that there are laminar differences in how sensory input is processed and thus leads to cortical layer-specific alterations in response to changes in the sensory experience during the developmental critical period.
It has been suggested in the cortex that morphological structure of postsynaptic dendritic protrusions might be correlated to the origin of their presynaptic inputs. Specifically, it was demonstrated that thalamocortical axons (TCA) axons are more likely to synapse onto “short stubby” spines and less likely to synapse onto spines with a distinctive spine head (Richardson et al. 2009). Similarly, converging evidences from tract-tracing, immunohistochemical, and electron microscopic studies have suggested similar findings that TCA-associated postsynaptic spines are generally larger than non-TCA spines, exhibiting greater synaptic terminal area and length (Kharazia and Weinberg 1994; Nahmani and Erisir 2005). In addition, findings from tract-tracing studies have suggested that following chronic sensory deprivation, there is significant decrease in the lemniscal TCA axons originating from VPm of thalamus (Bruno et al. 2009; Wimmer et al. 2010), resulting in a shift of thalamocortical/cortico-cortical connection ratios. Our data have provided additional evidence on the postsynaptic side in the cortical TCA recipient layers, that this shift in thalamocortical/cortico-cortical connection following chronic sensory deprivation is observed in a structural shift of dendritic protrusions. Following chronic sensory deprivation for a month, there is considerable reduction of the proportion of stubby spines and higher proportion of lollipop spines in both layers IV and VI. It is possible that the proportional reduction of small stubby spines following chronic deprivation is due to reduction of TCA innervations, whereas the proportional increase of lollipop spines is most likely due to the relatively higher ratio of cortico-cortical connections. This might have occurred as a compensatory mechanism for the balance of postsynaptic input and intrinsic neuronal activity.
Our data suggest that 1 month of whisker regrow maintained the elevation of dendritic protrusion density in layer IV pyramidal basilar dendrites but resulted in a returning of the comparable level of density in layer VI. These discrepant results may be due to the fact that layer IV of the barrel cortex is tightly organized into discrete functional columns, as opposed to layer VI which is more continuous. Additionally, layer IV receives much more homogeneous input (e.g., thalamus) compared with layer VI (e.g., primary motor cortex, secondary somatosensory cortex, thalamus, contralateral barrel cortex, and various intracortical layers), thereby suggesting that thalamocortical input only accounts for a small partition of the overall excitatory drive into layer VI and thus the remaining inputs can more easily overcome the loss of previous whisker-related sensations. Even though the trimming process was discontinued at P30, vibrissa take time to grow back, hence the sensation on the mystacial pad is gradually reintroduced, as opposed to in other modalities and paradigms of sensory deprivation and recovery (i.e., unsuturing of eyelid), which is rather rapid thus if we had investigated a later time point (e.g., >60 days sensory restoration), more dramatic effects of recovery of spine phenotype may have been observed.
It has been previously demonstrated that the cellular environmental substrates such as the extracellular matrix protein aggrecan do not return to normal level in layer IV following 1 month of sensory restoration after the initial deprivation during the critical period (McRae et al. 2007). Our current findings in layer IV are similar in that allowing the whiskers to regrow did not regain the control phenotype of dendritic protrusions in layer IV. It may be instructive for future researches to focus on the effect of chronic sensory deprivation on the different layers of the cerebral cortex to fully unravel the molecular substrates involved in the plasticity in layer VI, even following the passing of the critical period.
Many lines of studies have investigated the effect of sensory deprivation in cortical layers outside of the main thalamocoritical recipient zones, such as layers II/III and V (Glazewski and Fox 1996; Stern et al. 2001; Maravall et al. 2004; Mataga et al. 2004; Oray et al. 2004; Zuo, Yang, et al. 2005; Holtmaat et al. 2006; Drew and Feldmen 2009; Hofer et al. 2009; Yang et al. 2009; Yu et al. 2013). It has been pointed out that spine dynamics and response to sensory deprivation is cell-type and cortical layer-specific (Holtmaat et al. 2006; Hofer et al. 2009) in in vivo imaging studies, and converging data from in vivo electrophysiological recording have proposed similar ideas (Lee et al. 2007). Furthermore, it is worth noting that sensory deprivation has profound physiological effect on local circuitry of layer II/III (Bender et al. 2006; Shao et al. 2013), where weakening of the synapse that resembles long-term depression following sensory deprivation is observed. It would be particularly instructive for future studies to focus on the changes in spine density and morphology in response to sensory deprivation in these cortical layers that are outside of the main thalamocortical recipient zones.
Activity of NMDARs in Barrel Cortex Greatly Influences Dendritic Protrusion Density and Morphology
Administration of the NMDAR antagonist MK801 during the critical period resulted in an increase in dendritic spine density in both layer IV and layer VI dendrites. The NMDA receptor is a nonspecific cation channel and is expressed on the surface of dendritic spines (Ngo-Anh et al. 2005) at the sites of excitatory synaptic input. Detailed electron microscopy analyses at the ultrastructural level have implicated the importance of NMDAR in glutamate transmission occurring at dendritic spines (Racca et al. 2000). Activity-dependent regulation of synapses requires activation of NMDARs (Malenka and Nicoll 1993; Fox et al. 1996; Huang and Pallas 2001) and changes in sensory experience result in the rearrangement of synapses in the somatosensory cortex (Trachtenberg et al. 2002). Furthermore, it was shown that chronic blockade of the NMDAR decreased the rate of spine elimination (Zuo, Yang, et al. 2005) similarly seen in chronically sensory-deprived barrel cortex, and therefore leads to significantly more numerous dendritic spines overall in the apical dendrites (at the pial surface) that originates from layer V pyramidal neurons. Similarly, in our study, we showed that chronic administration of MK801 leads to elevated density of dendritic protrusions in both layers IV and VI basilar dendrites. It is possible that the stunted rate of spine elimination may have resulted in the elevated density that we observed in these 2 thalamocortical recipient layers. In addition, due to the overall high mortality rate of MK801-administered animals (see Materials and Methods), it is unclear whether or not the survived animals exhibited some unique characteristics in which have allowed them to survive, and whether or not these unique characteristics would have affected the development of their barrel cortex in any way. Also, due to the systemic nature of the MK801 injection, it is possible that there are other nonspecific effects that may also affect dendritic protrusion density.
Withdrawal of MK801 for 1 month and subsequent analysis of dendritic protrusions in layer IV showed a significant decrease in protrusion density from MK801-injected P30 animals (Fig. 9). As the activation of NMDAR is involved in spine elimination, then this decrease in density may be explained by increase of spine elimination in MK801 withdrew mice (Zuo, Yang, et al. 2005). Similarly, withdrawal of the MK801 also caused the layer IV protrusion density for layer VI to return to comparable levels compared with their age-matched controls. Thus, we have shown that the activity of NMDARs is directly involved in the remodeling of dendritic protrusions, and this effect seems to affect both thalamocortical recipient layers in barrel cortex. Other synaptic mechanisms such as metabotropic glutamate receptors, serotonin expression, cell-adhesion molecule dynamics, brain-derived neurotrophic factors have been shown to play a role as facilitators of dendritic plasticity in the cerebral cortex (Washbourne et al. 2004; Maya Vetencourt et al. 2008; Wijetunge et al. 2008), but are beyond the scope of the present study. NMDARs are by far the most understood, and most studied molecular mechanism responsible for synaptic remodeling and plasticity in the brain. Furthermore, our findings indicated that the elevation of dendritic spine density following sensory deprivation is similar to the elevation of dendritic density following chronic blockade of NMDARs. However, this is only true for layer IV but not layer VI. One possibility to explain the differential results seen in layers IV and VI may be due to the fact that the NMDAR is composed of multiple subunits and perhaps different subunits predominate in these 2 cortical layers and respond differentially to changes in afferent activity (Corson et al. 2009). It may be particularly rewarding for future studies to investigate whether sensory deprivation induced changes in dendritic protrusions are directly mediated by the activity of NMDARs, and how cortical layer-specific expression of a variety of bioactive molecules that interacts with NMDARs may contribute to the results seen in the present study.
Methodological Considerations
Golgi staining has been compared with intracellular staining of neurons, and was found to slightly underestimate the density of dendritic protrusions in hippocampal neurons (Ruan et al. 2009). Owing to the resolution of the light microscope that we are using, it is possible that we deviated in estimating the true density and/or the morphological distributions of the dendritic protrusions, since protrusions projecting vertically up or down relative to the objective could be occluded by the dendritic shaft. It is possible due to the resolution of the light microscope (0.2 μm in the horizontal plane and 0.9 μm in the vertical plane) that we misassigned the morphological categories of dendritic protrusions, but such errors (if any) would be still consistent across experimental conditions and independent of protrusion morphology. There are many studies that have categorized spine morphologies based on the available resolutions of light microscopy (Comery et al. 1997; Irwin et al. 2000; Richardson et al. 2009; Dumitriu et al. 2010; Chen, Tam, et al. 2012; González-Burgos et al. 2012; Ferreira et al. 2013; Yu et al. 2013), possibly with each research group having slightly different criteria for each morphological class, due to the heterogeneous nature of the shape of dendritic protrusions. It is conceivable what we considered as mushroom spines would be considered as lollipop spines in another research group, and vice versa. However, such bias should also be consistent across all our developmental and experimental conditions and independent of protrusion morphology.
Owing to histological limitations, we could not reliably investigate any developmental time points prior to P15, as the labeling of the neurons was incomplete, preventing us from visualizing dendritic protrusions reliably, a phenomenon observed similarly in previously published findings using the same technique (Furtak et al. 2007). Work from primate cortices have demonstrated that the density of dendritic protrusions follows an inverted-U shape, in which, at the beginning of the postnatal development, there is a rapid net increase of dendritic spines, presumably when the process of spinogenesis overshadows spine pruning. In nonhuman primates (Rakic et al. 1986) and humans (Huttenlocher 1979; Huttenlocher and Dabholkar 1997), synapse numbers increase significantly for a period of time after birth before undergoing a period of elimination to achieve their adult levels before declining again in old age in nonhuman primates (Dumitriu et al. 2010) and humans (Anderson and Rutledge 1996). This peak spinogenesis is followed by a significant period of developmental spine pruning, in which decreased spine density is observed across a variety of species and in various cortical regions (Elston et al. 2009; Yang et al. 2009; Elston et al. 2010), and seems to be a general rule across mammalian cortices. In the present study, we as others have shown (Leuba 1983; Yang et al. 2009; Orner et al. 2013) that dendritic protrusion density decreases significantly throughout the lifespan of the mouse. It is likely that we did not observe the initial developmental spinogenesis seen in primates given that we were unable to reliably label cells before P15.
In conclusion, previous studies have shown that chronic sensory deprivation can raise the neuronal excitability of the neuron (Simons and Land 1987; Lee et al. 2007), thereby affecting the sensitivity and precision of whisker-related encoding (Carvell and Simons 1996; Lee et al. 2009). Our current study has provided support for a structural correlate of this sensory deprivation induced plasticity in the thalamocortical recipient laminae within the barrel cortex, and demonstrated that this effect is layer-specific, indicating that the different aspects of the neurocircuitry within the same cortical area respond differently to the same sensory manipulation.
Supplementary Material
Supplementary material can be found at: http://www.cercor.oxfordjournals.org/.
Funding
This research was supported by 2 DSC grants to C.-C.C. and NS75875 to J.C.B.
Supplementary Material
Notes
We thank Drs Yi Zuo, Asaf Keller, George Huntley, Randy Bruno, Jonathan Levitt, and Carolyn Pytte for insightful comments and discussion on this manuscript. Conflict of Interest: None declared.
References
- Anderson B, Rutledge V. 1996. Age and hemisphere effects on dendritic structure. Brain. 119:1983–1990. [DOI] [PubMed] [Google Scholar]
- Barrera K, Chu P, Abramowitz J, Steger R, Ramos RL, Brumberg JC. 2013. Organization of myelin in the mouse somatosensory barrel cortex and the effects of sensory deprivation. Dev Neurobiol. 73(4):297–314. [DOI] [PMC free article] [PubMed] [Google Scholar]
- Bender KJ, Allen CB, Bender VA, Feldman DE. 2006. Synaptic basis for whisker deprivation-induced synaptic depression in rat somatosensory cortex. J Neurosci. 26(16):4155–4165. [DOI] [PMC free article] [PubMed] [Google Scholar]
- Briggs F, Callaway EM. 2005. Laminar patterns of local excitatory input to layer 5 neurons in macaque primary visual cortex. Cereb Cortex. 15(5):479–488. [DOI] [PMC free article] [PubMed] [Google Scholar]
- Briner A, De Roo M, Dayer A, Muller D, Kiss JZ, Vutskits L. 2010. Bilateral whisker trimming during early postnatal life impairs dendritic spine development in the mouse somatosensory barrel cortex. J Comp Neurol. 518(10):1711–1723. [DOI] [PubMed] [Google Scholar]
- Bruno RM, Hahn TT, Wallace DJ, de Kock CP, Sakmann B. 2009. Sensory experience alters specific branches of individual corticocortical axons during development. J Neurosci. 29(10):3172–3181. [DOI] [PMC free article] [PubMed] [Google Scholar]
- Carvell GE, Simons DJ. 1996. Abnormal tactile experience early in life disrupts active touch. J Neurosci. 16(8):2750–2757. [DOI] [PMC free article] [PubMed] [Google Scholar]
- Chen CC, Abrams S, Pinhas A, Brumberg JC. 2009. Morphological heterogeneity of layer VI neurons in mouse barrel cortex. J Comp Neurol. 512(6):726–746. [DOI] [PMC free article] [PubMed] [Google Scholar]
- Chen CC, Lu HC, Brumberg JC. 2012. mGluR5 knockout mice display increased dendritic spine densities. Neurosci Lett. 524(1):65–68. [DOI] [PMC free article] [PubMed] [Google Scholar]
- Chen CC, Tam D, Brumberg JC. 2012. Sensory deprivation differentially impacts the dendritic development of pyramidal versus non-pyramidal neurons in layer 6 of mouse barrel cortex. Brain Struct Funct. 217(2):435–446. [DOI] [PMC free article] [PubMed] [Google Scholar]
- Comery TA, Harris JB, Willems PJ, Oostra BA, Irwin SA, Weiler IJ, Greenough WT. 1997. Abnormal dendritic spines in fragile X knockout mice: maturation and pruning deficits. PNAS. 94(10):5401–5404. [DOI] [PMC free article] [PubMed] [Google Scholar]
- Corson J, Nahmani M, Lubarsky K, Badr N, Wright C, Erisir A. 2009. Sensory activity differentially modulates N-methyl-D-aspartate receptor subunits 2A and 2B in cortical layers. Neuroscience. 163(3):920–932. [DOI] [PMC free article] [PubMed] [Google Scholar]
- Cruz-Martín A, Crespo M, Portera-Cailliau C. 2010. Delayed stabilization of dendritic spines in fragile X mice. J Neurosci. 30(23):7793–7803. [DOI] [PMC free article] [PubMed] [Google Scholar]
- Datwani A, Iwasato T, Itohara S, Erzurumlu RS. 2002. NMDA receptor-dependent pattern transfer from afferents to postsynaptic cells and dendritic differentiation in the barrel cortex. Mol Cell Neurosci. 21(3):477–492. [DOI] [PMC free article] [PubMed] [Google Scholar]
- Drew PJ, Feldman DE. 2009. Intrinsic signal imaging of deprivation-induced contraction of whisker representations in rat somatosensory cortex. Cere Cortex. 19(2):331–348. [DOI] [PMC free article] [PubMed] [Google Scholar]
- Dumitriu D, Hao J, Hara Y, Kaufmann J, Janssen WG, Lou W, Rapp PR, Morrison JH. 2010. Selective changes in thin spine density and morphology in monkey prefrontal cortex correlate with aging-related cognitive impairment. J Neurosci. 30(22):7507–7515. [DOI] [PMC free article] [PubMed] [Google Scholar]
- Elston GN, Oga T, Fujita I. 2009. Spinogenesis and pruning scale across functional hierarchies. J Neurosci. 29(10):2371–3275. [DOI] [PMC free article] [PubMed] [Google Scholar]
- Elston GN, Oga T, Okamoto T, Fujita I. 2010. Spinogenesis and pruning from early visual onset to adulthood: an intracellular injection study of layer III pyramidal cells in the ventral visual cortical pathway of the macaque monkey. Cereb Cortex. 20(6):1398–1408. [DOI] [PubMed] [Google Scholar]
- Feldman DE, Brecht M. 2005. Map plasticity in somatosensory cortex. Science. 310(5749):810–815. [DOI] [PubMed] [Google Scholar]
- Ferreira AC, Pinto V, Dá Mesquita S, Novais A, Sousa JC, Correia-Neves M, Sousa N, Palha JA, Marques F. 2013. Lipocalin-2 is involved in emotional behaviors and cognitive function. Front Cell Neurosci. 7:122. [DOI] [PMC free article] [PubMed] [Google Scholar]
- Fox K, Schlaggar BL, Glazewski S, O'Leary DD. 1996. Glutamate receptor blockade at cortical synapses disrupts development of thalamocortical and columnar organization in somatosensory cortex. Proc Natl Acad Sci. 9311:5584–5589. [DOI] [PMC free article] [PubMed] [Google Scholar]
- Fox K, Wong RO. 2005. A comparison of experience-dependent plasticity in the visual and somatosensory systems. Neuron. 48(3):465–477. [DOI] [PubMed] [Google Scholar]
- Fu M, Yu X, Lu J, Zuo Y. 2012. Repetitive motor learning induces coordinated formation of clustered dendritic spines in vivo. Nature. 483(7387):92–95. [DOI] [PMC free article] [PubMed] [Google Scholar]
- Fu M, Zuo Y. 2011. Experience-dependent structural plasticity in the cortex. Trends Neurosci. 34(4):177–187. [DOI] [PMC free article] [PubMed] [Google Scholar]
- Furtak SC, Moyer JR, Jr, Brown TH. 2007. Morphology and ontogeny of rat perirhinal cortical neurons. J Comp Neurol. 505(5):493–510. [DOI] [PubMed] [Google Scholar]
- Glazewski S, Fox K. 1996. Time course of experience-dependent synaptic potentiation and depression in barrel cortex of adolescent rats. J Neurophysiol. 75(4):1714–1729. [DOI] [PubMed] [Google Scholar]
- González-Burgos I, Rivera-Cervantes MC, Velázquez-Zamora DA, Feria-Velasco A, Garcia-Segura LM. 2012. Selective estrogen receptor modulators regulate dendritic spine plasticity in the hippocampus of male rats. Neural Plast, doi:10.1155/2012/309494. [DOI] [PMC free article] [PubMed]
- Harms KJ, Dunaevsky A. 2007. Dendritic spine plasticity: looking beyond development. Brain Res. 1184:65–71. [DOI] [PubMed] [Google Scholar]
- Harris KM, Kater SB. 1994. Dendritic spines: cellular specializations imparting both stability and flexibility to synaptic function. Annu Rev Neurosci. 17:341–371. [DOI] [PubMed] [Google Scholar]
- Harris RM, Woolsey TA. 1981. Dendritic plasticity in mouse barrel cortex following postnatal vibrissa follicle damage. J Comp Neurol. 196(3):357–376. [DOI] [PubMed] [Google Scholar]
- Hofer SB, Mrsic-Flogel TD, Bonhoeffer T, Hübener M. 2009. Experience leaves a lasting structural trace in cortical circuits. Nature. 457(7227):313–317. [DOI] [PMC free article] [PubMed] [Google Scholar]
- Holtmaat A, Wilbrecht L, Knott GW, Welker E, Svoboda K. 2006. Experience-dependent and cell-type-specific spine growth in the neocortex. Nature. 4417096:979–983. [DOI] [PubMed] [Google Scholar]
- Holtmaat A, Svoboda K. 2009. Experience-dependent structural synaptic plasticity in the mammalian brain. Nat. Rev. Neurosci. 10(9):647–658. [DOI] [PubMed] [Google Scholar]
- Huang L, Pallas SL. 2001. NMDA antagonists in the superior colliculus prevent developmental plasticity but not visual transmission or map compression. J Neurophysiol. 86(3):1179–1194. [DOI] [PMC free article] [PubMed] [Google Scholar]
- Huttenlocher PR. 1979. Synaptic density in human frontal cortex—developmental changes and effects of aging. Brain Res. 163:195–205. [DOI] [PubMed] [Google Scholar]
- Huttenlocher PR, Dabholkar AS. 1997. Regional differences in synaptogenesis in human cerebral cortex. J Comp Neurol. 387:167–178. [DOI] [PubMed] [Google Scholar]
- Irwin SA, Galvez R, Greenough WT. 2000. Dendritic spine structural anomalies in Fragile-X mental retardation syndrome. Cereb Cortex. 10:1038–1044. [DOI] [PubMed] [Google Scholar]
- Keller A, Carlson GC. 1999. Neonatal whisker clipping alters intracortical, but not thalamocortical projections, in rat barrel cortex. J Comp Neurol. 412(1):83–94. [DOI] [PubMed] [Google Scholar]
- Kharazia VN, Weinberg RJ. 1994. Glutamate in thalamic fibers terminating in layer IV of primary sensory cortex. J Neurosci. 14(10):6021–6032. [DOI] [PMC free article] [PubMed] [Google Scholar]
- Knott GW, Quairiaux C, Genoud C, Welker E. 2002. Formation of dendritic spines with GABAergic synapses induced by whisker stimulation in adult mice. Neuron. 34(2):265–273. [DOI] [PubMed] [Google Scholar]
- Lee LJ, Chen WJ, Chuang YW, Wang YC. 2009. Neonatal whisker trimming causes long-lasting changes in structure and function of the somatosensory system. Exp Neurol. 219(2):524–532. [DOI] [PubMed] [Google Scholar]
- Lee SH, Land PW, Simons DJ. 2007. Layer- and cell-type-specific effects of neonatal whisker-trimming in adult rat barrel cortex. J Neurophysiol. 97(6):4380–4385. [DOI] [PubMed] [Google Scholar]
- Lendvai B, Stern EA, Chen B, Svoboda K. 2000. Experience-dependent plasticity of dendritic spines in the developing rat barrel cortex in vivo. Nature. 404(6780):876–881. [DOI] [PubMed] [Google Scholar]
- Leuba G. 1983. Aging of dendrites in the cerebral cortex of the mouse. Neuropathol Appl Neurobiol. 9:467–475. [DOI] [PubMed] [Google Scholar]
- Lorente de Nó R. 1949. Cerebral cortex: architecture, intracortical connections, motor projections. Physiology of the nervous system. New York: Oxford University Press; p. 288–330. [Google Scholar]
- Lund JS, Wu CQ. 1997. Local circuit neurons of macaque monkey striate cortex: IV. Neurons of Laminae 1-3A. J Comp Neurol. 384(1):109–126. [DOI] [PubMed] [Google Scholar]
- Malenka RC, Nicoll RA. 1993. NMDA-receptor-dependent synaptic plasticity: multiple forms and mechanisms. Trends Neurosci. 16(12):521–527. [DOI] [PubMed] [Google Scholar]
- Maravall M, Stern EA, Svoboda K. 2004. Development of intrinsic properties and excitability of layer 2/3 pyramidal neurons during a critical period for sensory maps in rat barrel cortex. J Neurophysiol. 92(1):144–156. [DOI] [PubMed] [Google Scholar]
- Mataga N, Mizuguchi Y, Hensch TK. 2004. Experience-dependent pruning of dendritic spines in visual cortex by tissue plasminogen activator. Neuron. 44(6):1031–1041. [DOI] [PubMed] [Google Scholar]
- Maya Vetencourt JF, Sale A, Viegi A, Baroncelli L, De Pasquale R, O'Leary OF, Castrén E, Maffei L. 2008. The antidepressant fluoxetine restores plasticity in the adult visual cortex. Science. 320(5874):385–388. [DOI] [PubMed] [Google Scholar]
- McAllister AK, Katz LC, Lo DC. 1996. Neurotrophin regulation of cortical dendritic growth requires activity. Neuron. 17(6):1057–1064. [DOI] [PubMed] [Google Scholar]
- McRae PA, Rocco MM, Kelly G, Brumberg JC, Matthews RT. 2007. Sensory deprivation alters aggrecan and perineuronal net expression in the mouse barrel cortex. J Neurosci. 27(20):5405–5413. [DOI] [PMC free article] [PubMed] [Google Scholar]
- Nahmani M, Erisir A. 2005. VGluT2 immunochemistry identifies thalamocortical terminals in layer 4 of adult and developing visual cortex. J Comp Neurol. 484(4):458–473. [DOI] [PubMed] [Google Scholar]
- Ngo-Anh TJ, Bloodgood BL, Lin M, Sabatini BL, Maylie J, Adelman JP. 2005. SK channels and NMDA receptors form a Ca2+-mediated feedback loop in dendritic spines. Nat Neurosci. 8(5):642–649. [DOI] [PubMed] [Google Scholar]
- Oray S, Majewska A, Sur M. 2004. Dendritic spine dynamics are regulated by monocular deprivation and extracellular matrix degradation. Neuron. 44(6):1021–1030. [DOI] [PubMed] [Google Scholar]
- Orner DA, Chen CC, Orner DE, Brumberg JC. 2013. Alterations of dendritic protrusions over the first postnatal year of a mouse: an analysis in layer VI of the barrel cortex. Brain Struct Funct [Epub ahead of print]. [DOI] [PubMed]
- Popescu MV, Ebner FF. 2010. Neonatal sensory deprivation and the development of cortical function: unilateral and bilateral sensory deprivation result in different functional outcomes. J Neurophysiol. 104(1):98–107. [DOI] [PubMed] [Google Scholar]
- Prescott TJ, Mitchinson B, Grant RA. 2011. Vibrissal behavior and function. Scholarpedia. 6(10):6642. [Google Scholar]
- Prieto JJ, Winer JA. 1999. Layer VI in cat primary auditory cortex: Golgi study and sublaminar origins of projection neurons. J Comp Neurol. 404:332–358. [DOI] [PubMed] [Google Scholar]
- Racca C, Stephenson FA, Streit P, Roberts JD, Somogyi P. 2000. NMDA receptor content of synapses in stratum radiatum of the hippocampal CA1 area. J Neurosci. 20(7):2512–2522. [DOI] [PMC free article] [PubMed] [Google Scholar]
- Rakic P, Bourgeois JP, Eckenhoff MF, Zecevic N, Goldman-Rakic PS. 1986. Concurrent overproduction of synapses in diverse regions of the primate cerebral cortex. Science. 232:232–235. [DOI] [PubMed] [Google Scholar]
- Rausch G, Scheich H. 1982. Dendritic spine loss and enlargement during maturation of the speech control system in the mynah bird (gracula religiosa). Neurosci Lett. 29(2):129–133. [DOI] [PubMed] [Google Scholar]
- Richardson RJ, Blundon JA, Bayazitov IT, Zakharenko SS. 2009. Connectivity patterns revealed by mapping of active inputs on dendrites of thalamorecipient neurons in the auditory cortex. J Neurosci. 29(20):6406–6417. [DOI] [PMC free article] [PubMed] [Google Scholar]
- Ruan YW, Lei Z, Fan Y, Zou B, Xu ZC. 2009. Diversity and fluctuation of spine morphology in CA1 pyramidal neurons after transient global ischemia. J Neurosci Res. 87:61–68. [DOI] [PubMed] [Google Scholar]
- Segal M. 2005. Dendritic spines and long-term plasticity. Nat. Rev. Neurosci. 6(4):277–284. [DOI] [PubMed] [Google Scholar]
- Shao YR, Isett BR, Miyashita T, Chung J, Pourzia O, Gasperini RJ, Feldman DE. 2013. Plasticity of Recurrent L2/3 Inhibition and Gamma Oscillations by Whisker Experience. Neuron. 80(1):210–222. [DOI] [PMC free article] [PubMed] [Google Scholar]
- Sholl DA. 1956. The organization of the cerebral cortex. New York: John Wiley Press. [Google Scholar]
- Shoykhet M, Land PW, Simons DJ. 2005. Whisker trimming begun at birth or on postnatal day 12 affects excitatory and inhibitory receptive fields of layer IV barrel neurons. J Neurophysiol. 94(6):3987–3995. [DOI] [PubMed] [Google Scholar]
- Simons DJ, Land PW. 1987. Early experience of tactile stimulation influences organization of somatic sensory cortex. Nature. 326(6114):694–697. [DOI] [PubMed] [Google Scholar]
- Stern EA, Maravall M, Svoboda K. 2001. Rapid development and plasticity of layer 2/3 maps in rat barrel cortex in vivo. Neuron. 31(2):305–315. [DOI] [PubMed] [Google Scholar]
- Trachtenberg JT, Chen BE, Knott GW, Feng G, Sanes JR, Welker E, Svoboda K. 2002. Long-term in vivo imaging of experience-dependent synaptic plasticity in adult cortex. Nature. 420(6917):788–794. [DOI] [PubMed] [Google Scholar]
- Valverde F. 1998. Golgi atlas of the postnatal mouse. Austria: Springer-Verlay/Wein. [Google Scholar]
- Van der Loos H, Woolsey TA. 1973. Somatosensory cortex: structural alterations following early injury to sense organs. Science. 179(71):395–398. [DOI] [PubMed] [Google Scholar]
- Washbourne P, Dityatev A, Scheiffele P, Biederer T, Weiner JA, Christopherson KS, El-Husseini A. 2004. Cell adhesion molecules in synapse formation. J Neurosci. 24(42):9244–9249. [DOI] [PMC free article] [PubMed] [Google Scholar]
- Weller WL, Johnson JI. 1975. Barrels in cerebral cortex altered by receptor disruption in newborn, but not in five-day-old mice (Cricetidoe and Muridae). Brain Res. 83(3):504–508. [DOI] [PubMed] [Google Scholar]
- White EL. 1978. Identified neurons in mouse Sml cortex which are postsynaptic to thalamocortical axon terminals: a combined Golgi-electron microscopic and degeneration study. J Comp Neurol. 181(3):627–661. [DOI] [PubMed] [Google Scholar]
- Wijetunge LS, Till SM, Gillingwater TH, Ingham CA, Kind PC. 2008. mGluR5 regulates glutamate-dependent development of the mouse somatosensory cortex. J Neurosci. 28(49):13028–13037. [DOI] [PMC free article] [PubMed] [Google Scholar]
- Wimmer VC, Broser PJ, Kuner T, Bruno RM. 2010. Experience-induced plasticity of thalamocortical axons in both juveniles and adults. J Comp Neurol. 15;518(22):4629–4648. [DOI] [PubMed] [Google Scholar]
- Woolsey TA, Wann JR. 1975. Areal changes in mouse cortical barrels following vibrissal damage at different postnatal ages. J Comp Neurol. 170(1):53–66. [DOI] [PubMed] [Google Scholar]
- Xu T, Yu X, Perlik AJ, Tobin WF, Zweig JA, Tennant K, Jones T, Zuo Y. 2009. Rapid formation and selective stabilization of synapses for enduring motor memories. Nature. 462(7275):915–919. [DOI] [PMC free article] [PubMed] [Google Scholar]
- Yang G, Pan F, Gan WB. 2009. Stably maintained dendritic spines are associated with lifelong memories. Nature. 462(7275):920–924. [DOI] [PMC free article] [PubMed] [Google Scholar]
- Yu X, Wang G, Gilmore A, Yee AX, Li X, Xu T, Smith SJ, Chen L, Zuo Y. 2013. Accelerated experience-dependent pruning of cortical synapses in ephrin-A2 knockout mice. Neuron. 80(1):64–71. [DOI] [PMC free article] [PubMed] [Google Scholar]
- Zuo Y, Lin A, Chang P, Gan WB. 2005. Development of long-term dendritic spine stability in diverse regions of cerebral cortex. Neuron. 46(2):181–189. [DOI] [PubMed] [Google Scholar]
- Zuo Y, Yang G, Kwon E, Gan WB. 2005. Long-term sensory deprivation prevents dendritic spine loss in primary somatosensory cortex. Nature. 436(7048):261–265. [DOI] [PubMed] [Google Scholar]
Associated Data
This section collects any data citations, data availability statements, or supplementary materials included in this article.